How to display and debug NodeJS errors using Llama Logs?
This article introduces you to the Node development artifact-Llama Logs. Use Llama Logs to visualize Node errors in real time. It has certain reference value. Friends in need can refer to it. I hope it will be helpful to everyone.

Related recommendations: "nodejs Tutorial"
Do you want to know what happens inside the program? Want to visually inspect its inner workings?
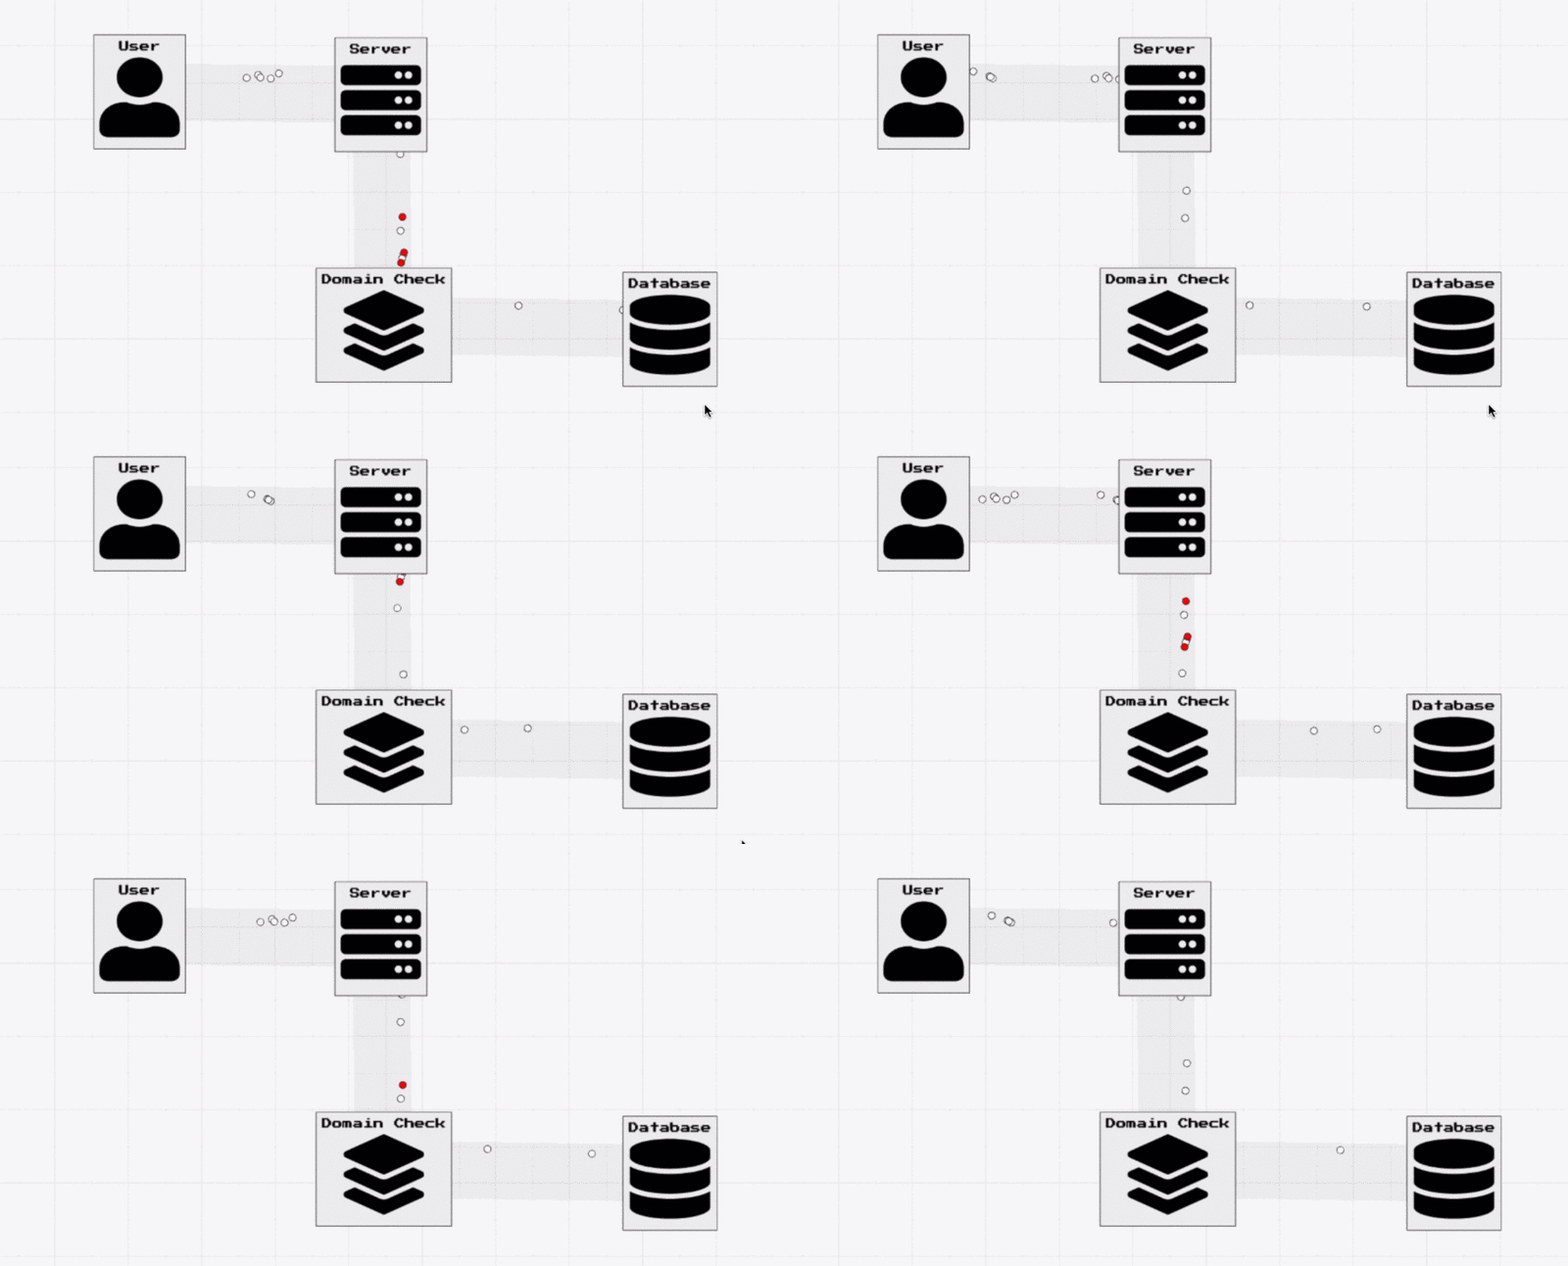
The above animation shows an example of Llama Logs. It's a new tool I created that lets you see the inner workings of your application in real time. It's ready and you can start using it in your applications for free.
Below, I will demonstrate through an example how to use Llama Logs to display and debug errors that occur in a basic Express application.
Start
I will write a basic quick app that receives the user's email via a url parameter and if the email is llamalogs .com domain, save it to the database.
The basic logic will be as follows
app.get('/', (req, res) => {
  let customerEmail = req.query.email
  let isDomainOk = domainCheck(customerEmail)

  if (isDomainOk) {
      saveEmail(customerEmail)
  }

  res.send('We received your email')
})Now the problem is that I have to write some code that checks if the user forgets to include the @domain part in the email. Something will go wrong.
const domainCheck = (customerEmail) => {
  // toLowerCase will fail if the [1] value is undefined!
  const domain = customerEmail.split("@")[1].toLowerCase()
  const domainIsOk = domain === "llamalogs.com"
  return domainIsOk
}Visualization with Llama Logs
Llama Logs is very easy to set up. Once you've signed up for llamalogs.com, all you need to do is install the client via npm and start logging, and Llama Logs will automatically convert your logs into interactive graphs.
So, for example, let's update the domainCheck method to the following
const domainCheck = (customerEmail) => {
  try {
    const domain = customerEmail.split("@")[1].toLowerCase()
    const domainIsOk = domain === "llamalogs.com"

    LlamaLogs.log({ sender: 'Server', receiver: 'Domain Check' })

    return domainIsOk

  } catch (e) {
    LlamaLogs.log({
      sender: 'Server',
      receiver: 'Domain Check',
      message: `input: ${customerEmail}; Error: ${e}`,
      isError: true
    })
  }
} We add a log case for both successful and failed results. Llama Logs will then automatically visualize the activity in the application as a series of events between components using the names provided in the sender, receiver and isError properties. Moving points.
In the graphic below we can see the results of running several calls to the server with valid emails and the call that caused the error.

Debugging
Better than visualizing activity in charts, Llama Logs lets you get data from errors in real time.
Remember in the domainCheck method we attached this property to Llama Log?
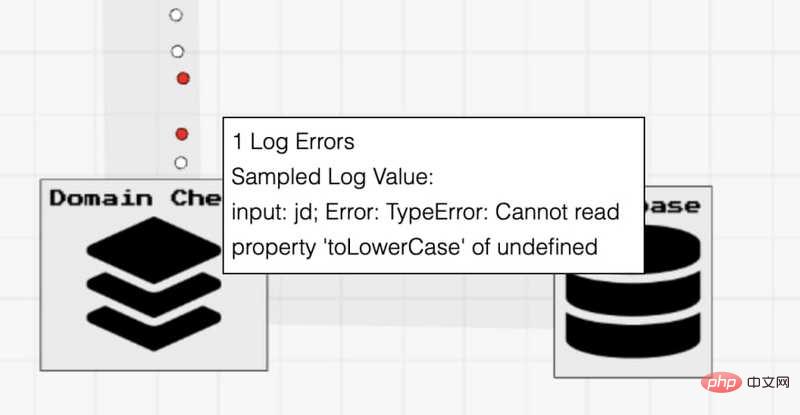
message: `input: ${customerEmail}; Error: ${e}`,By using this message attribute, it means that when we hover the mouse over the red error point, it will display the message. The image below shows the error I'm stuck on, it says the request has the email parameter == "jd", and the email domain is missing.

By visualizing errors in your system with Llama Logs, you can discover the source of errors faster and easier than ever!
More information
Interested friends please visit https://llamalogs.com/ for more information. The app is free and available today. If you have any questions, please feel free to contact me at andrew@llamalogs.com.
Full Code
I think this is a small Express application and the easiest way is to include all the code in this blog post.
const express = require('express')
const { LlamaLogs } = require('llamalogs');

LlamaLogs.init({
  accountKey: 'YOUR_ACCOUNT_KEY',
  graphName: 'YOUR_GRAPH_NAME'
});

const app = express()
const port = 3000

app.get('/', (req, res) => {
  LlamaLogs.log({ sender: 'User', receiver: 'Server' })

  let customerEmail = req.query.email
  let isDomainOk = domainCheck(customerEmail)

  if (isDomainOk) {
      saveEmail(customerEmail)
  }

  res.send('We received your email')
})

app.listen(port, () => {
  console.log(`Example app listening at http://localhost:${port}`)
})


const domainCheck = (customerEmail) => {
  try {
    const domain = customerEmail.split("@")[1].toLowerCase()
    const domainIsOk = domain === "llamalogs.com"

    LlamaLogs.log({ sender: 'Server', receiver: 'Domain Check' })

    return domainIsOk

  } catch (e) {
    LlamaLogs.log({
      sender: 'Server',
      receiver: 'Domain Check',
      message: `input: ${customerEmail}; Error: ${e}`,
      isError: true
    })
  }
}

const saveEmail = (customerEmail) => {
  // pretend we are saving to a database here
  LlamaLogs.log({ sender: 'Domain Check', receiver: 'Database' })
}Original text: https://dev.to/bakenator/visualize-nodejs-errors-in-real-time-with-llama-logs-3c18
Author: bakenator
Translation address: https://segmentfault.com/a/1190000025186252
For more programming-related knowledge, please visit: Programming Video! !
The above is the detailed content of How to display and debug NodeJS errors using Llama Logs?. For more information, please follow other related articles on the PHP Chinese website!

Hot AI Tools

Undresser.AI Undress
AI-powered app for creating realistic nude photos

AI Clothes Remover
Online AI tool for removing clothes from photos.

Undress AI Tool
Undress images for free

Clothoff.io
AI clothes remover

Video Face Swap
Swap faces in any video effortlessly with our completely free AI face swap tool!

Hot Article

Hot Tools

Notepad++7.3.1
Easy-to-use and free code editor

SublimeText3 Chinese version
Chinese version, very easy to use

Zend Studio 13.0.1
Powerful PHP integrated development environment

Dreamweaver CS6
Visual web development tools

SublimeText3 Mac version
God-level code editing software (SublimeText3)

Hot Topics
 1392
1392
 52
52
 36
36
 110
110
 Detailed graphic explanation of the memory and GC of the Node V8 engine
Mar 29, 2023 pm 06:02 PM
This article will give you an in-depth understanding of the memory and garbage collector (GC) of the NodeJS V8 engine. I hope it will be helpful to you!
 An article about memory control in Node
Apr 26, 2023 pm 05:37 PM
The Node service built based on non-blocking and event-driven has the advantage of low memory consumption and is very suitable for handling massive network requests. Under the premise of massive requests, issues related to "memory control" need to be considered. 1. V8’s garbage collection mechanism and memory limitations Js is controlled by the garbage collection machine
 Let's talk about how to choose the best Node.js Docker image?
Dec 13, 2022 pm 08:00 PM
Choosing a Docker image for Node may seem like a trivial matter, but the size and potential vulnerabilities of the image can have a significant impact on your CI/CD process and security. So how do we choose the best Node.js Docker image?
 Let's talk in depth about the File module in Node
Apr 24, 2023 pm 05:49 PM
The file module is an encapsulation of underlying file operations, such as file reading/writing/opening/closing/delete adding, etc. The biggest feature of the file module is that all methods provide two versions of **synchronous** and **asynchronous**, with Methods with the sync suffix are all synchronization methods, and those without are all heterogeneous methods.
 Node.js 19 is officially released, let's talk about its 6 major features!
Nov 16, 2022 pm 08:34 PM
Node 19 has been officially released. This article will give you a detailed explanation of the 6 major features of Node.js 19. I hope it will be helpful to you!
 Let's talk about the GC (garbage collection) mechanism in Node.js
Nov 29, 2022 pm 08:44 PM
How does Node.js do GC (garbage collection)? The following article will take you through it.
 Let's talk about the event loop in Node
Apr 11, 2023 pm 07:08 PM
The event loop is a fundamental part of Node.js and enables asynchronous programming by ensuring that the main thread is not blocked. Understanding the event loop is crucial to building efficient applications. The following article will give you an in-depth understanding of the event loop in Node. I hope it will be helpful to you!
 What should I do if node cannot use npm command?
Feb 08, 2023 am 10:09 AM
The reason why node cannot use the npm command is because the environment variables are not configured correctly. The solution is: 1. Open "System Properties"; 2. Find "Environment Variables" -> "System Variables", and then edit the environment variables; 3. Find the location of nodejs folder; 4. Click "OK".


