 headlines
 Chrome performance has been greatly improved! (Interpretation of new features of Chrome 87)
Chrome performance has been greatly improved! (Interpretation of new features of Chrome 87)
Today Chrome was updated to the latest version 87. This is the last Chrome update this year. This version is the biggest improvement in Chrome performance in many years, and the developer tools have also been significantly updated.
Some users believe that Chrome’s performance issues have been criticized for a long time. However, after the new Edge came out, the performance suddenly improved. This is obviously due to Google’s impact on Edge’s market share. increased pressure.
In addition, Chrome on Mac has also updated its icon, which should be designed specifically to adapt to Big Sur.
Original text: https://developers.google.com/web/updates/2020/10/devtools
PS: The latest Chrome update video is narrated by a Japanese woman , this spoken English is really intoxicating...
1. New CSS Grid debugging tool
Now DevTools has better support for CSS Grid support.
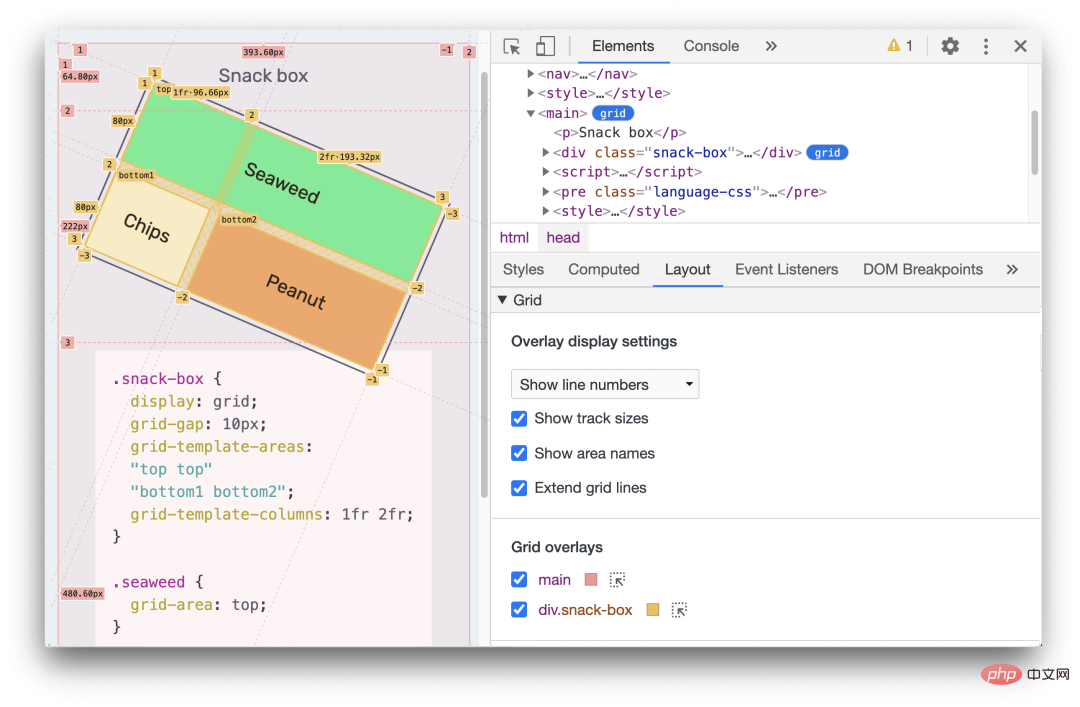
When the HTML element on the page has display: grid or display: inline-grid, you can see a Grid tag next to it in the Elements panel. Click the marker to toggle the highlighting of the Grid overlay on the page.
The new Layout subpanel has a Grid tab that provides some options for viewing the Grid.
View the documentation for more information.
Corresponds to Chromium issue: 1047356
2. New WebAuthn panel
It is now possible to simulate the authenticator and debug using the new WebAuthn tab Web Authentication API.
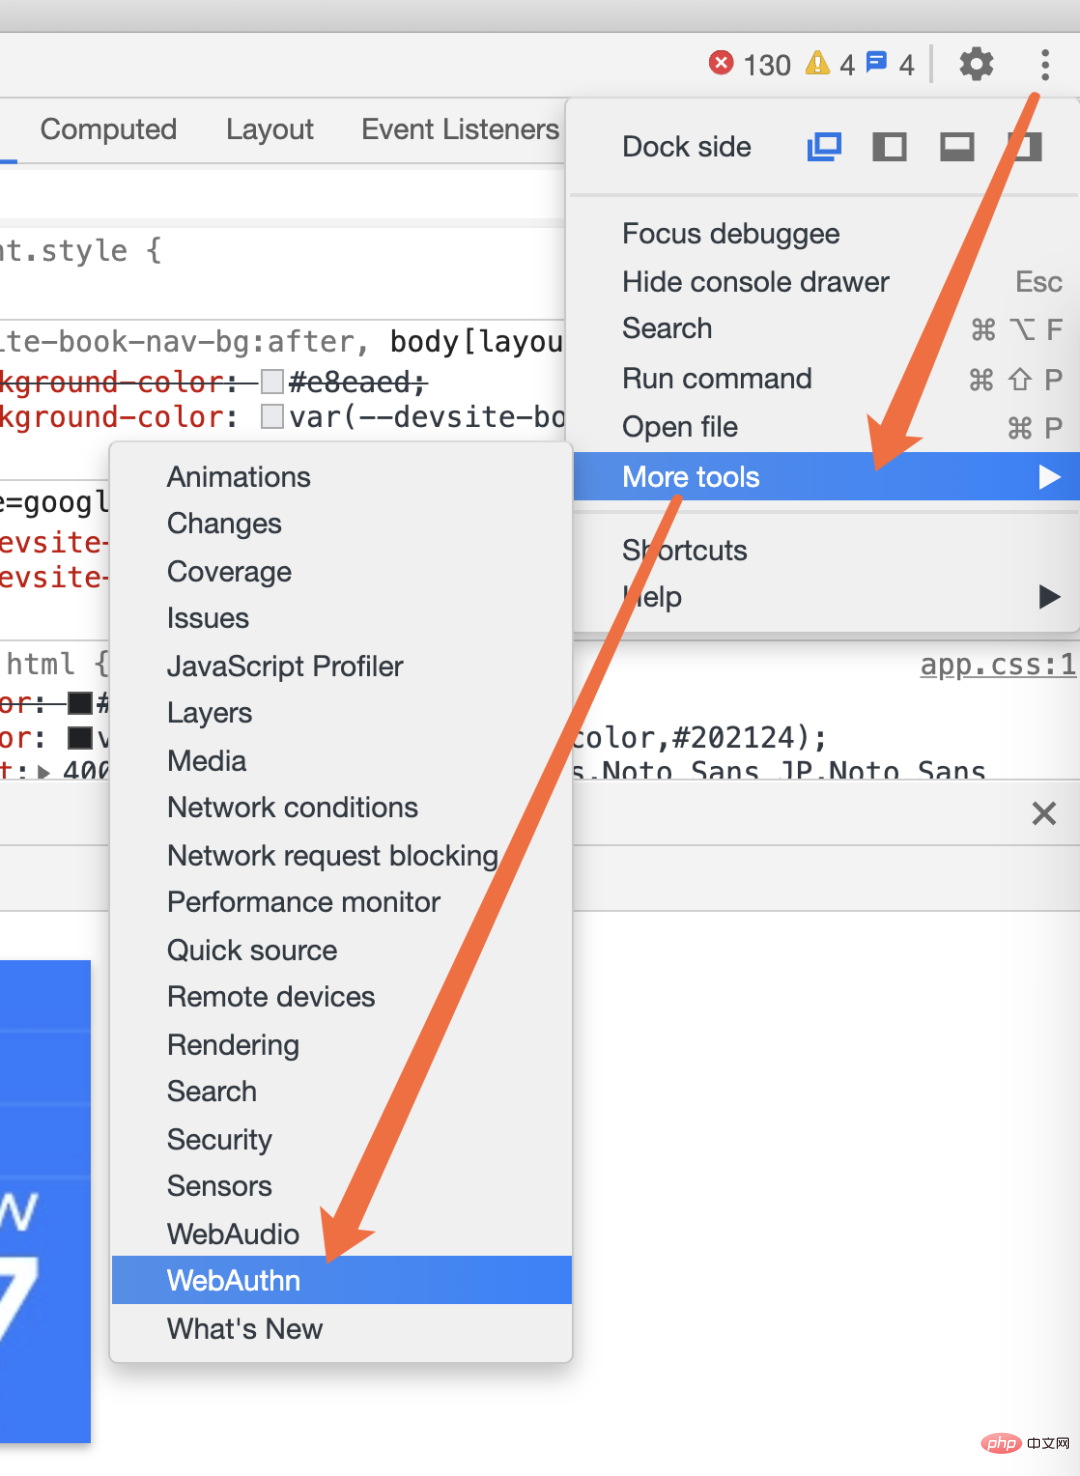
Select More options > More tools > WebAuthn as shown to open the WebAuthn panel.
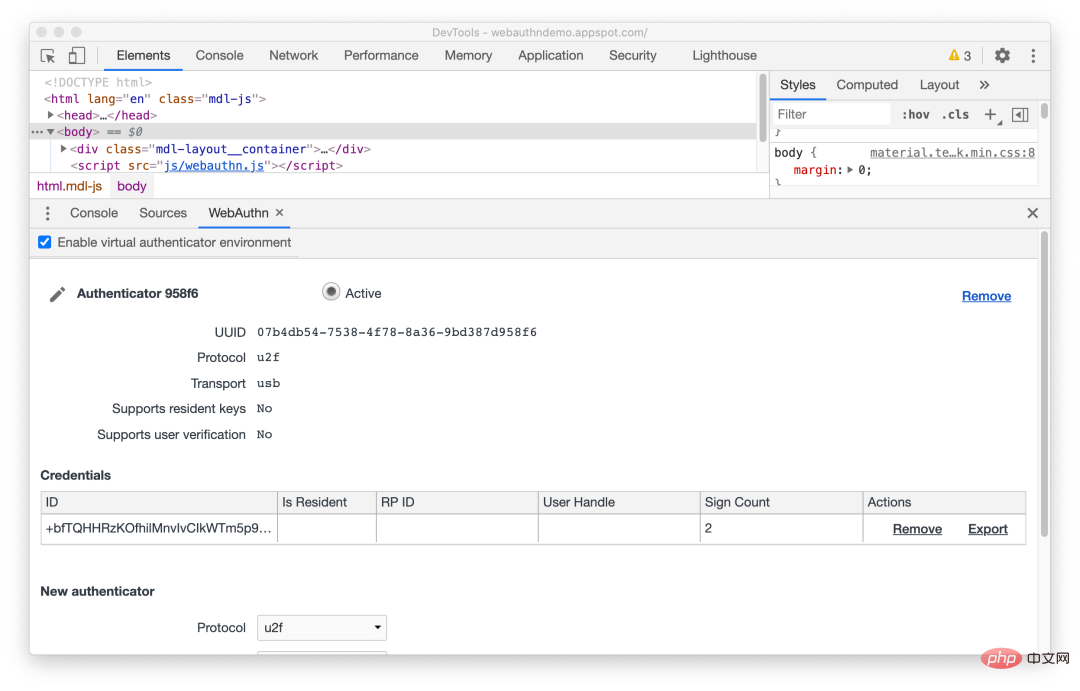
Until the WebAuthn tab appears, native WebAuthn debugging is not supported on Chrome. Developers need physical authenticators to test their web applications.
With the new WebAuthn tag, web developers can now simulate authenticators, customize their functionality, and check their status without the need for any physical authenticators. This makes the debugging experience easier.
View our documentation to learn more about the WebAuthn feature.
Corresponds to Chromium issue: 1034663
3. The developer tools panel now supports vertical split screen
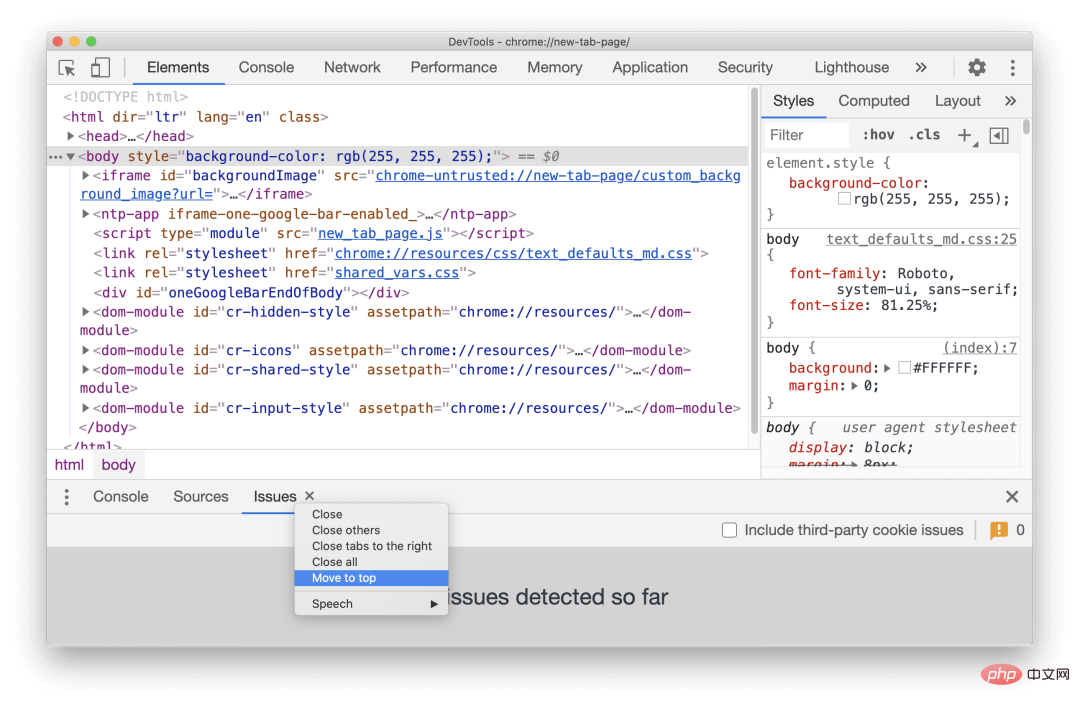
DevTools now supports moving the DevTools tool panel to Top and bottom, this way any two tool panels can be viewed in split screen at the same time.
For example, if you want to view both the Elements and Sources panels, you can right-click the Sources panel and select Move to Bottom.
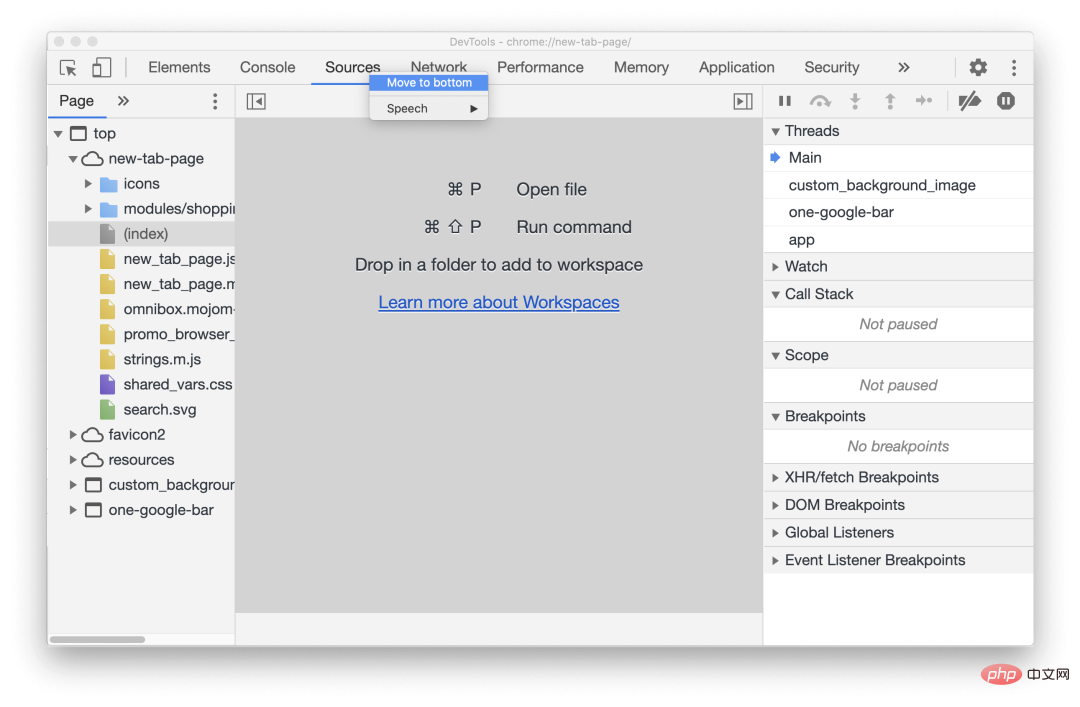
Similarly, any bottom tab can be moved to the top by right-clicking the tab and selecting Move to top.
4. Elements panel function update
4.1 In the Styles sub-panel View the Computed sidebar in
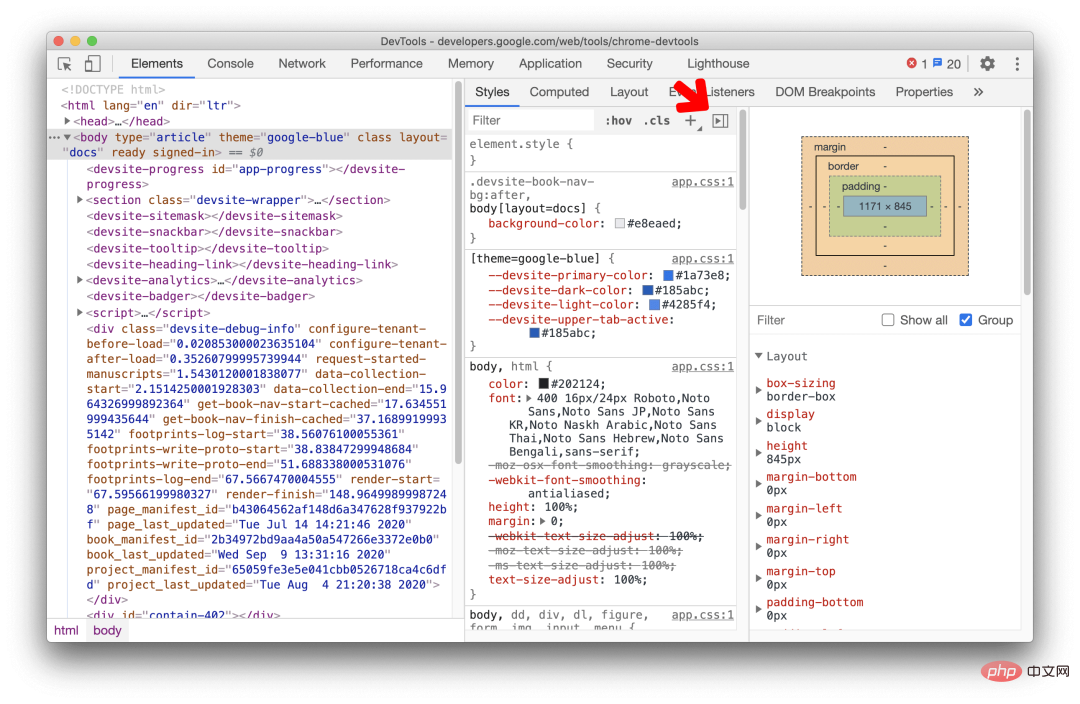
You can now toggle the Computed sidebar in the Styles panel.
By default, the Computed sidebar in the Styles panel is collapsed, and you can click the button to switch to the expanded state.
Corresponds to Chromium issue: 1073899
4.2 Grouping CSS properties in the Computed panel
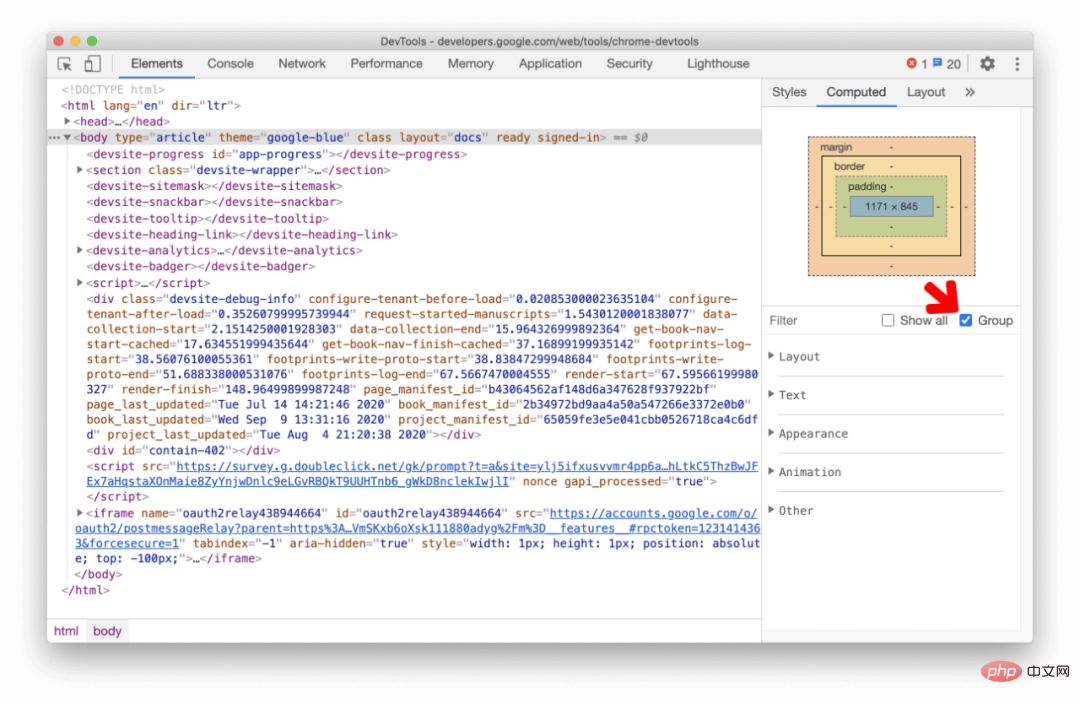
CSS properties can now be grouped by category in the Computed sidebar.
With this new grouping feature, it’s even easier to find and selectively focus on a group of related CSS properties in Computed.
On the Elements panel, select an element and click the Group checkbox to group/ungroup CSS properties.
Corresponds to Chromium issues: 1096230, 1084673, 1106251
5. Lighthouse updates Lighthouse 6.4
Lighthouse panel is now updated to Lighthouse 6.4, check the release notes to see the complete list of new features.
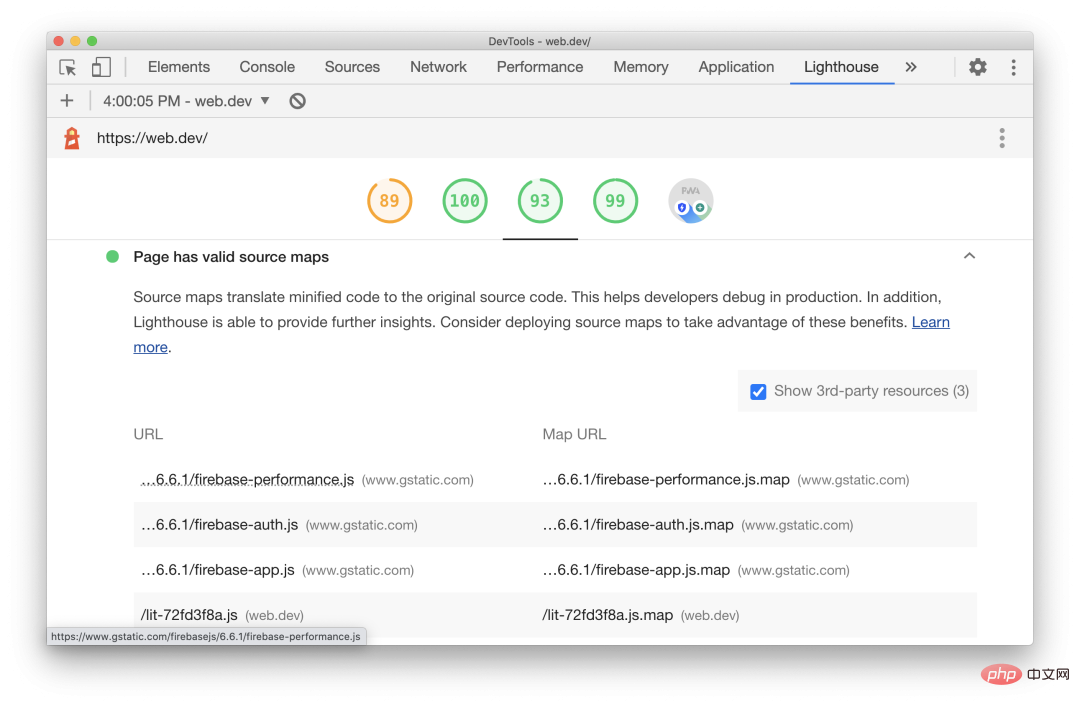
New features in Lighthouse 6.4:
Preload fonts: Report whether all font files using font-display: optional are preloaded Into
Valid sourcemaps: Report whether the sourcemap files for non-third-party JS on the page are correct
Large JavaScript library (Experimental feature): Report The large JS library on the page (for example: moment.js)
corresponds to Chromium issue: 772558
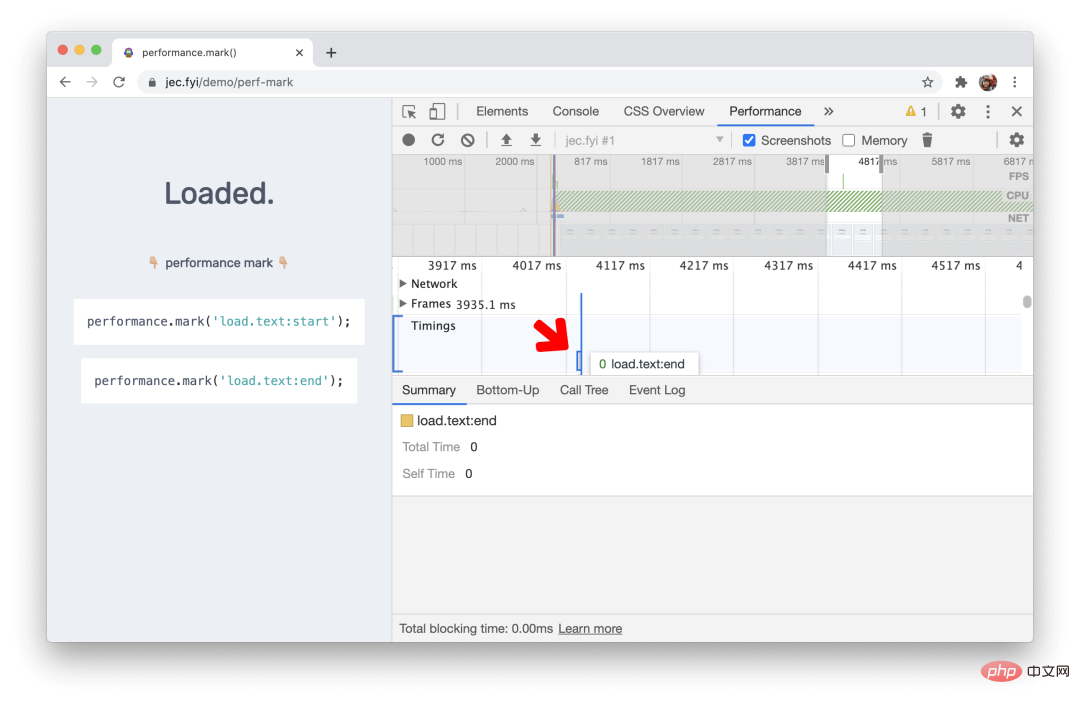
6. In the Event Line (Timings) in the Performance panel, go to Marking performance.mark() events
The Timing section of the Performance panel record now marks Performance.mark() events.
7. Network panel adds new resource-type and url filter conditions
Network requests can now be filtered using the resource-type and url keywords in the Network panel.
For example, use resource-type: image to filter out network requests for images.
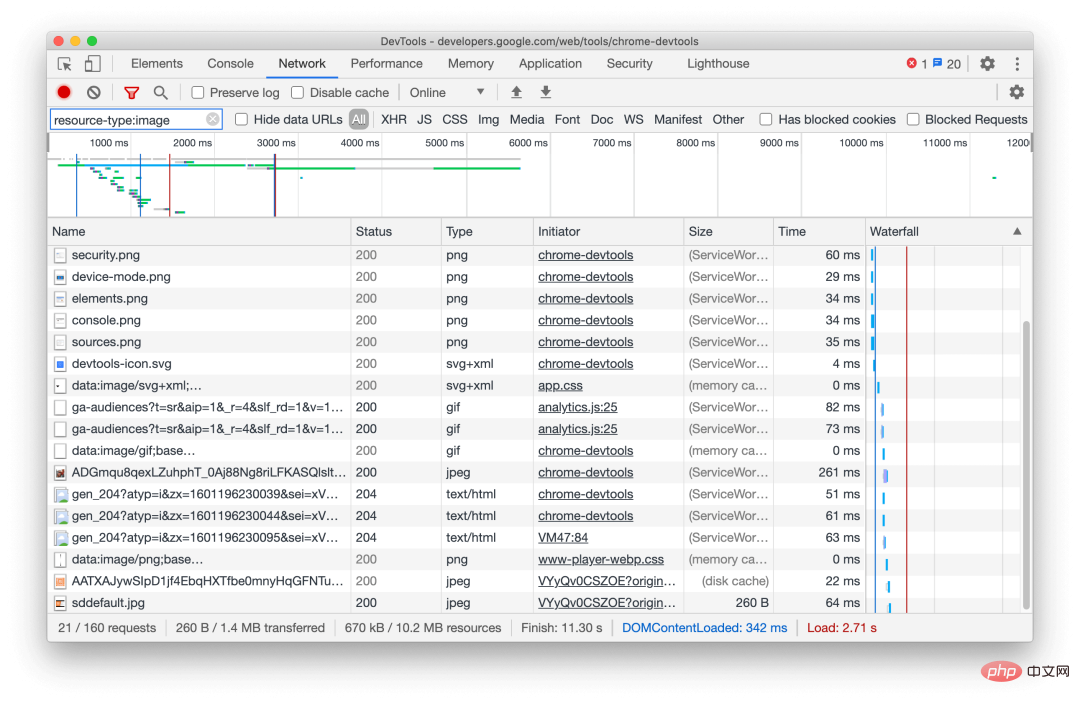
Click on more filter conditions to see more similar to resource-type and # Filter usage of ##url.
8. Updates related to the Frames sub-panel in the Application panel
8.1 Support display## The reporting-to fields for #COEP and COOP
(Cross-Origin Embedder Policy) and COOP (Cross-Origin Opener Policy). Reporting Api defines a new HTTP Header called Report-To. When there is a violation of
(Cross-Origin Embedder Policy) and COOP (Cross -Origin Opener Policy), the browser will send the report to the address specified in this header.
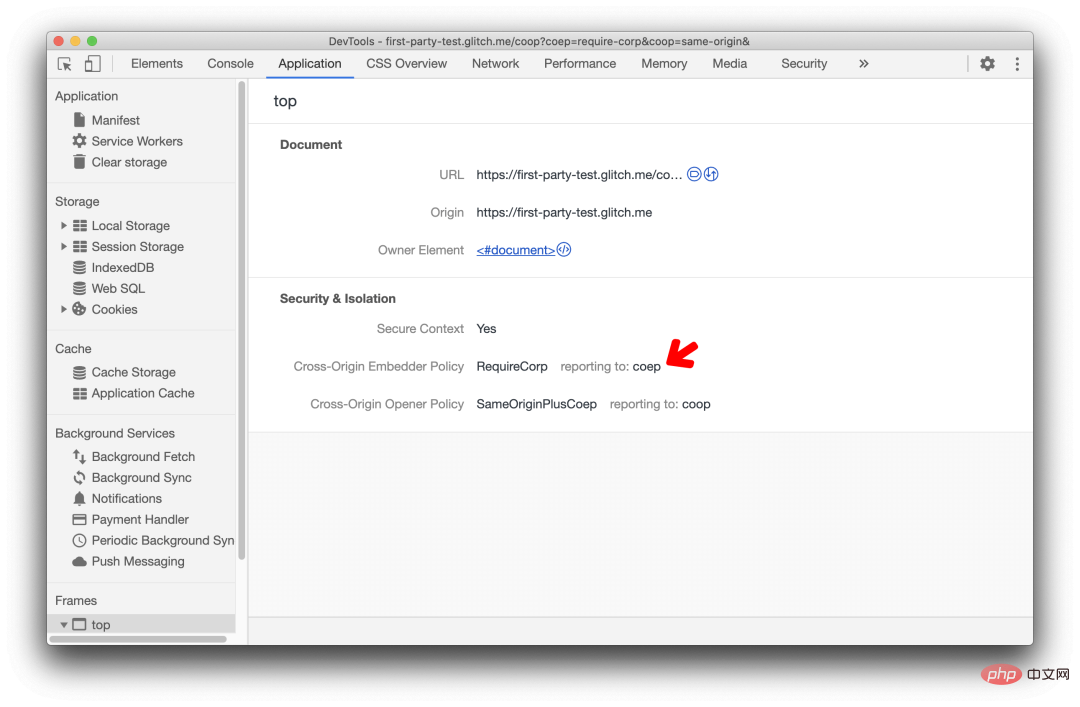 reporting to endpoint
and COOP to make your website cross-origin For cross-origin isolated, you can view this articleCorresponding to Chromium issue: 1051466
Devtools For the case where COEP and COOP are report-only, a new label display is added
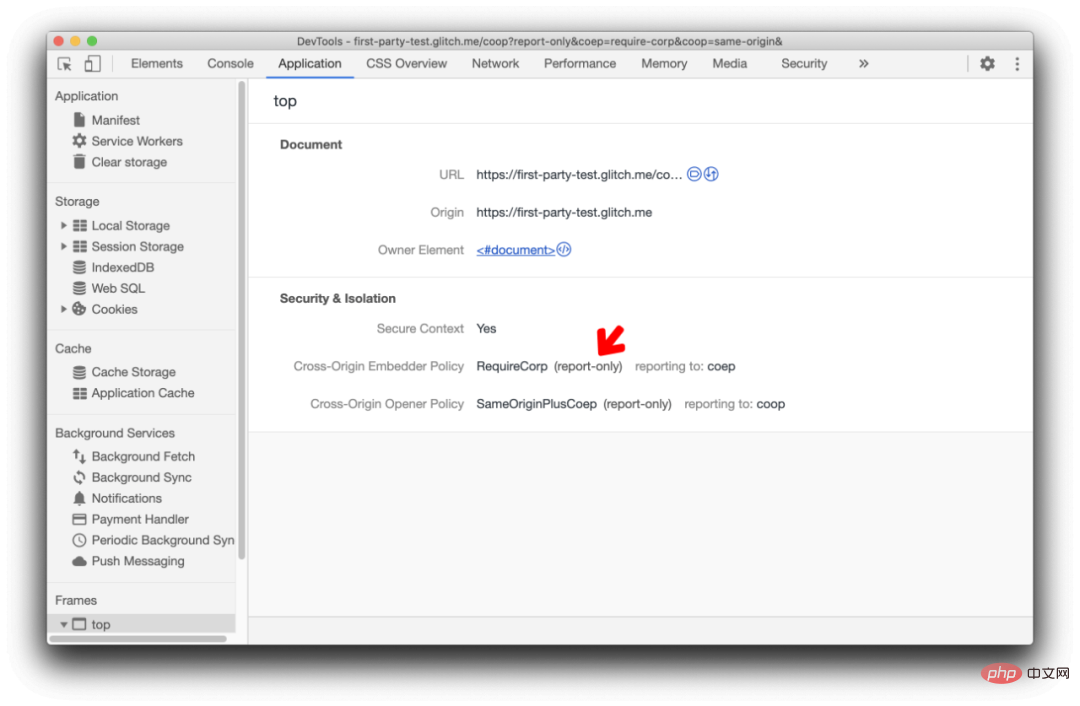 report-only label
Corresponds to Chromium issue: 1051466
9. Remove the Setting button in the More tools menuSetting in the More tools menu is no longer recommended. , please open Setting from the main panel.
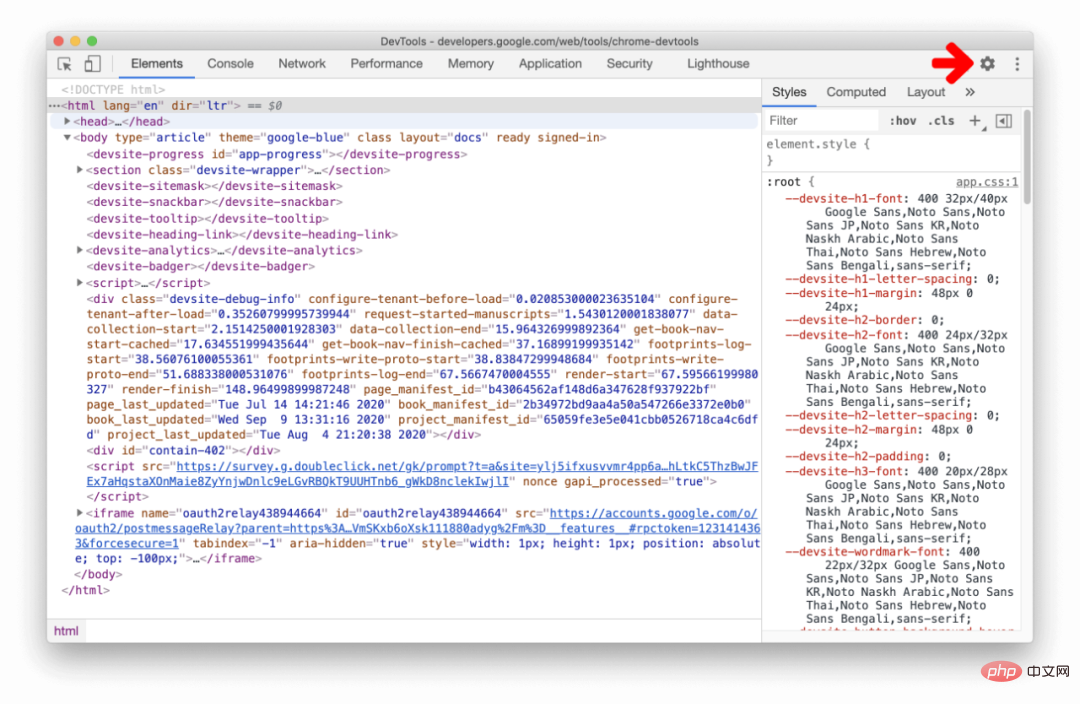 Settings in the main panel
The following features all need to enable the relevant options under Settings > Experiments
10.1 The CSS Overview panel supports viewing and repairing color contrast issuesCSS Overview panel display A list of colors for low-contrast text on your page.
This Demo page shows a negative case of low color contrast. Open this CSS Overview panel to view a list of all problematic elements.
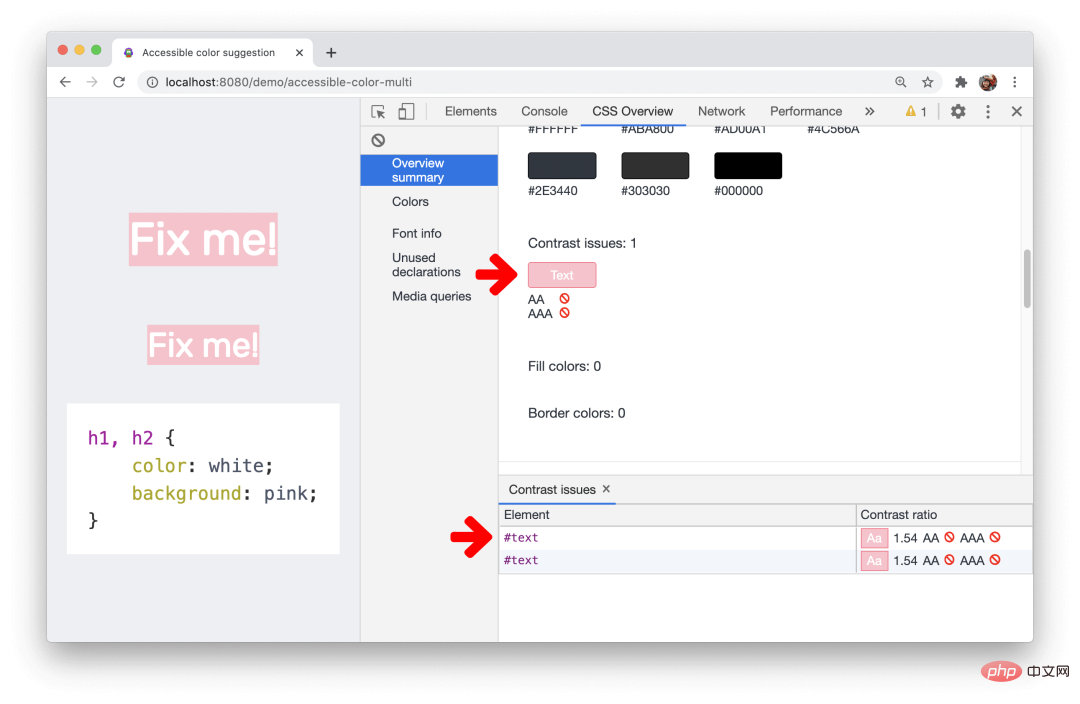 Low color contrast issues
Corresponds to Chromium issue: 1120316
10.2 DevTools supports custom keyboard shortcutsYou can now customize keyboard shortcuts in DevTools.
Go to Settings > Shortcuts, hover the mouse over a command, and click the Edit button to customize the shortcut keys.
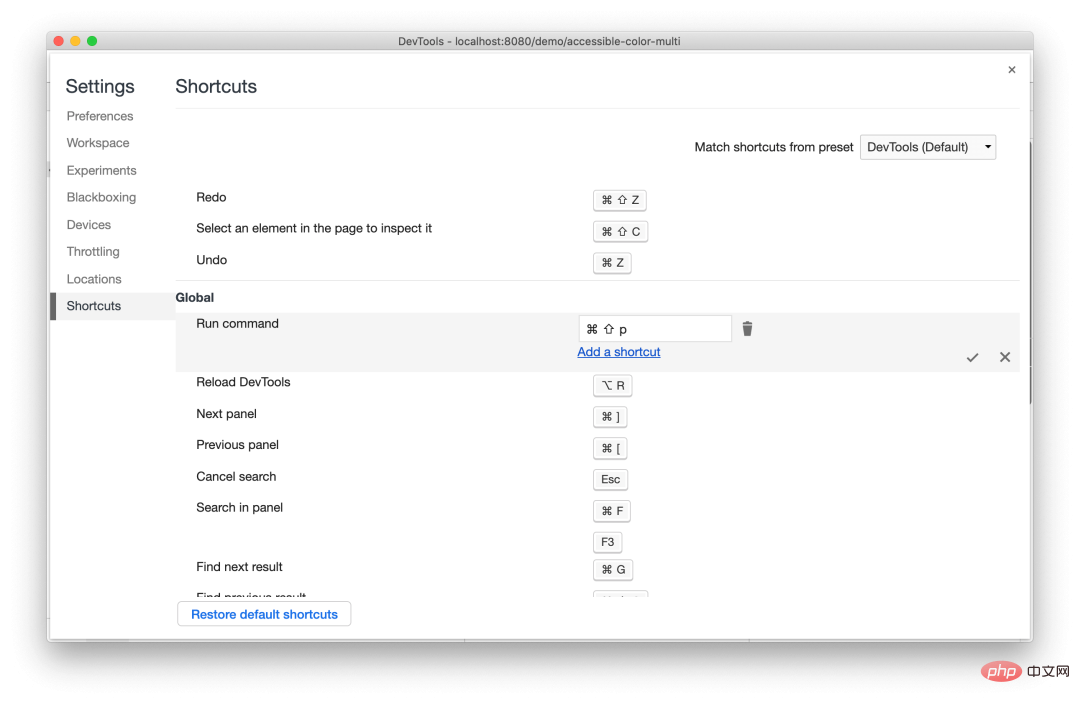 Customize keyboard shortcuts
corresponds to Chromium issue: 174309

Hot AI Tools

Undresser.AI Undress
AI-powered app for creating realistic nude photos

AI Clothes Remover
Online AI tool for removing clothes from photos.

Undress AI Tool
Undress images for free

Clothoff.io
AI clothes remover

Video Face Swap
Swap faces in any video effortlessly with our completely free AI face swap tool!

Hot Article

Hot Tools

Notepad++7.3.1
Easy-to-use and free code editor

SublimeText3 Chinese version
Chinese version, very easy to use

Zend Studio 13.0.1
Powerful PHP integrated development environment

Dreamweaver CS6
Visual web development tools

SublimeText3 Mac version
God-level code editing software (SublimeText3)

Hot Topics
 1386
1386
 52
52

