1. Simulate slow network and slow devices
We may be used to the Internet speed in cities, which is a leverage, but it does not mean that the Internet speed is the same in every country in China. In some remote places, the Internet speed is still pitifully slow, so sometimes the products we make need to consider the situation of slow Internet speed. So how to simulate it?
Open the performance tab of Google Chrome and click the gear icon in the upper right corner to see the simulation of Newwork and CPU Condition.

2. Color selector
Click the small square representing the color to pop up the color selector.
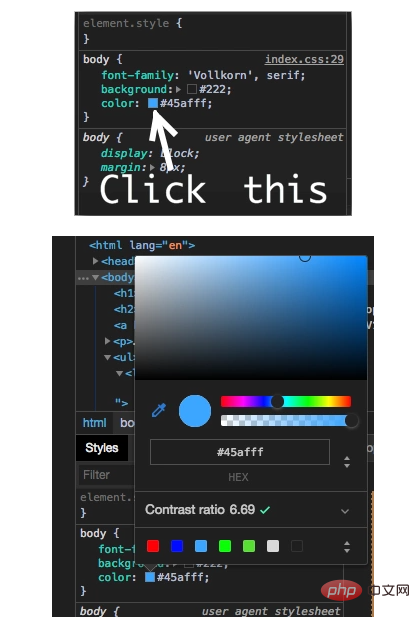
When the color picker is enabled, you can hover over the webpage and use the color picker to get the color of that pixel.
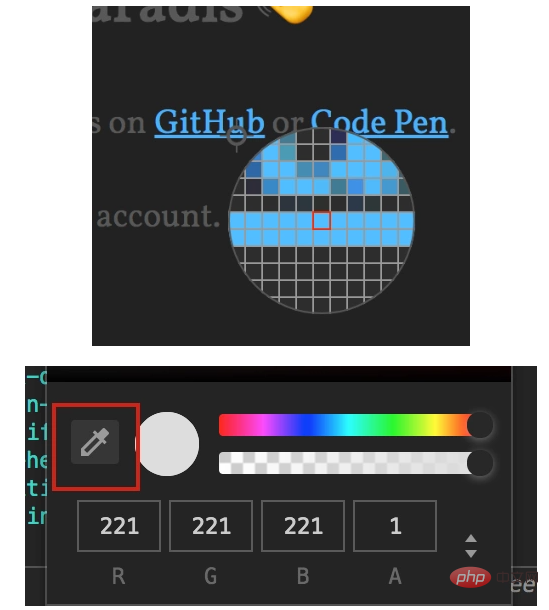
#The small square that pops up the color picker also has the shortcut key Press and hold Shift and click to change the color format.
3. Audits
Audits (audit), this function has always existed, but after chrome 60, earth-shaking changes have taken place: the introduction of Google open source Another project: LightHouse.
AuditsMainly rate the webpage from 5 aspects, and finally generate a report:
4.Pretty Print (display readable code)

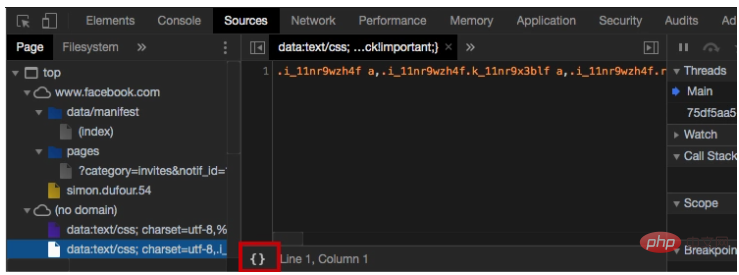
We know that many websites compress Javascript code, but this is very difficult to read for developers and learners. Google provides us with a function , you can better view compressed files.
We click the curly brackets{} icon below to use the Pretty Print function
Sources" tab. Just press cmd/ctrl p, then enter the file name you want to find, then press Enter and it will be ok.
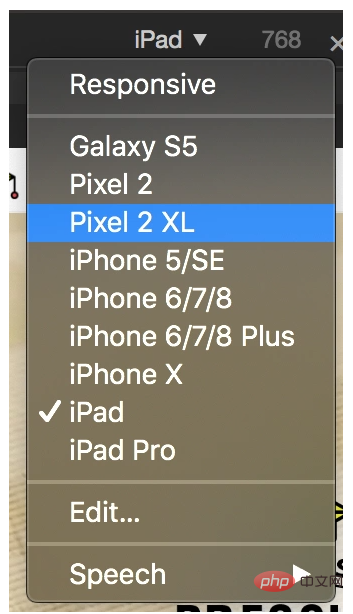
Chrome The mobile simulator feature has been added to the developer toolkit to help us test:

- capture node screenshot"【 Node web page】
- “capture screenshot”【Current screen】
- 8. Extensions
We can install extensions to the Chrome developer console. Many frameworks have their own extensions to simplify development for their technologies (Vue, Angular, React, etc.). This is a list of Featured DevTools extensions.
9. Coverage
Coverage is a new feature of chrome developer tools. From the literal meaning, it can be used to detect which js and css are already present when the code is running on the website. It is running, and which js and css have not been used yet. As shown in the picture, this is the running and not yet running code displayed when I open the csdn web page.
 How to open caver Prerequisite: The version of chrome browser must be 59 or above. Quickly open devtools in ctrl shift i, click on the upper right corner... More tools There is Coverage.
So what does this new feature do?
As shown in the picture above, the rightmost shows the number of css and js files we loaded. The red area indicates the code that has been run, while the cyan indicates the code that has been loaded but not run. It can be used to discover js and css codes that have not been used in the page. You can provide users with only the necessary code, thus improving the performance of the page. This is useful for identifying scripts that can be split and for lazily loading non-critical scripts.
10. Follow up on new features in real time
Chrome's development tools will be constantly updated, and it will release updated videos on What's New In DevTools. We can go and see it from time to time to learn more about it. New features, so that we can know some of Google’s useful features in real time.
It is impossible to know the possible bugs in real time after the code is deployed. In order to solve these bugs afterwards, a lot of time was spent on log debugging. Here I would like to recommend a useful bug to everyone. Monitoring tool Fundebug (https://www.fundebug.com/?utm_source=xiaozhi).


