
 Web Front-end
JS Tutorial
JS method to realize dragging left and right to change the size of the content display area_javascript skills
Web Front-end
JS Tutorial
JS method to realize dragging left and right to change the size of the content display area_javascript skills
JS method to realize dragging left and right to change the size of the content display area_javascript skills

The example in this article describes the method of using JS to drag left and right to change the size of the content display area. Share it with everyone for your reference. The details are as follows:
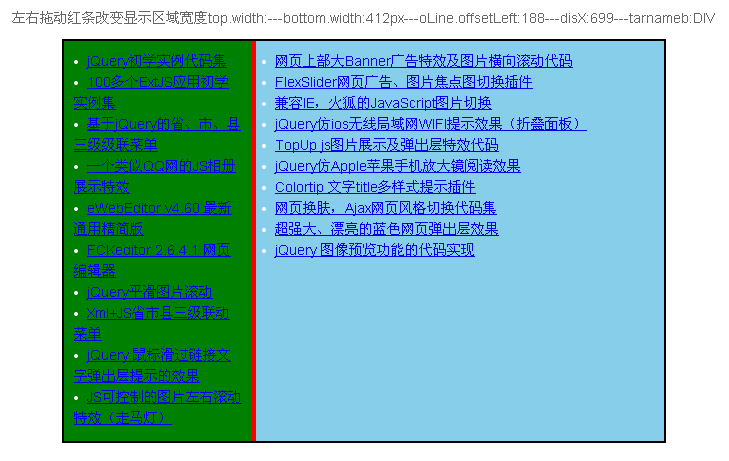
Here is a demonstration of the effect of the left and right draggable content display area. Drag the red bar left and right to change the width of the display area. Drag to the left to display all the content on the right, and drag to the right to display all the content on the left. Similar to QQ chat Like windows, the size can be dragged up or down to suit the user's requirements. This code is completely implemented by combining JavaScript and CSS code. It has good compatibility when running in all mainstream browsers. Dragging the JS code left and right to change the size is recommended to everyone.
The screenshot of the running effect is as follows:
The online demo address is as follows:
http://demo.jb51.net/js/2015/js-drug-cha-area-show-demo/
The specific code is as follows:
<!DOCTYPE html>
<html>
<head>
<meta http-equiv="Content-Type" content="text/html; charset=utf-8" />
<title>左右可拖动的内容显示区</title>
<style>
ul,li{margin:0;padding:0;}
body{font:14px/1.5 Arial;color:#666;}
#box{position:relative;width:600px;height:400px;border:2px solid #000;margin:10px auto;overflow:hidden;}
#box ul{list-style-position:inside;margin:10px;}
#top,#bottom{color:#FFF;width:300px;height:400px;overflow:hidden;}
#top{background:green; float:left}
#bottom{background:skyblue;float:right}
#line{position:absolute;top:0;left:50%;height:100%;width:4px;overflow:hidden;background:red;cursor:w-resize;}
</style>
<script>
function $(id) {
 return document.getElementById(id)
}
window.onload = function() {
 var oBox = $("box"), oTop = $("top"), oBottom = $("bottom"), oLine = $("line");
 oLine.onmousedown = function(e) {
 var disX = (e || event).clientX;
 oLine.left = oLine.offsetLeft;
 document.onmousemove = function(e) {
  var iT = oLine.left + ((e || event).clientX - disX);
 var e=e||window.event,tarnameb=e.target||e.srcElement;
  var maxT = oBox.clientWight - oLine.offsetWidth;
  oLine.style.margin = 0;
  iT < 0 && (iT = 0);
  iT > maxT && (iT = maxT);
  oLine.style.left = oTop.style.width = iT + "px";
  oBottom.style.width = oBox.clientWidth - iT + "px";
 $("msg").innerText='top.width:'+oLine.style.width+'---bottom.width:'+oBottom.style.width+'---oLine.offsetLeft:'+oLine.offsetLeft+'---disX:'+disX+'---tarnameb:'+tarnameb.tagName;
  return false
 };
 document.onmouseup = function() {
  document.onmousemove = null;
  document.onmouseup = null;
  oLine.releaseCapture && oLine.releaseCapture()
 };
 oLine.setCapture && oLine.setCapture();
 return false
 };
};
</script>
</head>
<body>
<center>左右拖动红条改变显示区域宽度<span id="msg"></span></center>
<div id="box">
 <div id="top">
 <ul>
 <li><a href="#" target="_blank">jQuery初学实例代码集</a></li><li><a href="#" target="_blank">100多个ExtJS应用初学实例集</a></li>
  <li><a href="#" target="_blank">基于jQuery的省、市、县三级级联菜单</a></li>
  <li><a href="#" target="_blank">一个类似QQ网的JS相册展示特效</a></li>
  <li><a href="#" target="_blank">eWebEditor v4.60 最新通用精简版</a></li>
  <li><a href="#" target="_blank">FCKeditor 2.6.4.1 网页编辑器</a></li>
  <li><a href="#" target="_blank">jQuery平滑图片滚动</a></li>
  <li><a href="#" target="_blank">Xml+JS省市县三级联动菜单</a></li>
  <li><a href="#" target="_blank">jQuery 鼠标滑过链接文字弹出层提示的效果</a></li>
  <li><a href="#" target="_blank">JS可控制的图片左右滚动特效(走马灯)</a></li>
 </ul>
 </div>
 <div id="bottom">
 <ul>
 <li><a href="#" target="_blank">网页上部大Banner广告特效及图片横向滚动代码</a></li>
  <li><a href="#" target="_blank">FlexSlider网页广告、图片焦点图切换插件</a></li>
  <li><a href="#" target="_blank">兼容IE,火狐的JavaScript图片切换</a></li>
  <li><a href="#" target="_blank">jQuery仿ios无线局域网WIFI提示效果(折叠面板)</a></li>
  <li><a href="#" target="_blank">TopUp js图片展示及弹出层特效代码</a></li>
  <li><a href="#" target="_blank">jQuery仿Apple苹果手机放大镜阅读效果</a></li>
  <li><a href="#" target="_blank">Colortip 文字title多样式提示插件</a></li>
  <li><a href="#" target="_blank">网页换肤,Ajax网页风格切换代码集</a></li>
  <li><a href="#" target="_blank">超强大、漂亮的蓝色网页弹出层效果</a></li>
  <li><a href="#" target="_blank">jQuery 图像预览功能的代码实现</a></li>
 </ul>
 </div>
 <div id="line"></div>
</div>
</body>
</html>
I hope this article will be helpful to everyone’s JavaScript programming.

Hot AI Tools

Undresser.AI Undress
AI-powered app for creating realistic nude photos

AI Clothes Remover
Online AI tool for removing clothes from photos.

Undress AI Tool
Undress images for free

Clothoff.io
AI clothes remover

Video Face Swap
Swap faces in any video effortlessly with our completely free AI face swap tool!

Hot Article
Hot Tools

Notepad++7.3.1
Easy-to-use and free code editor

SublimeText3 Chinese version
Chinese version, very easy to use

Zend Studio 13.0.1
Powerful PHP integrated development environment

Dreamweaver CS6
Visual web development tools

SublimeText3 Mac version
God-level code editing software (SublimeText3)
Hot Topics
 1386
1386
 52
52

 How to use JS and Baidu Maps to implement map pan function
Nov 21, 2023 am 10:00 AM
How to use JS and Baidu Maps to implement map pan function
Nov 21, 2023 am 10:00 AM
How to use JS and Baidu Map to implement map pan function Baidu Map is a widely used map service platform, which is often used in web development to display geographical information, positioning and other functions. This article will introduce how to use JS and Baidu Map API to implement the map pan function, and provide specific code examples. 1. Preparation Before using Baidu Map API, you first need to apply for a developer account on Baidu Map Open Platform (http://lbsyun.baidu.com/) and create an application. Creation completed
 Recommended: Excellent JS open source face detection and recognition project
Apr 03, 2024 am 11:55 AM
Recommended: Excellent JS open source face detection and recognition project
Apr 03, 2024 am 11:55 AM
Face detection and recognition technology is already a relatively mature and widely used technology. Currently, the most widely used Internet application language is JS. Implementing face detection and recognition on the Web front-end has advantages and disadvantages compared to back-end face recognition. Advantages include reducing network interaction and real-time recognition, which greatly shortens user waiting time and improves user experience; disadvantages include: being limited by model size, the accuracy is also limited. How to use js to implement face detection on the web? In order to implement face recognition on the Web, you need to be familiar with related programming languages and technologies, such as JavaScript, HTML, CSS, WebRTC, etc. At the same time, you also need to master relevant computer vision and artificial intelligence technologies. It is worth noting that due to the design of the Web side
 How to change the starting delivery price of Meituan Takeout merchant version
Mar 27, 2024 pm 07:20 PM
How to change the starting delivery price of Meituan Takeout merchant version
Mar 27, 2024 pm 07:20 PM
In the operation process of the Meituan Takeout Merchant Edition, the setting of the starting delivery price is a crucial link. A reasonable starting delivery price can not only help merchants control costs, but also increase order amounts to a certain extent, thus increasing overall revenue. However, many merchants don’t know much about how to modify the minimum delivery price. So in the following article, the editor of this website will bring you detailed starting price setting guide for merchants. If you want to know more, come to the following article to find out! In the Meituan Takeout Merchant Center, log in and enter the store settings, then select store management. In the switch navigation at the top of the store management page, select delivery information, and then click Add Delivery Area to complete the operation. Once you add a location, the corresponding shipping costs will automatically appear. After completing your order, you will receive
 Essential tools for stock analysis: Learn the steps to draw candle charts with PHP and JS
Dec 17, 2023 pm 06:55 PM
Essential tools for stock analysis: Learn the steps to draw candle charts with PHP and JS
Dec 17, 2023 pm 06:55 PM
Essential tools for stock analysis: Learn the steps to draw candle charts in PHP and JS. Specific code examples are required. With the rapid development of the Internet and technology, stock trading has become one of the important ways for many investors. Stock analysis is an important part of investor decision-making, and candle charts are widely used in technical analysis. Learning how to draw candle charts using PHP and JS will provide investors with more intuitive information to help them make better decisions. A candlestick chart is a technical chart that displays stock prices in the form of candlesticks. It shows the stock price
 How to create a stock candlestick chart using PHP and JS
Dec 17, 2023 am 08:08 AM
How to create a stock candlestick chart using PHP and JS
Dec 17, 2023 am 08:08 AM
How to use PHP and JS to create a stock candle chart. A stock candle chart is a common technical analysis graphic in the stock market. It helps investors understand stocks more intuitively by drawing data such as the opening price, closing price, highest price and lowest price of the stock. price fluctuations. This article will teach you how to create stock candle charts using PHP and JS, with specific code examples. 1. Preparation Before starting, we need to prepare the following environment: 1. A server running PHP 2. A browser that supports HTML5 and Canvas 3
 How to use JS and Baidu Maps to implement map heat map function
Nov 21, 2023 am 09:33 AM
How to use JS and Baidu Maps to implement map heat map function
Nov 21, 2023 am 09:33 AM
How to use JS and Baidu Maps to implement the map heat map function Introduction: With the rapid development of the Internet and mobile devices, maps have become a common application scenario. As a visual display method, heat maps can help us understand the distribution of data more intuitively. This article will introduce how to use JS and Baidu Map API to implement the map heat map function, and provide specific code examples. Preparation work: Before starting, you need to prepare the following items: a Baidu developer account, create an application, and obtain the corresponding AP
 How to use JS and Baidu Map to implement map click event processing function
Nov 21, 2023 am 11:11 AM
How to use JS and Baidu Map to implement map click event processing function
Nov 21, 2023 am 11:11 AM
Overview of how to use JS and Baidu Maps to implement map click event processing: In web development, it is often necessary to use map functions to display geographical location and geographical information. Click event processing on the map is a commonly used and important part of the map function. This article will introduce how to use JS and Baidu Map API to implement the click event processing function of the map, and give specific code examples. Steps: Import the API file of Baidu Map. First, import the file of Baidu Map API in the HTML file. This can be achieved through the following code:
 PHP and JS Development Tips: Master the Method of Drawing Stock Candle Charts
Dec 18, 2023 pm 03:39 PM
PHP and JS Development Tips: Master the Method of Drawing Stock Candle Charts
Dec 18, 2023 pm 03:39 PM
With the rapid development of Internet finance, stock investment has become the choice of more and more people. In stock trading, candle charts are a commonly used technical analysis method. It can show the changing trend of stock prices and help investors make more accurate decisions. This article will introduce the development skills of PHP and JS, lead readers to understand how to draw stock candle charts, and provide specific code examples. 1. Understanding Stock Candle Charts Before introducing how to draw stock candle charts, we first need to understand what a candle chart is. Candlestick charts were developed by the Japanese
