

Introducing JS to implement backgammon interface design

Free learning recommendation: js video tutorial
Requirements analysis and code implementation
Section 1 Canvas style layout
1. Canvas design
New CSS file folder, create a new style.css file;
Writing canvas in the style.css file;
##canvas{ display: block ; margin: 50px auto; box-shadow: -2px -2px 2px #EFEFEF,5px 5px 5px #B9B9B9; }
- Parameter explanation
margin 50px auto// means the canvas is centered;
box-shadow: -2px -2px 2px #EFEFEF,5px 5px 5px #B9B9B9//offset-x: (such as -2px here) is required, and the value can be positive or negative. offset-x position of horizontal shadow.
offset-y: (such as -2px here) is required, and the value can be positive or negative. offset-y position of the vertical shadow.
blur: (such as 2px here) is optional and can only take positive values. blur-radius Shadow blur radius, 0 means no blur effect, the larger the value, the blurr the shadow edge.
color: Optional, the color of the shadow. If not set, the browser will use the default color, usually black, but the default color varies among browsers, so it is recommended not to omit it.
**
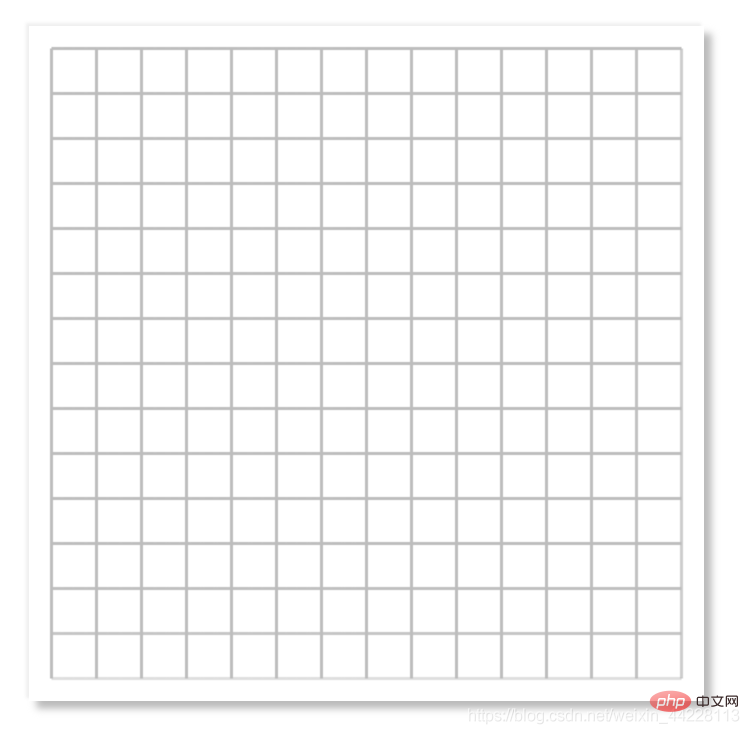
2. Rendering

1. Size design
is divided into 14*14 rectangular frames with a total length of 450px and a width of 450px, with a total of 15px left on both sides. Each small rectangle Box 30px times 30px
2. js code writing (drawing)var chess = document.getElementById('chess');var context = chess.getContext('2d');//画一个二维画布context.strokeStyle = "#BFBFBF";var drawChessBoard = function (){
for (var i=0; i
1. Code writing
//初始化位置数组var chessBoard = [];for(var i = 0;i<pre class="brush:php;toolbar:false">//画棋子var onstep = function (i, j, flag){//i,j代表棋子的索引位置,flag标记黑棋白棋
    context.beginPath();
    context.arc(15+i*30, 15+j*30, 13,0,2*Math.PI);
    context.closePath();
    var gradient = context.createRadialGradient(15+i*30+2,15+j*30-2,13,15+i*30+2,15+j*30-2,0);
    if(flag){//如果flag为真则黑棋
        gradient.addColorStop(0, "#0A0A0A");
        gradient.addColorStop(1,"#636766")
    }else {//白棋
        gradient.addColorStop(0, "#D1D1D1");
        gradient.addColorStop(1,"#F9F9F9");
    }
    context.fillStyle=gradient;
context.fill();}//点击时触发,获得所点击的位置,然后判断该位置有没有棋子,若没有也就是if判断,调用onstep函数画黑棋(or白棋)chess.onclick = function (e){
var x = e.offsetX;
var y = e.offsetY;
var i = Math.floor(x/30);
var j = Math.floor(y/30);
if(chessBoard[i][j]==0){
onstep(i,j,flag);
chessBoard[i][j] = 1;
flag = !flag;
}}
(If you click randomly on the chessboard, black chess and white chess will appear in turn)

1. Code writing
var pic = new Image();pic.src = "images/background.jpg";pic.onload = function (){
    context.drawImage(pic, 0, 0, 450, 450);
    drawChessBoard();}//注:棋盘设计中js编写最后一句可以删除了,因为在这里调用了drawChessBoard();
Here is the code in index.html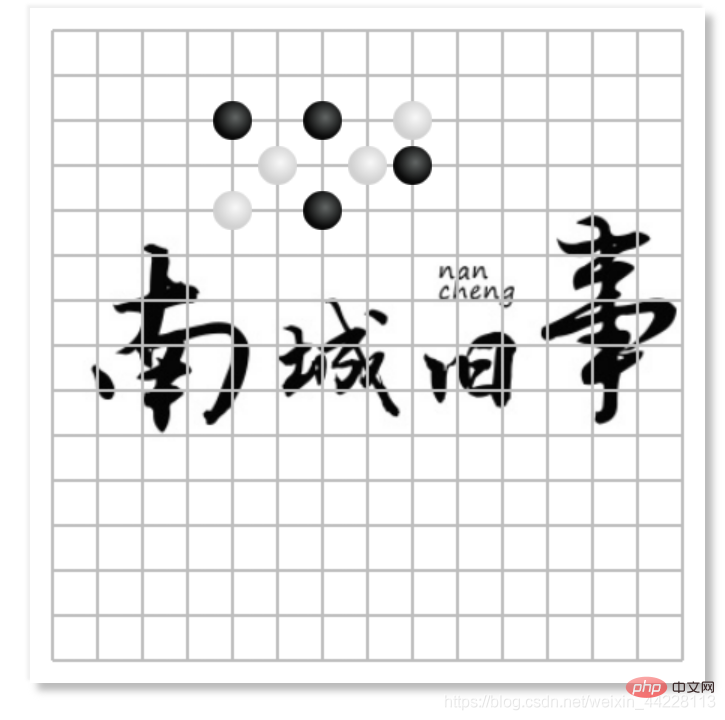
nbsp;html>
    <meta>
    <title>五子棋</title>
    <link><canvas></canvas><script></script>
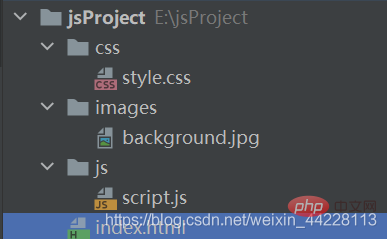
Project Structure
 Such a simple backgammon UI interface has been designed, hurry up and give it a try!
Related free learning recommendations:javascript(Video)
The above is the detailed content of Introducing JS to implement backgammon interface design. For more information, please follow other related articles on the PHP Chinese website!

Hot AI Tools

Undresser.AI Undress
AI-powered app for creating realistic nude photos

AI Clothes Remover
Online AI tool for removing clothes from photos.

Undress AI Tool
Undress images for free

Clothoff.io
AI clothes remover

AI Hentai Generator
Generate AI Hentai for free.

Hot Article
Hot Tools

Notepad++7.3.1
Easy-to-use and free code editor

SublimeText3 Chinese version
Chinese version, very easy to use

Zend Studio 13.0.1
Powerful PHP integrated development environment

Dreamweaver CS6
Visual web development tools

SublimeText3 Mac version
God-level code editing software (SublimeText3)
Hot Topics
 1378
1378
 52
52

 How to use JS and Baidu Maps to implement map pan function
Nov 21, 2023 am 10:00 AM
How to use JS and Baidu Maps to implement map pan function
Nov 21, 2023 am 10:00 AM
How to use JS and Baidu Map to implement map pan function Baidu Map is a widely used map service platform, which is often used in web development to display geographical information, positioning and other functions. This article will introduce how to use JS and Baidu Map API to implement the map pan function, and provide specific code examples. 1. Preparation Before using Baidu Map API, you first need to apply for a developer account on Baidu Map Open Platform (http://lbsyun.baidu.com/) and create an application. Creation completed
 Recommended: Excellent JS open source face detection and recognition project
Apr 03, 2024 am 11:55 AM
Recommended: Excellent JS open source face detection and recognition project
Apr 03, 2024 am 11:55 AM
Face detection and recognition technology is already a relatively mature and widely used technology. Currently, the most widely used Internet application language is JS. Implementing face detection and recognition on the Web front-end has advantages and disadvantages compared to back-end face recognition. Advantages include reducing network interaction and real-time recognition, which greatly shortens user waiting time and improves user experience; disadvantages include: being limited by model size, the accuracy is also limited. How to use js to implement face detection on the web? In order to implement face recognition on the Web, you need to be familiar with related programming languages and technologies, such as JavaScript, HTML, CSS, WebRTC, etc. At the same time, you also need to master relevant computer vision and artificial intelligence technologies. It is worth noting that due to the design of the Web side
 Essential tools for stock analysis: Learn the steps to draw candle charts with PHP and JS
Dec 17, 2023 pm 06:55 PM
Essential tools for stock analysis: Learn the steps to draw candle charts with PHP and JS
Dec 17, 2023 pm 06:55 PM
Essential tools for stock analysis: Learn the steps to draw candle charts in PHP and JS. Specific code examples are required. With the rapid development of the Internet and technology, stock trading has become one of the important ways for many investors. Stock analysis is an important part of investor decision-making, and candle charts are widely used in technical analysis. Learning how to draw candle charts using PHP and JS will provide investors with more intuitive information to help them make better decisions. A candlestick chart is a technical chart that displays stock prices in the form of candlesticks. It shows the stock price
 How to create a stock candlestick chart using PHP and JS
Dec 17, 2023 am 08:08 AM
How to create a stock candlestick chart using PHP and JS
Dec 17, 2023 am 08:08 AM
How to use PHP and JS to create a stock candle chart. A stock candle chart is a common technical analysis graphic in the stock market. It helps investors understand stocks more intuitively by drawing data such as the opening price, closing price, highest price and lowest price of the stock. price fluctuations. This article will teach you how to create stock candle charts using PHP and JS, with specific code examples. 1. Preparation Before starting, we need to prepare the following environment: 1. A server running PHP 2. A browser that supports HTML5 and Canvas 3
 How to use JS and Baidu Map to implement map click event processing function
Nov 21, 2023 am 11:11 AM
How to use JS and Baidu Map to implement map click event processing function
Nov 21, 2023 am 11:11 AM
Overview of how to use JS and Baidu Maps to implement map click event processing: In web development, it is often necessary to use map functions to display geographical location and geographical information. Click event processing on the map is a commonly used and important part of the map function. This article will introduce how to use JS and Baidu Map API to implement the click event processing function of the map, and give specific code examples. Steps: Import the API file of Baidu Map. First, import the file of Baidu Map API in the HTML file. This can be achieved through the following code:
 How to use JS and Baidu Maps to implement map heat map function
Nov 21, 2023 am 09:33 AM
How to use JS and Baidu Maps to implement map heat map function
Nov 21, 2023 am 09:33 AM
How to use JS and Baidu Maps to implement the map heat map function Introduction: With the rapid development of the Internet and mobile devices, maps have become a common application scenario. As a visual display method, heat maps can help us understand the distribution of data more intuitively. This article will introduce how to use JS and Baidu Map API to implement the map heat map function, and provide specific code examples. Preparation work: Before starting, you need to prepare the following items: a Baidu developer account, create an application, and obtain the corresponding AP
 PHP and JS Development Tips: Master the Method of Drawing Stock Candle Charts
Dec 18, 2023 pm 03:39 PM
PHP and JS Development Tips: Master the Method of Drawing Stock Candle Charts
Dec 18, 2023 pm 03:39 PM
With the rapid development of Internet finance, stock investment has become the choice of more and more people. In stock trading, candle charts are a commonly used technical analysis method. It can show the changing trend of stock prices and help investors make more accurate decisions. This article will introduce the development skills of PHP and JS, lead readers to understand how to draw stock candle charts, and provide specific code examples. 1. Understanding Stock Candle Charts Before introducing how to draw stock candle charts, we first need to understand what a candle chart is. Candlestick charts were developed by the Japanese
 How to use JS and Baidu Maps to implement map polygon drawing function
Nov 21, 2023 am 10:53 AM
How to use JS and Baidu Maps to implement map polygon drawing function
Nov 21, 2023 am 10:53 AM
How to use JS and Baidu Maps to implement map polygon drawing function. In modern web development, map applications have become one of the common functions. Drawing polygons on the map can help us mark specific areas for users to view and analyze. This article will introduce how to use JS and Baidu Map API to implement map polygon drawing function, and provide specific code examples. First, we need to introduce Baidu Map API. You can use the following code to import the JavaScript of Baidu Map API in an HTML file
