Usually enabledxdebug Plug-in, performance test output file will be generated, usually in the cachegrind.out.xxxx file.
This file can be used for code performance analysis through third-party tools.
But if there are multiple projects/websites locally, all profiles will be output to one file, which is not convenient for subsequent performance analysis.
Custom profile file name
You can set the output file name by configuring the xdebug.profiler_output_name parameter. Some parameters are as follows:
| Symbol | Meaning | Configuration sample | Sample file name |
|---|---|---|---|
| %c | Crc32 check value of the current working directory | cachegrind.out.%c | cachegrind.out.1258863198 |
| % p | Pid of the current server process | cachegrind.out.%p | cachegrind.out.9685 |
| %r | Random number | cachegrind.out.%r | cachegrind.out.072db0 |
| %s | Script file name (note) | cachegrind.out.%s | cachegrind.out._home_httpd_html_test_xdebug_test_php |
| %t | Unix Timestamp (seconds) | cachegrind.out.%t | cachegrind.out.1179434742 |
| %u | Unix time Stamp (microseconds) | cachegrind.out.%u | cachegrind.out.1179434749_642382 |
| %H | $_SERVER ['HTTP_HOST'] | cachegrind.out.%H | cachegrind.out.localhost |
| #$_SERVER ['REQUEST_URI'] | cachegrind.out.%R | cachegrind.out._test_xdebug_test_php_var=1_var2 | |
| session_id (from $_COOKIE if set) | cachegrind.out.%S | cachegrind.out.c70c1ec2375af58f74b390bbdd2a679d | |
| %characters | cachegrind.out.%% | cachegrind.out.%% |
Configuration file: <div class="code" style="position:relative; padding:0px; margin:0px;"><pre class="brush:php;toolbar:false">xdebug.profiler_output_name = cachegrind.out.%H</pre><div class="contentsignin">Copy after login</div></div> Then restart the php server.
Under Mac, the profile file is stored in the
/var/tmp/ directory. Performance Analysis
Under Mac, MacCallGrind and qcachegrind can be used, but the former is charged and can be downloaded directly through the Apple Store, while the latter is free. Requires manual installation.
Install graphviz for Call Graph function:
$ brew install graphviz
Install qcachegrind:
$ brew install qcachegrind
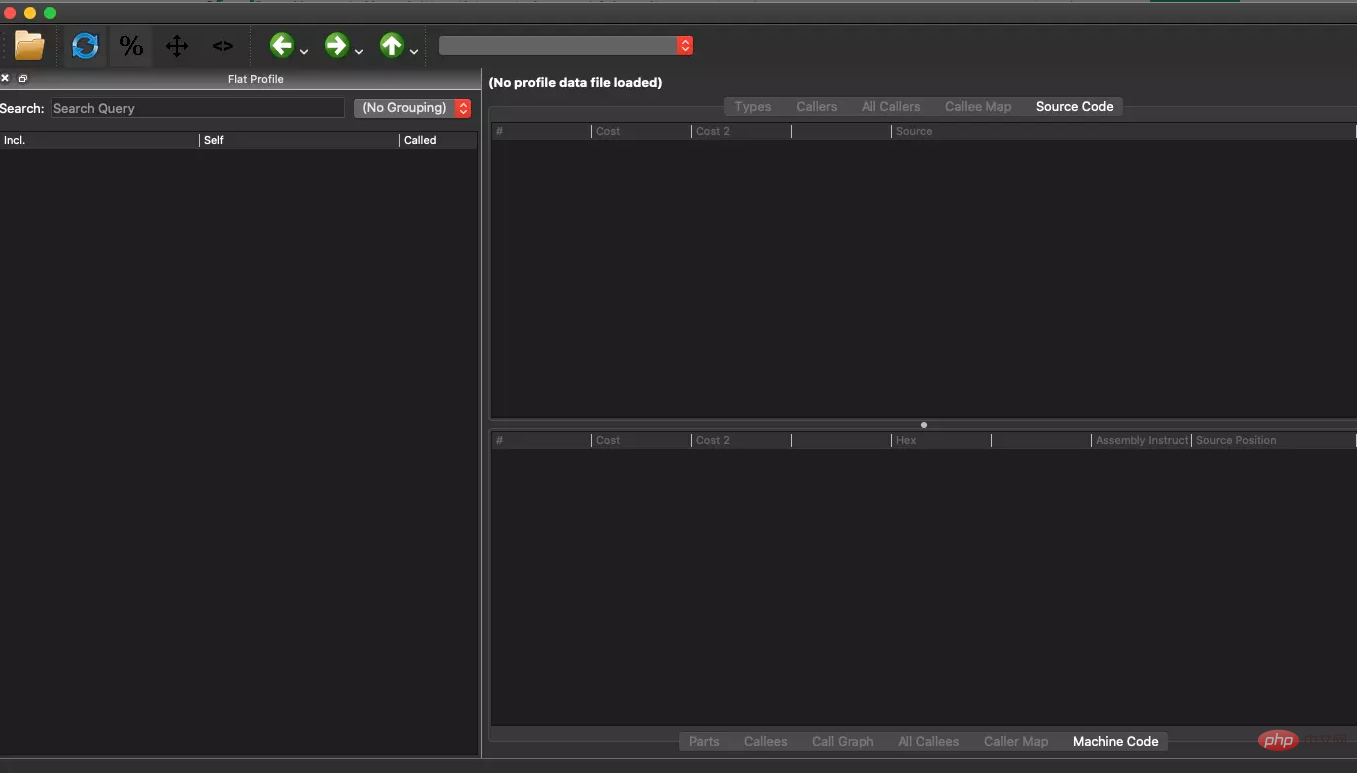
After the installation is completed, you can open the
qcachegrind application, graph The interface is as follows:
 Others
However, it should be noted that after turning on the
profile file output, if there are many local projects, it is easy to It occupies a large area of disk space. The picture below shows the status that I haven’t cleaned up in about half a year:

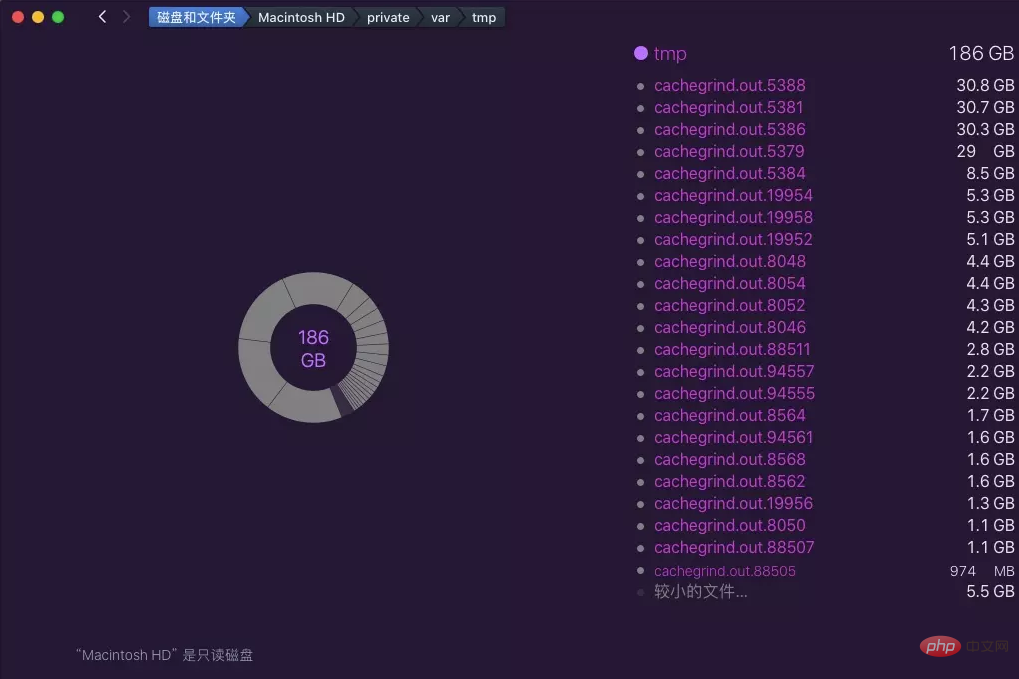 You can use the command to clean up:
$ sudo rm -fr /private/var/tmp/cachegrind.out.*


