

View Redis performance monitoring


redis_exporter prometheus grafana monitors Redis service indicators
- 1.redis_exporter
- 2.prometheus
- 3.grafana
Recommended (free): redis
This article uses redis_exporter prometheus grafana to implement The reasons for monitoring the Redis service are: low cost, less manual intervention, direct download of the corresponding components, only need to add configurations to communicate with each other, and the visual indicators are relatively comprehensive.
The following is on a Linux machine with redis installed
1.redis_exporter
Download program compressed file
wget https://github.com/oliver006/redis_exporter/releases/download/v0.28.0/redis_exporter-v0.28.0.linux-amd64.tar.gz
Unzip
tar zxf redis_exporter-v0.28.0.linux-amd64.tar.gz
cd into the directory
cd redis_exporter-v1.15.0.linux-amd64
Directly run the redis_exporter program and add & to represent running in the background. The /redis_exporter & command accesses the localhost:6379 of this machine by default. You need to specify other machines. redis uses ./redis_exporter ip:port &
./redis_exporter &
2.prometheus
The first step is to download the file as usual, and the unzipped file (v2.7.1) can be modified To find the version that needs to be installed, you can click https://github.com/prometheus/prometheus/releases to find the corresponding version number
wget https://github.com/prometheus/prometheus/releases/download/v2.7.1/prometheus-2.7.1.linux-amd64.tar.gz
tar zxf prometheus-2.7.1.linux-amd64.tar.gz
cd into the directory and you will find a prometheus.yml configuration file. This configuration file Corresponding service name, monitoring address and port of each service.
vim prometheus.yml
Open the configuration file and add the configuration of redis_exporter communication
   - job_name: 'prometheus'
     static_configs:
     - targets: ['localhost:9090'] #程序在本机开通的端口号 默认9090
  - job_name: 'redis'
    static_configs:
    - targets:
      - "IP:9121" #(安装redis_exporter的IP)
Run ps: Check if there is any process occupying port 9090
./prometheus &
http://ip:9090/targets Check if Success
3.grafana
No more nonsense
wget https://dl.grafana.com/oss/release/grafana-6.0.0-beta1.linux-amd64.tar.gz
tar zxf grafana-6.0.0-beta1.linux-amd64.tar.gz
cd grafana-6.0.0-beta1
./grafana-server start
After startup: http://ip:300 Default User: admin, password: admin Then find data sources on the left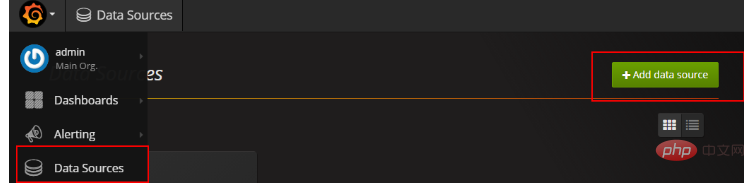
Configure the Url corresponding to your program address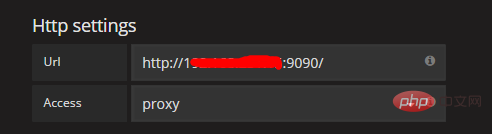
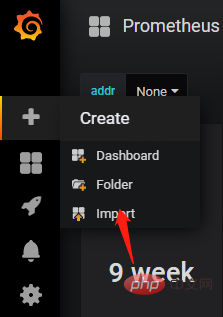
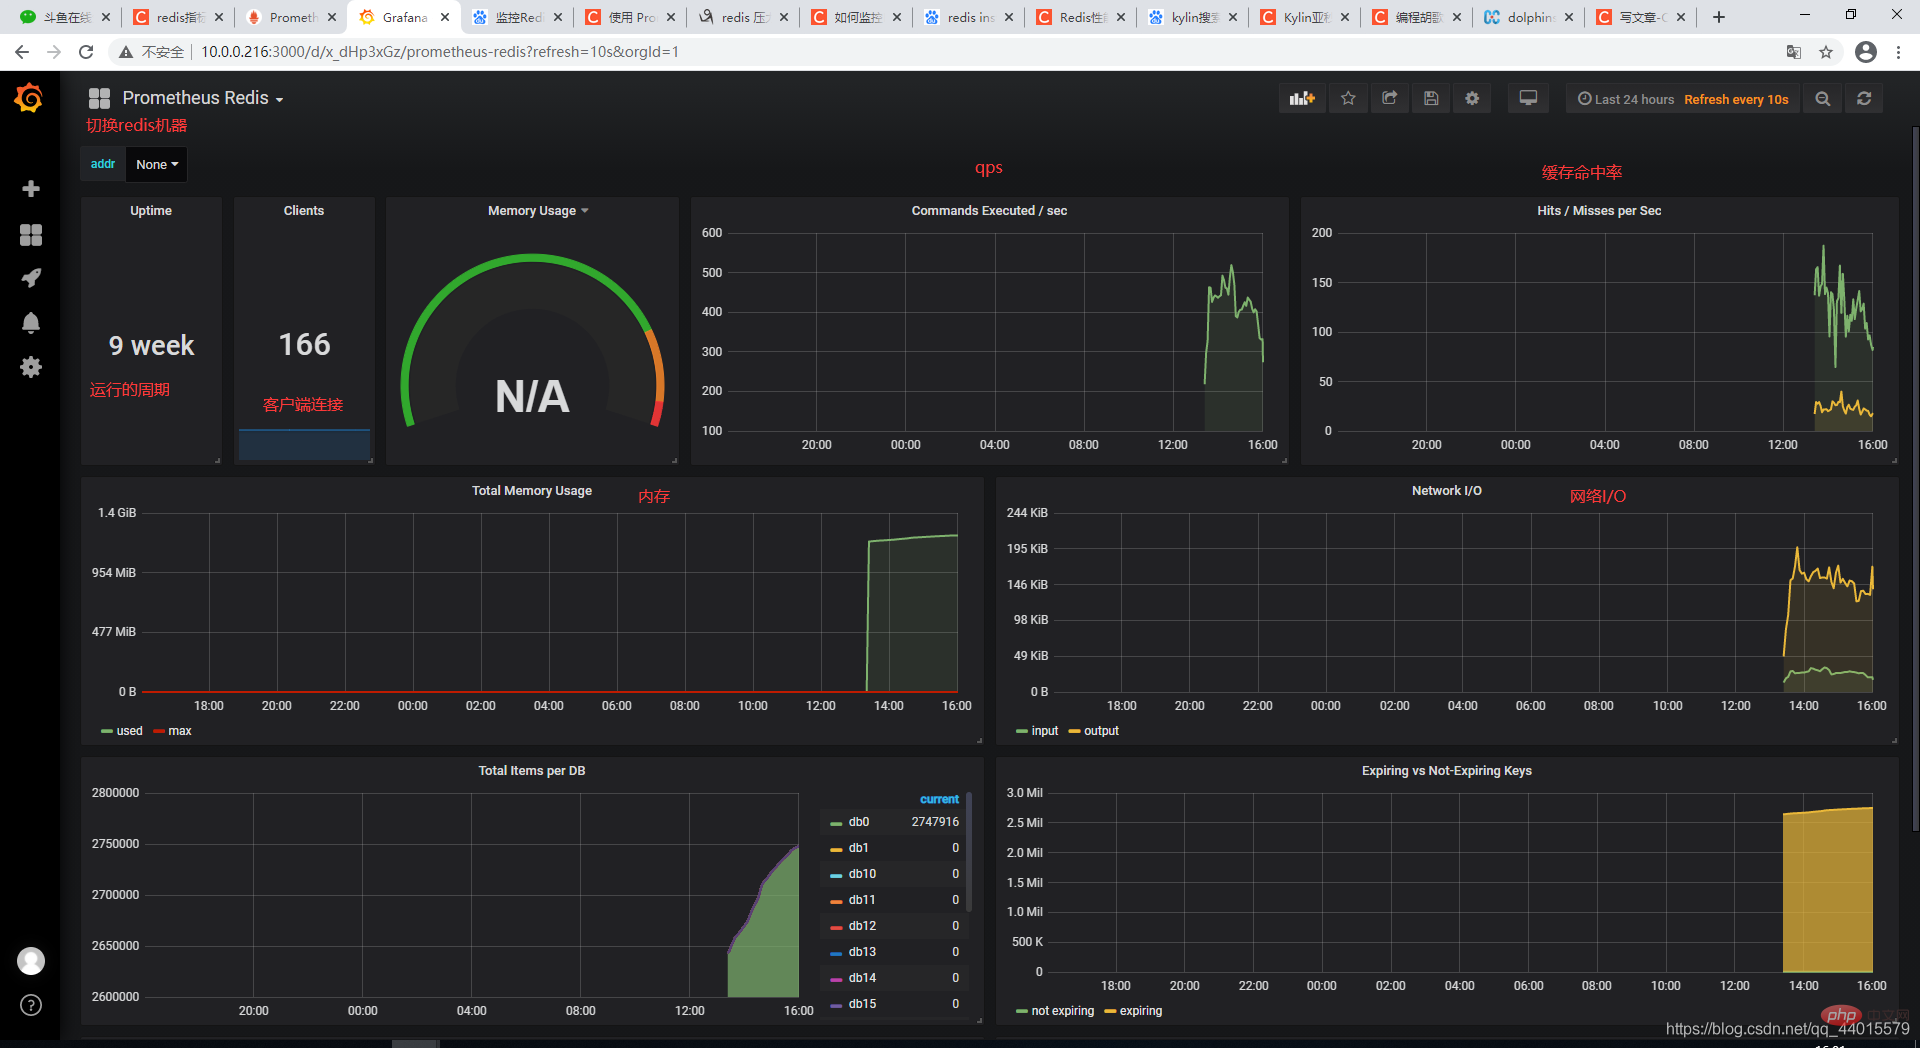
The last step! Download the json template Import
https://grafana.com/api/dashboards/763/revisions/1/download
Upload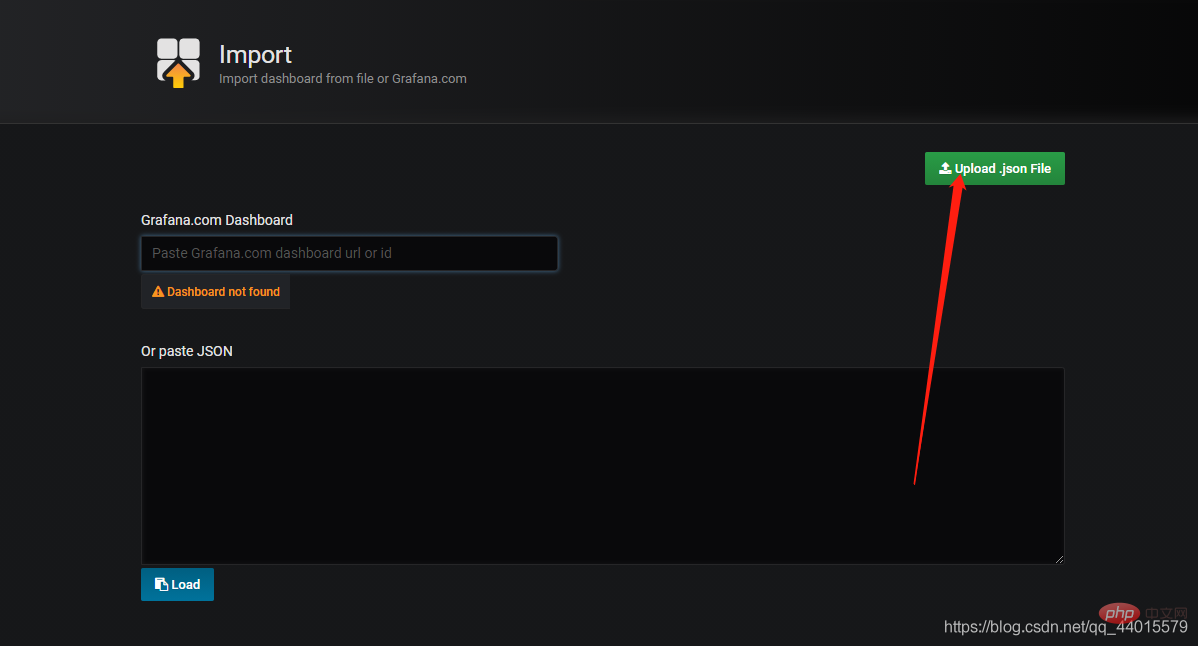
You can view it here Configure those service monitoring
Monitoring page

The above is the detailed content of View Redis performance monitoring. For more information, please follow other related articles on the PHP Chinese website!

Hot AI Tools

Undresser.AI Undress
AI-powered app for creating realistic nude photos

AI Clothes Remover
Online AI tool for removing clothes from photos.

Undress AI Tool
Undress images for free

Clothoff.io
AI clothes remover

AI Hentai Generator
Generate AI Hentai for free.

Hot Article
Hot Tools

Notepad++7.3.1
Easy-to-use and free code editor

SublimeText3 Chinese version
Chinese version, very easy to use

Zend Studio 13.0.1
Powerful PHP integrated development environment

Dreamweaver CS6
Visual web development tools

SublimeText3 Mac version
God-level code editing software (SublimeText3)
Hot Topics
 1386
1386
 52
52

 How to build the redis cluster mode
Apr 10, 2025 pm 10:15 PM
How to build the redis cluster mode
Apr 10, 2025 pm 10:15 PM
Redis cluster mode deploys Redis instances to multiple servers through sharding, improving scalability and availability. The construction steps are as follows: Create odd Redis instances with different ports; Create 3 sentinel instances, monitor Redis instances and failover; configure sentinel configuration files, add monitoring Redis instance information and failover settings; configure Redis instance configuration files, enable cluster mode and specify the cluster information file path; create nodes.conf file, containing information of each Redis instance; start the cluster, execute the create command to create a cluster and specify the number of replicas; log in to the cluster to execute the CLUSTER INFO command to verify the cluster status; make
 How to clear redis data
Apr 10, 2025 pm 10:06 PM
How to clear redis data
Apr 10, 2025 pm 10:06 PM
How to clear Redis data: Use the FLUSHALL command to clear all key values. Use the FLUSHDB command to clear the key value of the currently selected database. Use SELECT to switch databases, and then use FLUSHDB to clear multiple databases. Use the DEL command to delete a specific key. Use the redis-cli tool to clear the data.
 How to use the redis command
Apr 10, 2025 pm 08:45 PM
How to use the redis command
Apr 10, 2025 pm 08:45 PM
Using the Redis directive requires the following steps: Open the Redis client. Enter the command (verb key value). Provides the required parameters (varies from instruction to instruction). Press Enter to execute the command. Redis returns a response indicating the result of the operation (usually OK or -ERR).
 How to read redis queue
Apr 10, 2025 pm 10:12 PM
How to read redis queue
Apr 10, 2025 pm 10:12 PM
To read a queue from Redis, you need to get the queue name, read the elements using the LPOP command, and process the empty queue. The specific steps are as follows: Get the queue name: name it with the prefix of "queue:" such as "queue:my-queue". Use the LPOP command: Eject the element from the head of the queue and return its value, such as LPOP queue:my-queue. Processing empty queues: If the queue is empty, LPOP returns nil, and you can check whether the queue exists before reading the element.
 How to use single threaded redis
Apr 10, 2025 pm 07:12 PM
How to use single threaded redis
Apr 10, 2025 pm 07:12 PM
Redis uses a single threaded architecture to provide high performance, simplicity, and consistency. It utilizes I/O multiplexing, event loops, non-blocking I/O, and shared memory to improve concurrency, but with limitations of concurrency limitations, single point of failure, and unsuitable for write-intensive workloads.
 How to use redis lock
Apr 10, 2025 pm 08:39 PM
How to use redis lock
Apr 10, 2025 pm 08:39 PM
Using Redis to lock operations requires obtaining the lock through the SETNX command, and then using the EXPIRE command to set the expiration time. The specific steps are: (1) Use the SETNX command to try to set a key-value pair; (2) Use the EXPIRE command to set the expiration time for the lock; (3) Use the DEL command to delete the lock when the lock is no longer needed.
 How to implement the underlying redis
Apr 10, 2025 pm 07:21 PM
How to implement the underlying redis
Apr 10, 2025 pm 07:21 PM
Redis uses hash tables to store data and supports data structures such as strings, lists, hash tables, collections and ordered collections. Redis persists data through snapshots (RDB) and append write-only (AOF) mechanisms. Redis uses master-slave replication to improve data availability. Redis uses a single-threaded event loop to handle connections and commands to ensure data atomicity and consistency. Redis sets the expiration time for the key and uses the lazy delete mechanism to delete the expiration key.
 How to read the source code of redis
Apr 10, 2025 pm 08:27 PM
How to read the source code of redis
Apr 10, 2025 pm 08:27 PM
The best way to understand Redis source code is to go step by step: get familiar with the basics of Redis. Select a specific module or function as the starting point. Start with the entry point of the module or function and view the code line by line. View the code through the function call chain. Be familiar with the underlying data structures used by Redis. Identify the algorithm used by Redis.
