
Not long ago, the ECharts team collaborated with the WeChat Mini Program team to announce an update to support Canvas 2D in the ECharts WeChat Mini Program.
Using Canvas 2D can make the Canvas in the WeChat applet environment closer to the W3C standard Canvas interface, thus solving bugs caused by inconsistent implementation of the previous interface. Moreover, Canvas 2D’s same-layer rendering can solve the problem of overlaying levels between charts and other native components.
A brief introduction to echarts:
Commercial-grade data chart, it is a pure JavaScript icon library, compatible with most browsers, and relies on the lightweight canvas class at the bottom The library ZRender provides intuitive, vivid, interactive, and highly customizable data visualization charts. Innovative drag-and-drop recalculation, data views, value range roaming and other features greatly enhance the user experience and empower users with the ability to mine and integrate data.
Text:
Preparation: Mini program development environment, download ECharts components, gitHub address: https://github.com/ecomfe/echarts-for-weixin
Operation Process:
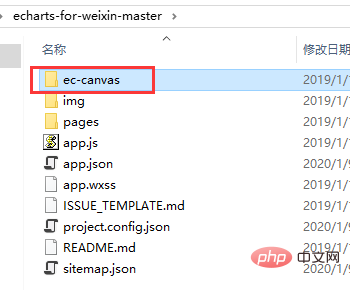
1. Copy ec-canvas to the project (it does not need to be the root directory, but when you reference it later, be careful to change the file address)

2. The corresponding page json file introduces the component
{
"usingComponents": {
    "ec-canvas": "../../ec-canvas/ec-canvas"
  }
}(free video tutorial: php video tutorial)
3. The corresponding page js file
import * as echarts from '../../ec-canvas/echarts';
function initChart(canvas, width, height) {
  const chart = echarts.init(canvas, null, {
    width: width,
    height: height
  });
  canvas.setChart(chart);
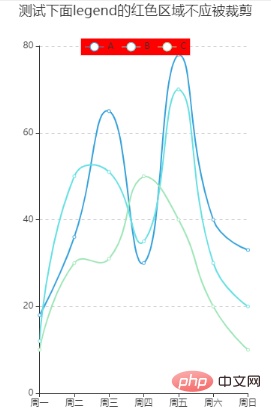
  var option = {
    title: {
      text: '测试下面legend的红色区域不应被裁剪',
      left: 'center'
    },
    color: ["#37A2DA", "#67E0E3", "#9FE6B8"],
    legend: {
      data: ['A', 'B', 'C'],
      top: 50,
      left: 'center',
      backgroundColor: 'red',
      z: 100
    },
    grid: {
      containLabel: true
    },
    tooltip: {
      show: true,
      trigger: 'axis'
    },
    xAxis: {
      type: 'category',
      boundaryGap: false,
      data: ['周一', '周二', '周三', '周四', '周五', '周六', '周日'],
      // show: false
    },
    yAxis: {
      x: 'center',
      type: 'value',
      splitLine: {
        lineStyle: {
          type: 'dashed'
        }
      }
      // show: false
    },
    series: [{
      name: 'A',
      type: 'line',
      smooth: true,
      data: [18, 36, 65, 30, 78, 40, 33]
    }, {
      name: 'B',
      type: 'line',
      smooth: true,
      data: [12, 50, 51, 35, 70, 30, 20]
    }, {
      name: 'C',
      type: 'line',
      smooth: true,
      data: [10, 30, 31, 50, 40, 20, 10]
}]
  };
  chart.setOption(option);
  return chart;
}
Page({
  data: {
    ec: {
      onInit: initChart
    }
  },
  onReady() {
  }
});4 , wxml file
<!--index.wxml-->
<view class="container">
  <ec-canvas id="mychart-dom-line" canvas-id="mychart-line" ec="{{ ec }}">
  </ec-canvas>
</view>5, page style
/**app.wxss**/
.container {
  position: absolute;
  top: 0;
  bottom: 0;
  left: 0;
  right: 0;
  display: flex;
  flex-direction: column;
  align-items: center;
  justify-content: space-between;
  box-sizing: border-box;
}6, rendering

The above is the detailed content of How to introduce echart chart in WeChat mini program. For more information, please follow other related articles on the PHP Chinese website!