

The following tutorial column will introduce you to phpstorm settings and debugging. I hope it will be helpful to friends who need it! First download the xdebug.dll file. Copy the text information of your phpinfo below to https://xdebug.org/wizard.php and download the version of xdebug.dll it provides
After the download is complete Copy php_xdebug-2.6.0-7.2-vc15-x86_64.dll (the version I downloaded) to the ext folder of the php installation directory (D:\phpTools\php7\ext);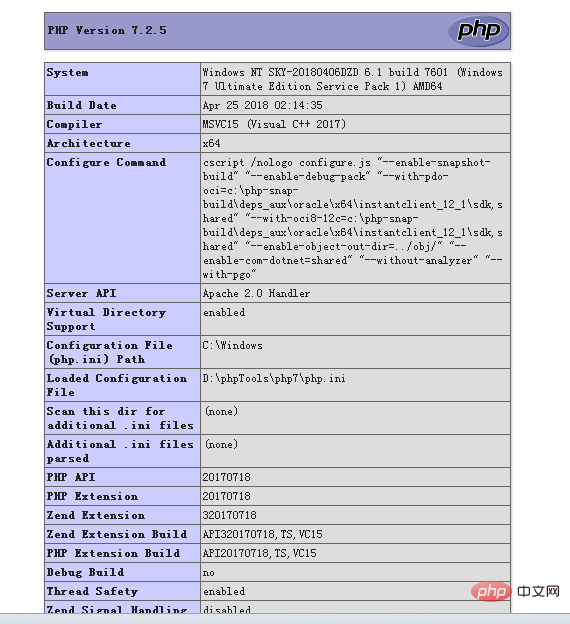 Configure php. ini file, add the following information at the end of the php.ini file:
;; phpstorm的debug调试设置
[XDebug]

zend_extension = "D:\phpTools\php7\ext\php_xdebug-2.6.0-7.2-vc15-x86_64.dll" ;xdebug.dll的路径

xdebug.profiler_append = 0

xdebug.profiler_enable = 1

xdebug.profiler_enable_trigger = 0

xdebug.profiler_output_dir = "\phpTools\php7\tmp"

xdebug.profiler_output_name = "cachegrind.out.%t-%s"

xdebug.remote_enable = 1

xdebug.remote_handler = "dbgp"

xdebug.remote_mode = "req"

xdebug.remote_port = 9000
After saving, restart Apache, visit the phpinfo page, and get the following information to indicate that xdebug has been installed.
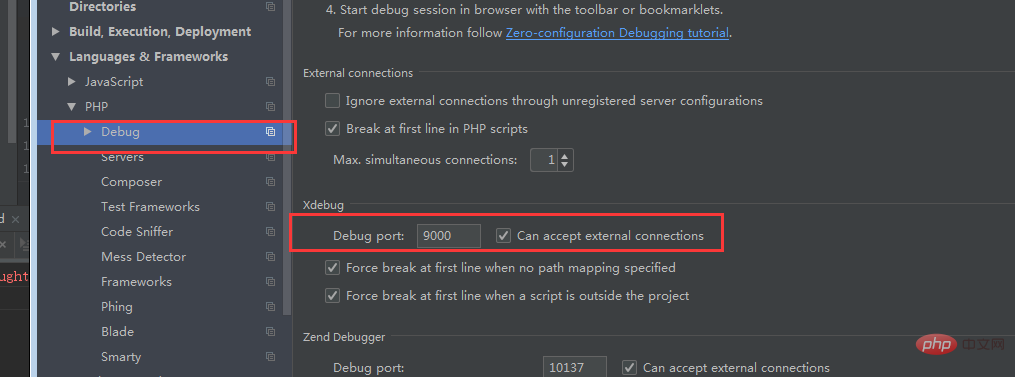
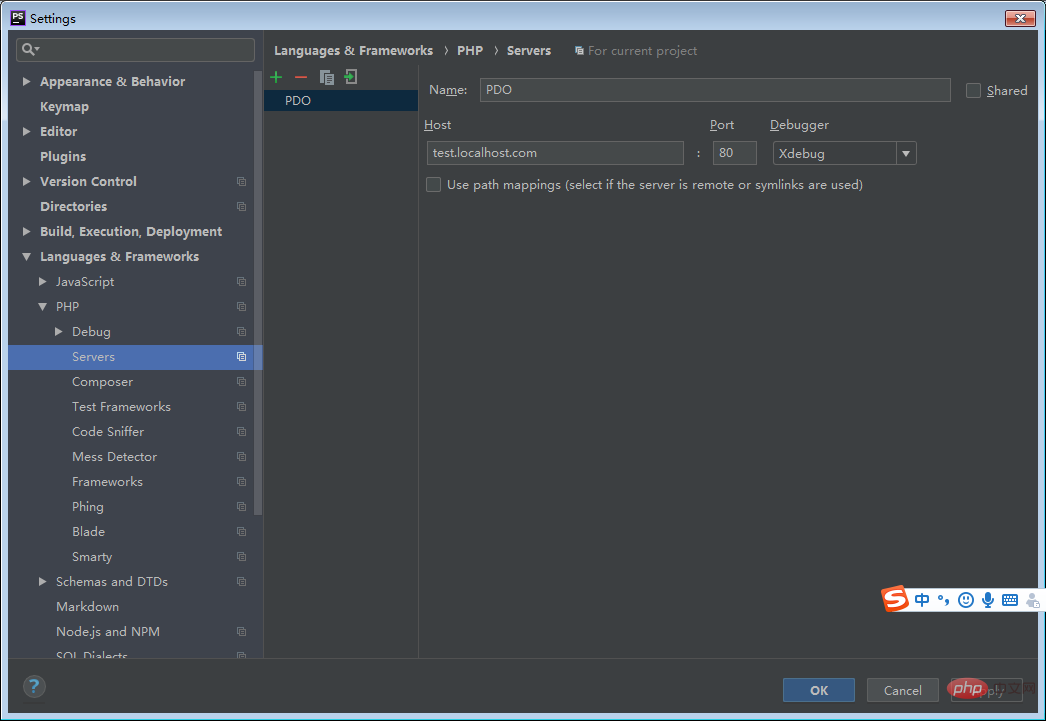
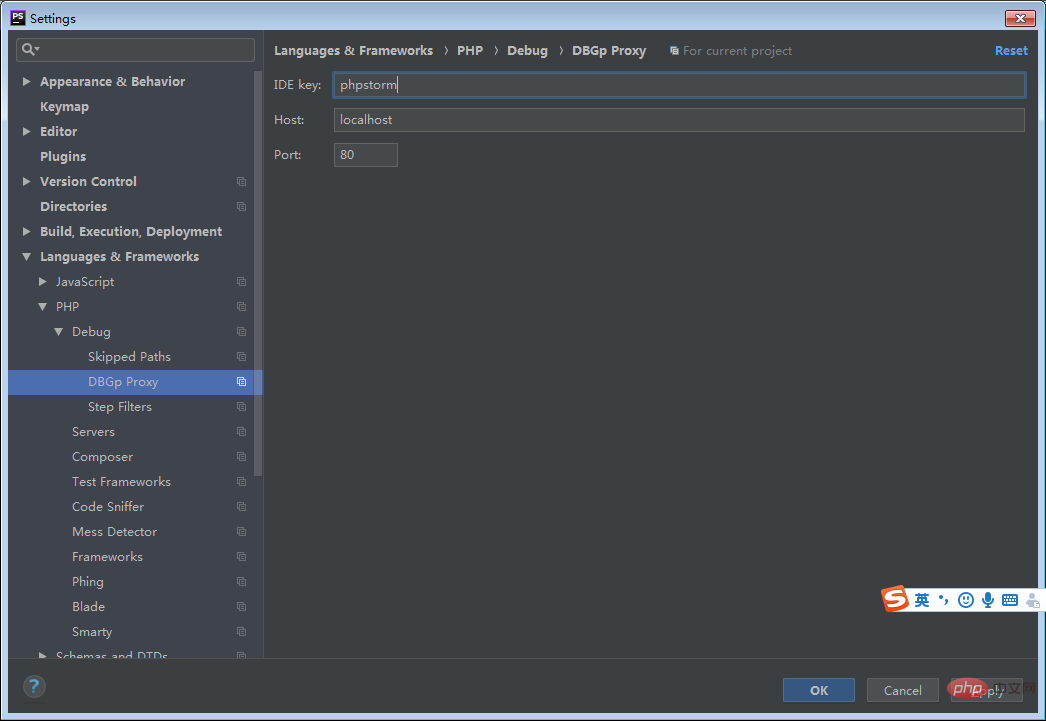
Go to phpstorm to configure the test: the debug port number must be the same as configured in php.ini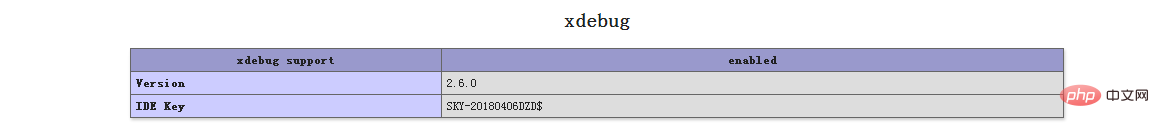
The above is the detailed content of Detailed graphic explanation of phpstorm settings debugging. For more information, please follow other related articles on the PHP Chinese website!
 How to export project in phpstorm
 How to configure the pycharm environment
 Vue parent component calls the method of child component
 css beyond display...
 How to solve the problem that laptop network sharing does not have permissions?
 What is the difference between mysql and mssql
 Usage of instr function in oracle
 The difference between static web pages and dynamic web pages


![[Web front-end] Node.js quick start](https://img.php.cn/upload/course/000/000/067/662b5d34ba7c0227.png)


