How to use xhprof analysis in php7
This article will introduce to you how to use xhprof analysis in php7. It has certain reference value. Friends in need can refer to it. I hope it will be helpful to everyone.

This is a pure document. If you need it in the future, you can look it up at any time and use xhprof for analysis to facilitate code testing and comparative analysis (supports php7).
Pre-build docker virtual test environment
docker run -it -p 80:80 -v /Users/xxx/Desktop/xhprof:/data phalcon /bin/bash
Copy code
1. Install xhprof
There are quite a few xhprofs that support php7, we use github.com/longxinH here /xh… This project.
1.1 Pull project
git clone https://github.com/longxinH/xhprof.git
Copy code
1.2 Install project
cd xhprof/extension/
/usr/server/php7/bin/phpize
./configure --with-php-config=/usr/server/php7/bin/php-config
make && make install
1.3 Add xhprof.so extension
Finish execution , we need to introduce this so file into the php.ini configuration
Check the php.ini file path
/usr/server/php7/bin/php --ini

Configuration File (php.ini) Path: /usr/server/php7/etc
Loaded Configuration File: /usr/server/php7/etc/php.ini
Scan for additional .ini files in: /usr/server/php7/etc/php
Additional .ini files parsed: (none)
编辑 /usr/server/php7/etc/php.ini
[Xhprof]
extension=xhprof.so
xhprof.output_dir=/data/logs
Restart php-fpm.
2. The process of building a case using xhprof
We embed the following code in front of the logic to be monitored
\xhprof_enable();
......
$order = new OrderAdepter();
$result = $order->getUserOrderByOrderNo(123);
......
$xhprof_data = \xhprof_disable();
print_r($xhprof_data);
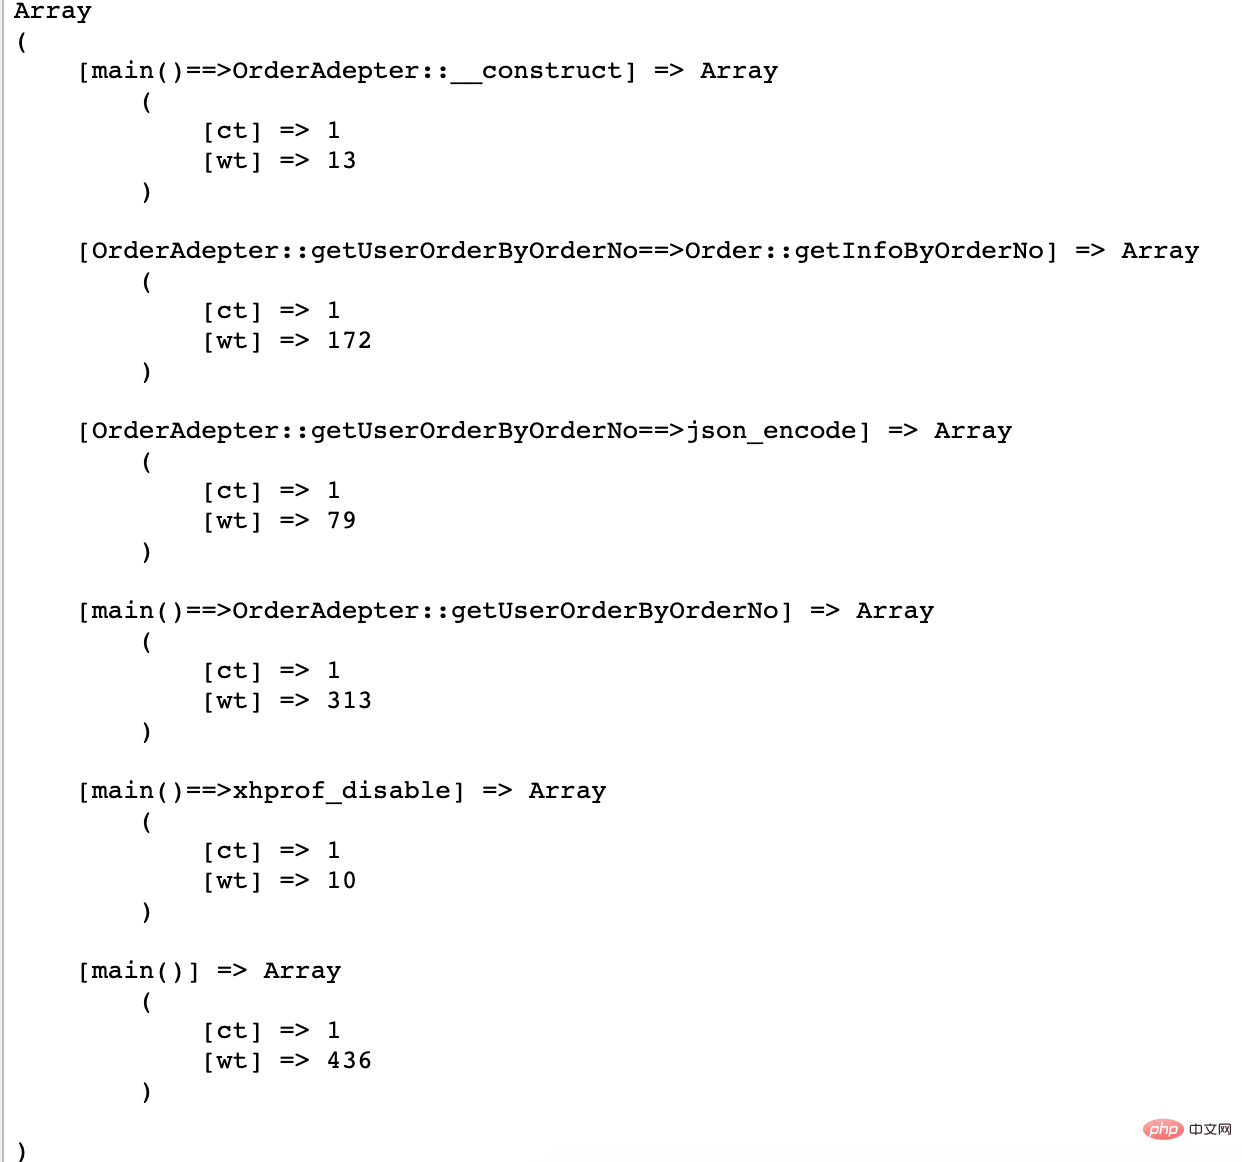
output:

We found that two functions in the xhprof expansion were called. The meaning of the output value
ct represents the current number of calls to this function. In this case, it is all once
wt represents the time consumption of function execution time, the unit is microseconds
Seeing this, we find that the information we obtain is not very much, for example, we often also care about the occupied memory, cpu and other indicators.
\xhprof_enable(
XHPROF_FLAGS_MEMORY
+XHPROF_FLAGS_CPU
+XHPROF_FLAGS_NO_BUILTINS
);
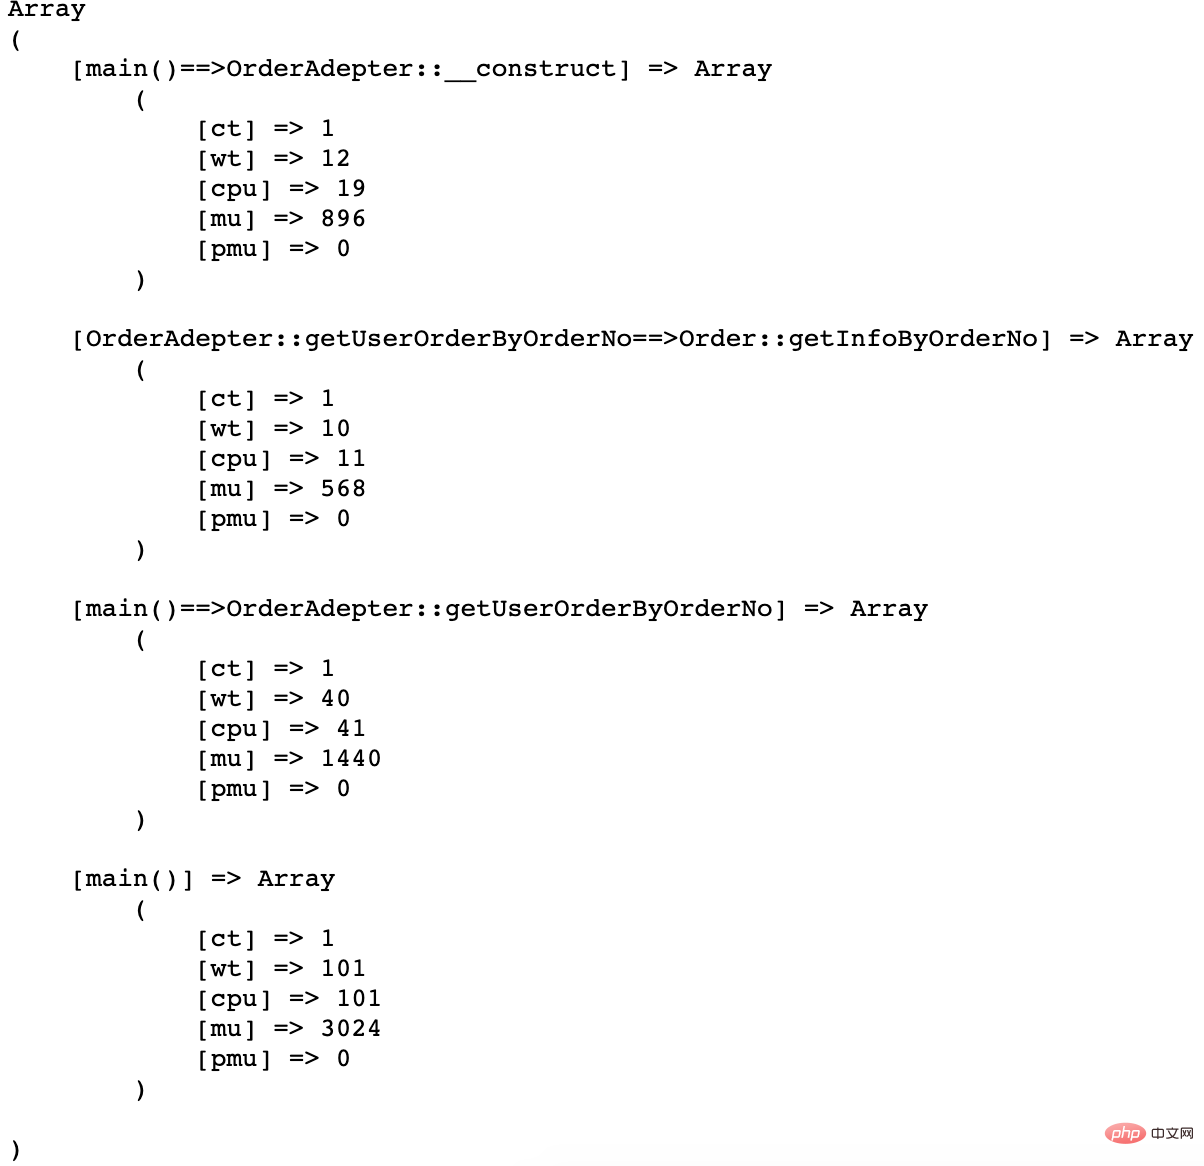
output:

- ##XHPROF_FLAGS_MEMORY statistical memory usage
- XHPROF_FLAGS_CPU counts CPU usage
- #We found that there are two output fields for statistical memory usage, mu and pmu. mu represents the memory used (bytes), and pmu represents the peak memory usage (bytes). 3. Chart xhprof
Of course, we still hope that the performance bottleneck can be observed more intuitively in the form of a chart. Let’s see how to use it.3.1 At this time, we need to use the xhprof_lib library
When we downloaded the xhprof source code, the directory already contained
\xhprof_enable(XHPROF_FLAGS_MEMORY + XHPROF_FLAGS_CPU+XHPROF_FLAGS_NO_BUILTINS);

......
$order = new OrderAdepter();
$result = $order->getUserOrderByOrderNo(123);
......

$xhprof_data = \xhprof_disable();

include_once '/data/xhprof-master/xhprof_lib/utils/xhprof_lib.php';
include_once '/data/xhprof-master/xhprof_lib/utils/xhprof_runs.php';
$xhprof_runs = new \XHProfRuns_Default();
$run_id = $xhprof_runs->save_run($xhprof_data, 'your_project');
echo $run_id; //output 5cbf25e21fe9b
. The execution printed out a string, which we can understand as a file identifier. We found that the save_run method was executed, so where was it saved?
Do you remember another configuration when we introduced the xhprof.so extension?
Yes, under the path configured by xhprof.output_dir (you need to manually create the directory yourself)
If you are interested, you can open it and take a look. It contains some serialized object information we analyzed.
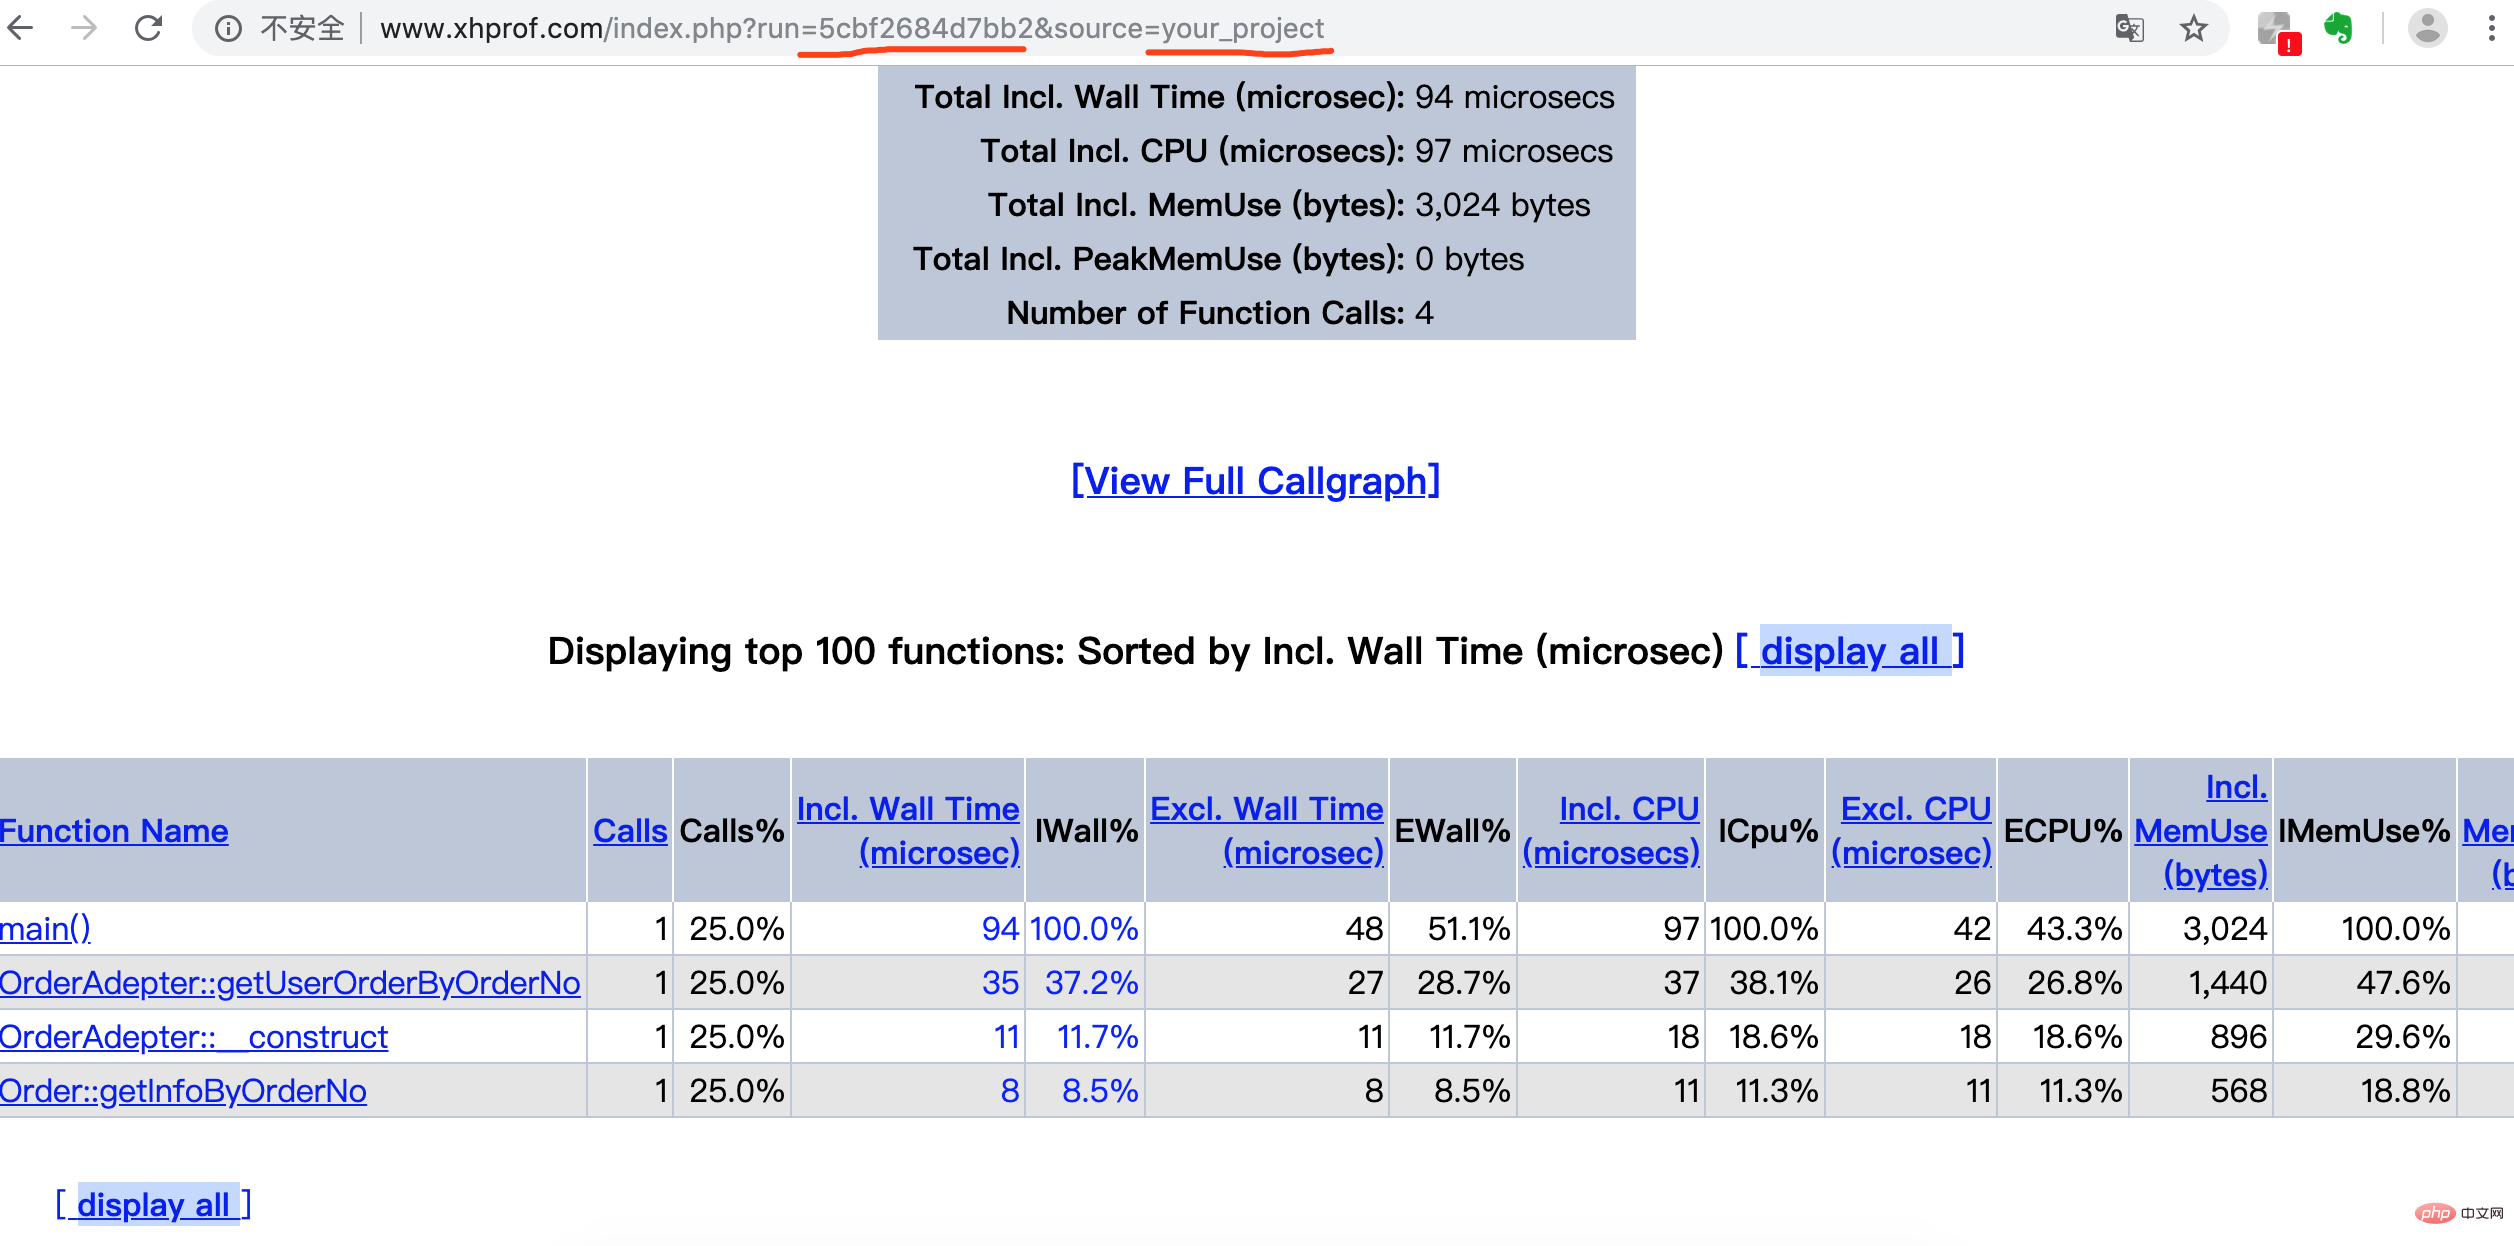
 3.2 Configure a separate service to access Our analysis results
We point to the xhprof_html directory in our xhprof project


The remaining % endings are the corresponding proportions3.3 [View Full Callgraph]You can also execute the following two lines of code to install
yum install -y libpng
yum install -y graphviz
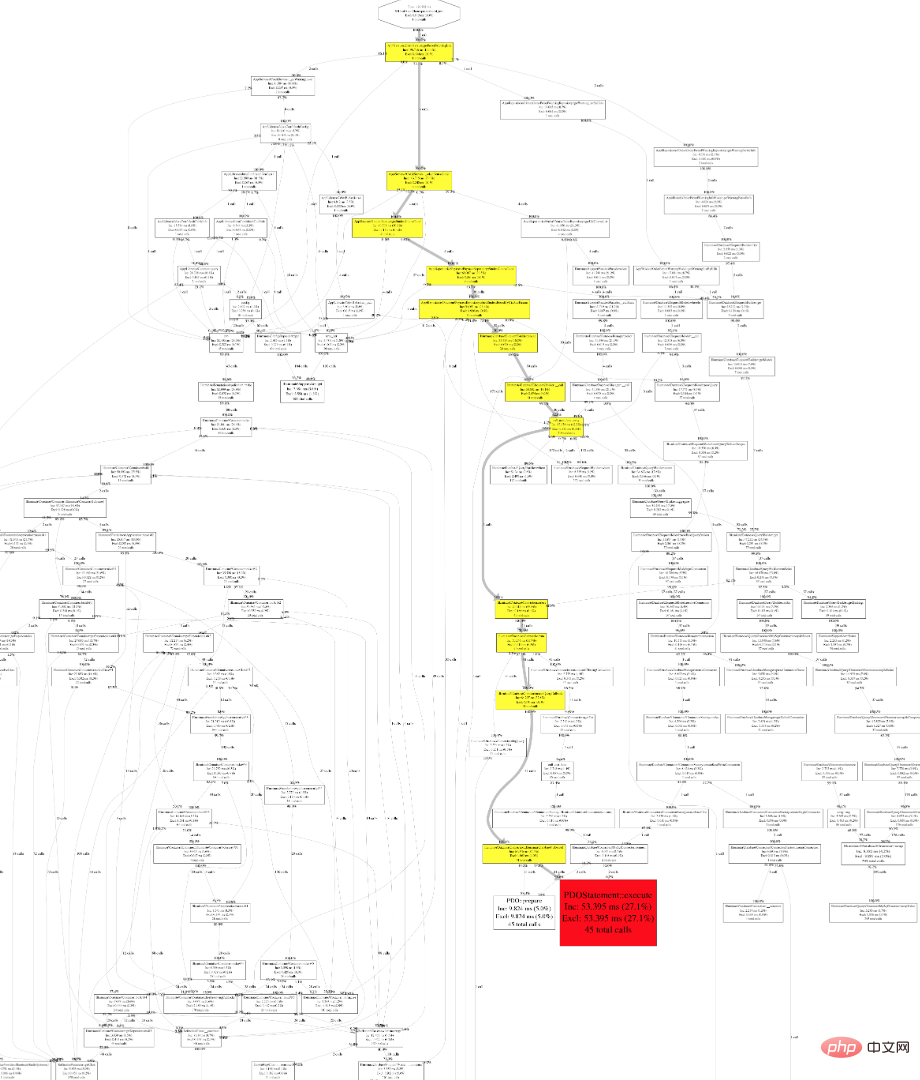
Copy after loginIf you want to view the call process, you need to install the graphviz graphics library. Here we recommend manually installing graphviz 2.24 .0 This version (personally step on the pit, 2.40 is not supported)
yum -y install libtool-ltdl-devel

cd /data/graphviz-2.24.0

./configure
make
make install
Copy after login
Focus on the red and yellow parts, if you feel that only If you want to analyze a certain process, you can click into a method and then click [View Full Callgraph] to view the chart

include_once '/data/xhprof-master/xhprof_lib/utils/xhprof_lib.php';
include_once '/data/xhprof-master/xhprof_lib/utils/xhprof_runs.php';
Copy after loginHere we can use the composer package reference to achieve the same function, and it is recommended to introduce the pbweb/xhprof package.
Recommended learning:php video tutorial
The above is the detailed content of How to use xhprof analysis in php7. For more information, please follow other related articles on the PHP Chinese website!

Hot AI Tools

Undresser.AI Undress
AI-powered app for creating realistic nude photos

AI Clothes Remover
Online AI tool for removing clothes from photos.

Undress AI Tool
Undress images for free

Clothoff.io
AI clothes remover

AI Hentai Generator
Generate AI Hentai for free.

Hot Article

Hot Tools

Notepad++7.3.1
Easy-to-use and free code editor

SublimeText3 Chinese version
Chinese version, very easy to use

Zend Studio 13.0.1
Powerful PHP integrated development environment

Dreamweaver CS6
Visual web development tools

SublimeText3 Mac version
God-level code editing software (SublimeText3)

Hot Topics
 1382
1382
 52
52
 How to install mongo extension in php7.0
Nov 21, 2022 am 10:25 AM
How to install the mongo extension in php7.0: 1. Create the mongodb user group and user; 2. Download the mongodb source code package and place the source code package in the "/usr/local/src/" directory; 3. Enter "src/" directory; 4. Unzip the source code package; 5. Create the mongodb file directory; 6. Copy the files to the "mongodb/" directory; 7. Create the mongodb configuration file and modify the configuration.
 How to solve the problem when php7 detects that the tcp port is not working
Mar 22, 2023 am 09:30 AM
In php5, we can use the fsockopen() function to detect the TCP port. This function can be used to open a network connection and perform some network communication. But in php7, the fsockopen() function may encounter some problems, such as being unable to open the port, unable to connect to the server, etc. In order to solve this problem, we can use the socket_create() function and socket_connect() function to detect the TCP port.
 What should I do if the plug-in is installed in php7.0 but it still shows that it is not installed?
Apr 02, 2024 pm 07:39 PM
To resolve the plugin not showing installed issue in PHP 7.0: Check the plugin configuration and enable the plugin. Restart PHP to apply configuration changes. Check the plugin file permissions to make sure they are correct. Install missing dependencies to ensure the plugin functions properly. If all other steps fail, rebuild PHP. Other possible causes include incompatible plugin versions, loading the wrong version, or PHP configuration issues.
 PHP Server Environment FAQ Guide: Quickly Solve Common Problems
Apr 09, 2024 pm 01:33 PM
Common solutions for PHP server environments include ensuring that the correct PHP version is installed and that relevant files have been copied to the module directory. Disable SELinux temporarily or permanently. Check and configure PHP.ini to ensure that necessary extensions have been added and set up correctly. Start or restart the PHP-FPM service. Check the DNS settings for resolution issues.
 How to install and deploy php7.0
Nov 30, 2022 am 09:56 AM
How to install and deploy php7.0: 1. Go to the PHP official website to download the installation version corresponding to the local system; 2. Extract the downloaded zip file to the specified directory; 3. Open the command line window and go to the "E:\php7" directory Just run the "php -v" command.
 How to automatically set permissions of unixsocket after system restart?
Mar 31, 2025 pm 11:54 PM
How to automatically set the permissions of unixsocket after the system restarts. Every time the system restarts, we need to execute the following command to modify the permissions of unixsocket: sudo...
 Why does an error occur when installing an extension using PECL in a Docker environment? How to solve it?
Apr 01, 2025 pm 03:06 PM
Causes and solutions for errors when using PECL to install extensions in Docker environment When using Docker environment, we often encounter some headaches...
 Which one is better, php8 or php7?
Nov 16, 2023 pm 03:09 PM
Compared with PHP7, PHP8 has some advantages and improvements in terms of performance, new features and syntax improvements, type system, error handling and extensions. However, choosing which version to use depends on your specific needs and project circumstances. Detailed introduction: 1. Performance improvement, PHP8 introduces the Just-in-Time (JIT) compiler, which can improve the execution speed of the code; 2. New features and syntax improvements, PHP8 supports the declaration of named parameters and optional parameters, making functions Calling is more flexible; anonymous classes, type declarations of properties, etc. are introduced.


