Quickly understand the performance indicators in Node.js
This article will take you through the performance indicators of Node.js, I hope it will be helpful to you!

For us front-end engineers, mastering Node.js application development is the only way for us to become senior/experts. In addition, Node.js is a server-side language. We must not only be able to complete development tasks, but also pay attention to server performance. [Recommended study: "nodejs Tutorial"]
This article will give some preliminary introduction to the basics and performance indicators of Node.js.
Application scenarios
Before introducing NodeJS performance indicators, let’s first take a look at its application scenarios. For different application scenarios, the performance indicators to focus on are Something different.
BFFThe middle layer, the proxy of the interface, acts as the gateway layerDevelopment and build tool
gulp,webpackBased on Node.jsDesktop application
Electroncombined with Node.jsSSRServer-side rendering
If Node.js is used for the front-end SSR, then CPU and Network will become the main performance bottleneck;
If you use NodeJS to perform data persistence related work, thenI/Oand Disk will have a high occupancy rate;
In most scenarios, CPU, Memory and NetworkIt can be said to be the main performance bottleneck of Node.
Advantages and Disadvantages
node.js is fault-tolerant and its performance is not very good
node.js operation database is not professional
node.js is strong in handling asynchronous io
io-intensive, not suitable for cpu-intensive
Event loop (libuv)
Here is a picture quoted from the official website, showing a simplified overview of the event loop operation sequence
Phase description
-
Timer: This stage executes the scheduling callback functions that have been
setTimeout()andsetInterval(). - Pending callback: I/O callback whose execution is delayed until the next loop iteration.
- idle, prepare: Only used internally by the system.
-
Polling: retrieves new I/O events; executes I/O-related callbacks (in almost all cases, except for shutdown callbacks, those driven by timers and
setImmediate()Except for scheduling), in other cases node will block here at the appropriate time. -
Detection:
setImmediate()The callback function is executed here. -
Closed callback function: Some closed callback functions, such as:
socket.on('close', ...)
V8 GC mechanism
We know that Node.js® is a JavaScript runtime environment based on Chrome V8 engine, and it is single-threaded.
V8 memory is divided into new generation and old generation:
New generation: Using from space->to space memory recycling scavenge algorithm
Old generation: Memory recycling in the form of reference marking and defragmentation
If the GC time is too long, it will cause the js thread to be blocked and affect service performance. Improper use of memory will cause memory overflow. After understanding the above basic knowledge of Node.js, let's look at the performance indicators
Performance indicators
We describe a performance indicator from the system level and the Node.js process level
System level
##For servers (physical machines, virtual machines, Docker, etc. ) level, providing the following monitoring indicators:
- Memory usage
- ##CPU
Usage rate
System load, number of processes in use/waiting for progress - System
- QPS
- Disk Usage
- GC
Statistics
##… …
For each Node.js process, the following monitoring indicators are provided:
In-heap (total and used) and off-heap memory statistics- Memory statistics occupied by each memory space in the heap
- Garbage collection (GC) accounts for the proportion of the entire process running time
- QPS
##CPU statistics based on 1s, 15s, 30s, and 60s
libuv handle, timer statistics
......
- How to obtain
How do we obtain the performance indicators mentioned above?
System level
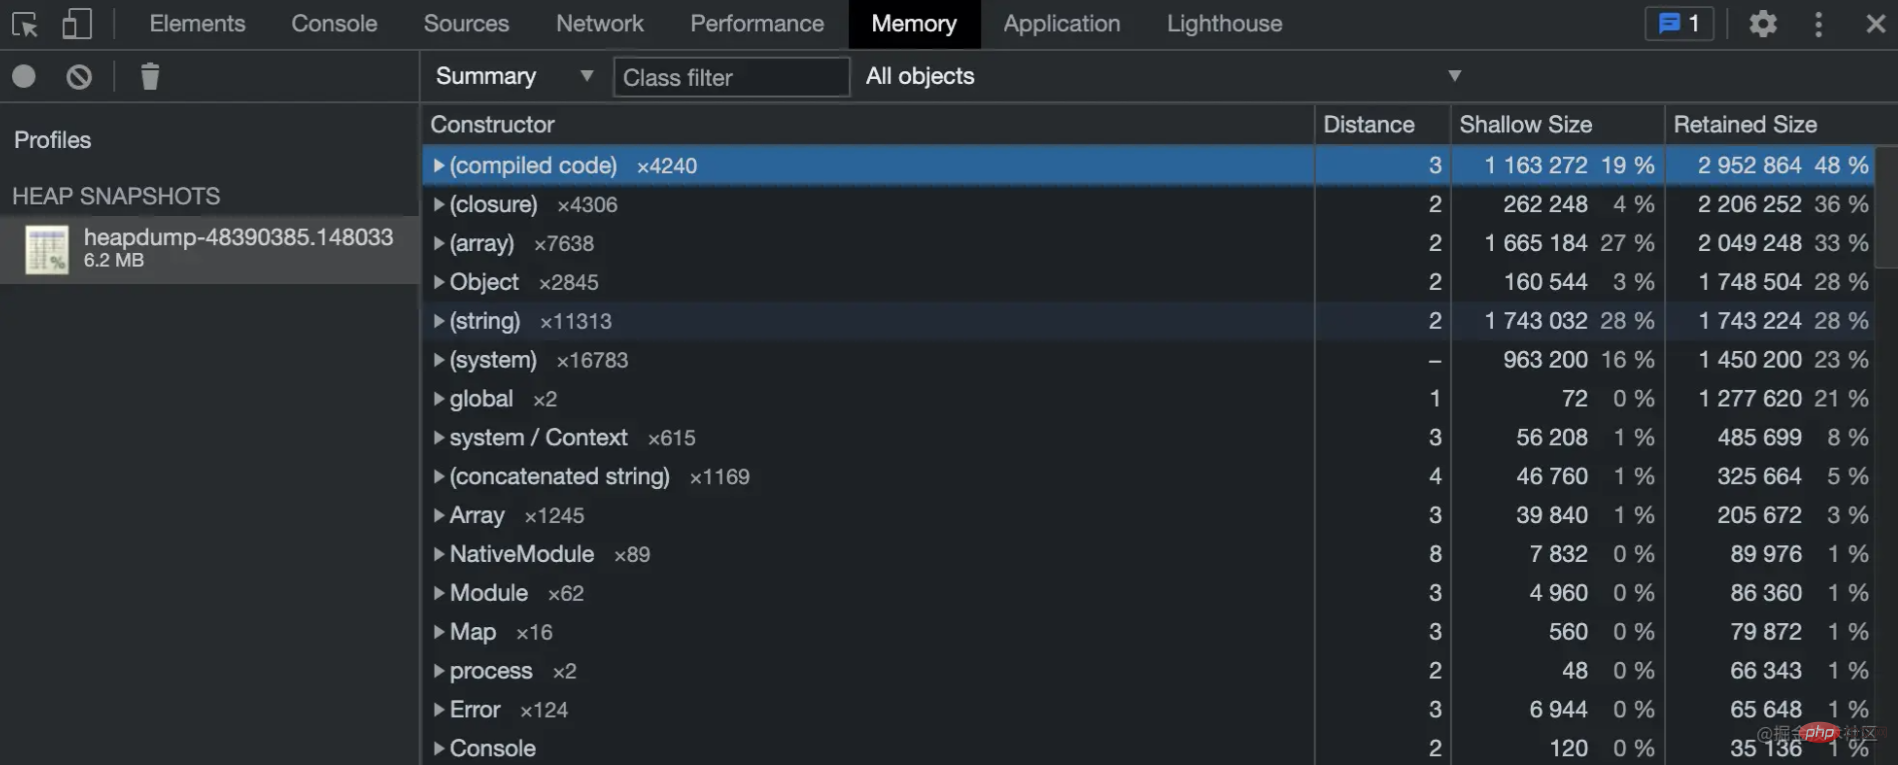
System-level indicators can be obtained in the following two ways 1. os module Code example Execution results 2. Use the top and iostat commands to check the memory and hard disk. top [parameter] iostat[Parameter] Memory usage Code example Execution result: Explanation of noun: rss is resident Set size is how much physical memory is allocated to this process (a part of the total allocated memory) Generally if this indicator increases, heapTotal and heapUsed represents V8's memory usage. external represents the memory usage of C objects bound to Javascript managed by V8. CPU profile Generally speaking, if it involves a memory leak, you can grab a heap snapshot, then If the CPU is abnormally high, you can grab It can be obtained in the following two ways: GC trace V8 provides many parameter options for node.js program startup. You can obtain GC log information through the following example code node --trace_gc execution results You can see that V8 uses different GC processes for new and old memories Memory Snapshot If node-inspector is used, there will be front-end variable interference in the snapshot. It is recommended to use heapdump to save memory snapshots and devtool to view memory snapshots. When you use heapdump to save a memory snapshot, only the objects in the Node.js environment will be uninterrupted. The use of Before the project goes online, a stress test is required to find out whether there is memory through the stress test Leakage Stress testing tools: ab test (ApacheBench), autocannon The following shows the results of stress testing using the ab function You can see the above running results One of our QPS: 4301.28/sec The average duration of each request: 23ms Transmission rate: 617.47kb/s Node.js is relatively professional back-end language Java, PHP, etc. Some basic construction is relatively Not perfect enough. Coupled with the characteristics of single thread, in large-scale applications, it is easy to cause performance bottlenecks in the server or Node.js process. There are usually three situations that cause node memory leaks: The memory size limit of node v8 itself: 64-bit system is about 1.4GB, 32-bit system is about 0.7GB. Improper use of programs: global variable references, improper use of closures, event listeners not destroyed Large file applications: buffer operations should be used, The buffer does not occupy v8 memory #So how to check for memory leaks? You can use the following tools 1. heapdump: Generate memory snapshot chrome panel analysis It should be noted that printing memory snapshots is a very CPU-intensive operation and may have an impact on online business. Introduction Get Method 1: Command 方式二:调用writeSnapshot chrome面板分析 二. alinode 阿里云也提供了Nodejs应用的性能平台alinode,可以很方便、全面的为我们收集性能指标数据,同时以可视化图表的方式,更加的直观。接入alinode可参考5分钟快速入门 以下是部分采集数据图表展示 一些指标描述 Memory CPU Load 下面是一些 QPS 该实例所有 Node.js 进程每秒钟处理的 HTTP 请求数之和。 GC 三. 开源Easy-Monitor 企业级 Node.js 应用性能监控与线上故障定位解决方案。 Easy-Monitor是一款轻量级的Node性能监控工具。快速入口 我们也可以给予它的基础之上去搭建部署一套自己内部的性能平台。 以上是我关于Node.js性能指标以及获取的简单介绍,更多的是对包含性能点的一个整体上的介绍,那针对每个性能指标我们都可以去再做更深入的研究。希望这篇文章能够帮助你,同时也感谢你的阅读,期待再见~ Node.js 性能平台 原文地址:https://juejin.cn/post/7008006326857138184 作者:比心FE 更多编程相关知识,请访问:编程入门!!const os = requie('os')


//该方法返回 Node.js 进程的内存使用情况的对象
process.memoryUsage()

{
  rss: 4935680,
  heapTotal: 1826816,
  heapUsed: 650472,
  external: 49879
}复制代码memory leaks may occurCPU Profile


heapdump will be introduced laterStress test

Memory leak
Tool usage
const heapdump = require('heapdump')
kill -USR2 <pid> 
heapdump.writeSnapshot('./' + Date.now() + '.heapsnapshot');

memory_sys:系统内存使用百分比。memory_node: 所有 Node.js 进程内存使用之和占系统内存的百分比。
cpu_sys:系统 CPU 使用百分比。cpu_node:所有 Node.js 进程 CPU 使用百分比之和。
load1:1分钟内平均 Load。load5:5分钟内平均 Load。load15:15分钟内平均 Load。Load 的参考信息 (Load 已经归一化处理,如果是 N 核 CPU,那么相应 Load * N):
0.7 :不错的状态,有新任务也可以及时处理;Load = 1:即将有任务需要额外的等待时间才能被处理,需要引起关注;Load > 5:任务需要等待时间很长,需要干预处理。load15,如果很高,再看 load1 和 load5,看是否有下降趋势,短时间内 load1 大于 1,不用担心,如果长时间 Load 较高,需要引起关注。
gc_avg:所有 Node.js 进程垃圾回收时间占比平均值。gc_max:每分钟内垃圾回收时间最多的 Node.js 进程的垃圾回收时间占比。总结
参考
如何分析 Node.js 中的内存泄漏
本文示例代码
The above is the detailed content of Quickly understand the performance indicators in Node.js. For more information, please follow other related articles on the PHP Chinese website!

Hot AI Tools

Undresser.AI Undress
AI-powered app for creating realistic nude photos

AI Clothes Remover
Online AI tool for removing clothes from photos.

Undress AI Tool
Undress images for free

Clothoff.io
AI clothes remover

Video Face Swap
Swap faces in any video effortlessly with our completely free AI face swap tool!

Hot Article

Hot Tools

Notepad++7.3.1
Easy-to-use and free code editor

SublimeText3 Chinese version
Chinese version, very easy to use

Zend Studio 13.0.1
Powerful PHP integrated development environment

Dreamweaver CS6
Visual web development tools

SublimeText3 Mac version
God-level code editing software (SublimeText3)

Hot Topics
 1392
1392
 52
52
 Detailed graphic explanation of the memory and GC of the Node V8 engine
Mar 29, 2023 pm 06:02 PM
This article will give you an in-depth understanding of the memory and garbage collector (GC) of the NodeJS V8 engine. I hope it will be helpful to you!
 An article about memory control in Node
Apr 26, 2023 pm 05:37 PM
The Node service built based on non-blocking and event-driven has the advantage of low memory consumption and is very suitable for handling massive network requests. Under the premise of massive requests, issues related to "memory control" need to be considered. 1. V8’s garbage collection mechanism and memory limitations Js is controlled by the garbage collection machine
 Let's talk about how to choose the best Node.js Docker image?
Dec 13, 2022 pm 08:00 PM
Choosing a Docker image for Node may seem like a trivial matter, but the size and potential vulnerabilities of the image can have a significant impact on your CI/CD process and security. So how do we choose the best Node.js Docker image?
 Let's talk in depth about the File module in Node
Apr 24, 2023 pm 05:49 PM
The file module is an encapsulation of underlying file operations, such as file reading/writing/opening/closing/delete adding, etc. The biggest feature of the file module is that all methods provide two versions of **synchronous** and **asynchronous**, with Methods with the sync suffix are all synchronization methods, and those without are all heterogeneous methods.
 Node.js 19 is officially released, let's talk about its 6 major features!
Nov 16, 2022 pm 08:34 PM
Node 19 has been officially released. This article will give you a detailed explanation of the 6 major features of Node.js 19. I hope it will be helpful to you!
 Let's talk about the GC (garbage collection) mechanism in Node.js
Nov 29, 2022 pm 08:44 PM
How does Node.js do GC (garbage collection)? The following article will take you through it.
 Let's talk about the event loop in Node
Apr 11, 2023 pm 07:08 PM
The event loop is a fundamental part of Node.js and enables asynchronous programming by ensuring that the main thread is not blocked. Understanding the event loop is crucial to building efficient applications. The following article will give you an in-depth understanding of the event loop in Node. I hope it will be helpful to you!
 Let's talk about how to use pkg to package Node.js projects into executable files.
Dec 02, 2022 pm 09:06 PM
How to package nodejs executable file with pkg? The following article will introduce to you how to use pkg to package a Node project into an executable file. I hope it will be helpful to you!


