 Web Front-end
 JS Tutorial
 How does Angular optimize? A brief analysis of performance optimization solutions
How does Angular optimize? A brief analysis of performance optimization solutions
How to optimize Angular? The following article will let you know about the performance optimization in Angular, I hope it will be helpful to you!

This article will talk about the performance optimization of Angular, and mainly introduce the optimization related to runtime. Before talking about how to optimize, first we need to clarify what kind of pages have performance problems? What are the measures of good performance? What is the principle behind performance optimization? If these questions interest you, then please read on. [Related tutorial recommendations: "angular tutorial"]

##Change detection mechanism
Different from network transmission optimization, runtime optimization focuses more on Angular's operating mechanism and how to code to effectively avoid performance problems (best practices). To understand the operating mechanism of Angular, you first need to understand its change detection mechanism (also known as dirty checking) - how to re-render state changes into the view. How to reflect changes in component status to the view is also a problem that all three front-end frameworks need to solve. Solutions from different frameworks have similar ideas but also have their own characteristics. First of all, Vue and React both use virtual DOM to implement view updates, but there are still differences in the specific implementation: For React:- By using
setState
orforceUpdateto trigger therendermethod to update the view - When the parent component updates the view, it will also Determine whether
re-render
subcomponent
- Vue will traverse
data
All properties of the object, and useObject.definePropertyto convert all these properties into wrappedgetterandsetter - Each component instance has a corresponding
watcher
instance object, which will record the properties as dependencies during the component rendering process - When the dependencies When
setter
is called, it will notifywatcherto recalculate, so that its associated components can be updated
setTimeout in the browser:
let originalSetTimeout = window.setTimeout;

window.setTimeout = function(callback, delay) {
  return originalSetTimeout(Zone.current.wrap(callback),  delay);
}

Zone.prototype.wrap = function(callback) {
  // 获取当前的 Zone
  let capturedZone = this;

  return function() {
    return capturedZone.runGuarded(callback, this, arguments);
  };
};Promise.then method:
let originalPromiseThen = Promise.prototype.then;

// NOTE: 这里做了简化,实际上 then 可以接受更多参数
Promise.prototype.then = function(callback) {
  // 获取当前的 Zone
  let capturedZone = Zone.current;

  function wrappedCallback() {
    return capturedZone.run(callback, this, arguments);
  };

  // 触发原来的回调在 capturedZone 中
  return originalPromiseThen.call(this, [wrappedCallback]);
};Zone.fork() method. For details, please refer to the following configuration:
Zone.current.fork(zoneSpec) // zoneSpec 的类型是 ZoneSpec

// 只有 name 是必选项,其他可选
interface ZoneSpec {
  name: string; // zone 的名称,一般用于调试 Zones 时使用
  properties?: { [key: string]: any; } ; // zone 可以附加的一些数据,通过 Zone.get('key') 可以获取
  onFork: Function; // 当 zone 被 forked,触发该函数
  onIntercept?: Function; // 对所有回调进行拦截
  onInvoke?: Function; // 当回调被调用时,触发该函数
  onHandleError?: Function; // 对异常进行统一处理
  onScheduleTask?: Function; // 当任务进行调度时,触发该函数
  onInvokeTask?: Function; // 当触发任务执行时,触发该函数
  onCancelTask?: Function; // 当任务被取消时,触发该函数
  onHasTask?: Function; // 通知任务队列的状态改变
} A simple example of onInvoke:
let logZone = Zone.current.fork({
  name: 'logZone',
  onInvoke: function(parentZoneDelegate, currentZone, targetZone, delegate, applyThis, applyArgs, source) {
    console.log(targetZone.name, 'enter');
    parentZoneDelegate.invoke(targetZone, delegate, applyThis, applyArgs, source)
    console.log(targetZone.name, 'leave'); }
});

logZone.run(function myApp() {
    console.log(Zone.current.name, 'queue promise');
    Promise.resolve('OK').then((value) => {console.log(Zone.current.name, 'Promise', value)
  });
});
applicatoin_ref.ts file, when ApplicationRef is built, it subscribes to the callback event that the microtask queue is empty, and it calls tick Method (i.e. change detection):

Secondly, in the checkStable method, it will be judged that the onMicrotaskEmpty event will be triggered when the microtask queue is emptied (in combination, it is equivalent to triggering change detection):

Finally, the places that can trigger the call of the checkStable method are in the three hook functions of Zone.js, which are onInvoke, onInvokeTask and onHasTask:

onHasTask—— Hooks triggered when presence or absence of ZoneTask is detected:

Micro Task: Created by Promise etc. The Promise of native is required before the end of the current event loop executed, and the patched Promise will also be executed before the end of the event loop.
Macro Task: Created by setTimeout etc., native’s setTimeout will be Time is processed.
Event Task: Created by addEventListener etc. These task may be triggered multiple times or may never be triggered.
Event Task can actually be regarded as a macro task. In other words, all events or asynchronous APIs can be understood as macro tasks or micro tasks. One of them, and their execution order is analyzed in detail in the previous article. Simply put:
(1) After the main thread is executed, the microprocessor will be checked first. Whether there are still tasks to be executed in the task queue(2) After the first polling is completed, it will check whether there are still tasks to execute in the macro task queue. After the execution, check whether there are still tasks to execute in the micro task list, and then This process will be repeatedPerformance Optimization Principle
The most intuitive way to judge the performance of a page is to see whether the page response is smooth and responsive. Be quick. Page response is essentially the process of re-rendering page state changes to the page. From a relatively macro perspective, Angular's change detection is actually only one part of the entire event response cycle. All interactions between users and the page are triggered through events, and the entire response process is roughly as follows: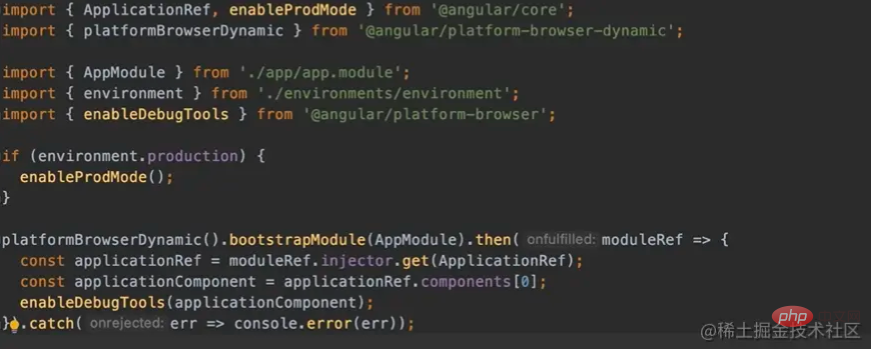
前面有提到,大多数情况通过观察页面是否流畅可以判断页面的是否存在性能问题。虽然这种方式简单、直观,但也相对主观,并非是通过精确的数字反映页面的性能到底如何。换言之,我们需要用一个更加有效、精确的指标来衡量什么样的页面才是具备良好性能的。而 Angular 官方也提供了相应的方案,可以通过开启 Angular 的调试工具,来实现对变更检测循环(完成的 tick)的时长监控。
首先,需要使用 Angular 提供的 enableDebugTools 方法,如下:

之后只需要在浏览器的控制台中输入 ng.profiler.timeChangeDetection() ,即可看到当前页面的平均变更检测时间:
从上面可以看出,执行了 692 次变更检测循环(完整的事件响应周期)的平均时间为 0.72 毫秒。如果多运行几次,你会发现每次运行的总次数是不一样、随机的。
官方提供了这样一个判断标准:理想情况下,分析器打印出的时长(单次变更检测循环的时间)应该远低于单个动画帧的时间(16 毫秒)。一般这个时长保持在 3 毫秒下,则说明当前页面的变更检测循环的性能是比较好的。如果超过了这个时长,则就可以结合 Angular 的变更检测机制分析一下是否存在重复的模板计算和变更检测。
性能优化方案
在理解 Angular 优化原理的基础上,我们就可以更有针对性地去进行相应的性能优化:
(1)针对异步任务 ——减少变更检测的次数
- 使用 NgZone 的 runOutsideAngular 方法执行异步接口
- 手动触发 Angular 的变更检测
(2)针对 Event Task —— 减少变更检测的次数
- 将 input 之类的事件换成触发频率更低的事件
- 对 input valueChanges 事件做的防抖动处理,并不能减少变更检测的次数
如上图,防抖动处理只是保证了代码逻辑不会重复运行,但是 valueChanges 的事件却随着 value 的改变而触发(改变几次,就触发几次),而只要有事件触发就会相应触发变更检测。
(3)使用 Pipe ——减少变更检测中的计算次数
将 pipe 定义为 pure pipe(
@Pipe默认是 pure pipe,因此也可以不用显示地设置pure: true)import { Piep, PipeTransform } from '@angular/core'; @Pipe({ name: 'gender', pure, }) export class GenderPiep implements PipeTransform { transform(value: string): string { if (value === 'M') return '男'; if (value === 'W') return '女'; return ''; } }Copy after login
关于 Pure/ImPure Pipe:
Pure Pipe: 如果传入 Pipe 的参数没有改变,则会直接返回之前一次的计算结果
ImPure Pipe: 每一次变更检测都会重新运行 Pipe 内部的逻辑并返回结果。(简单来说, ImPure Pipe 就等价于普通的 formattedFunction,如果一个页面触发了多次的变更检测,那么 ImPure Pipe 的逻辑就会执行多次)
(4)针对组件 ——减少不必要的变更检测
- 组件使用 onPush 模式
- 只有输入属性发生变化时,该组件才会检测
- 只有该组件或者其子组件中的 DOM 事件触发时,才会触发检测
- 非 DOM 事件的其他异步事件,只能手动触发检测
- 声明了 onPush 的子组件,如果输入属性未变化,就不会去做计算和更新
@Component({
  ...
  changeDetection: ChangeDetectionStrategy.OnPush,
})
export class XXXComponent {
	....
}在 Angular 中 显示的设置 @Component 的 changeDetection 为 ChangeDetectionStrategy.OnPush 即开启 onPush 模式(默认不开启),用 OnPush 可以跳过某个组件或者某个父组件以及它下面所有子组件的变化检测,如下所示:
(5)针对模板 ——减少不必要的计算和渲染
- Use trackBy for loop rendering of the list
- Use cached values as much as possible and avoid using method calls and get attribute calls
- If there is a place in the template where you really need to call a function, and For multiple calls, you can use template caching
- ngIf to control the display of the component and place it where the component is called.
(6) Other coding optimization suggestions
- Do not use try/catch for process control, which will cause a lot of time consumption (recording a large amount of stack information, etc.)
- Excessive animations will cause page loading lag
- You can use virtual scrolling for long lists
- Delay the load as much as possible for the preload module, because the browser's concurrent number of http request threads is limited. Once the limit is exceeded, subsequent requests will be blocked. Blocking and hanging
- Wait
##Summary
(1) Briefly explain how Angular uses Zone .js to implement change detection(2) On the basis of understanding Angular’s change detection, further clarify the principles of Angular performance optimization and the criteria for judging whether a page has good performance(3) Provide some targeted runtime performance optimization solutionsFor more programming-related knowledge, please visit:Introduction to Programming! !
The above is the detailed content of How does Angular optimize? A brief analysis of performance optimization solutions. For more information, please follow other related articles on the PHP Chinese website!

Hot AI Tools

Undresser.AI Undress
AI-powered app for creating realistic nude photos

AI Clothes Remover
Online AI tool for removing clothes from photos.

Undress AI Tool
Undress images for free

Clothoff.io
AI clothes remover

AI Hentai Generator
Generate AI Hentai for free.

Hot Article

Hot Tools

Notepad++7.3.1
Easy-to-use and free code editor

SublimeText3 Chinese version
Chinese version, very easy to use

Zend Studio 13.0.1
Powerful PHP integrated development environment

Dreamweaver CS6
Visual web development tools

SublimeText3 Mac version
God-level code editing software (SublimeText3)

Hot Topics
 1386
1386
 52
52
 Performance optimization and horizontal expansion technology of Go framework?
Jun 03, 2024 pm 07:27 PM
In order to improve the performance of Go applications, we can take the following optimization measures: Caching: Use caching to reduce the number of accesses to the underlying storage and improve performance. Concurrency: Use goroutines and channels to execute lengthy tasks in parallel. Memory Management: Manually manage memory (using the unsafe package) to further optimize performance. To scale out an application we can implement the following techniques: Horizontal Scaling (Horizontal Scaling): Deploying application instances on multiple servers or nodes. Load balancing: Use a load balancer to distribute requests to multiple application instances. Data sharding: Distribute large data sets across multiple databases or storage nodes to improve query performance and scalability.
 C++ Performance Optimization Guide: Discover the secrets to making your code more efficient
Jun 01, 2024 pm 05:13 PM
C++ performance optimization involves a variety of techniques, including: 1. Avoiding dynamic allocation; 2. Using compiler optimization flags; 3. Selecting optimized data structures; 4. Application caching; 5. Parallel programming. The optimization practical case shows how to apply these techniques when finding the longest ascending subsequence in an integer array, improving the algorithm efficiency from O(n^2) to O(nlogn).
 Optimizing rocket engine performance using C++
Jun 01, 2024 pm 04:14 PM
By building mathematical models, conducting simulations and optimizing parameters, C++ can significantly improve rocket engine performance: Build a mathematical model of a rocket engine and describe its behavior. Simulate engine performance and calculate key parameters such as thrust and specific impulse. Identify key parameters and search for optimal values using optimization algorithms such as genetic algorithms. Engine performance is recalculated based on optimized parameters to improve its overall efficiency.
 The Way to Optimization: Exploring the Performance Improvement Journey of Java Framework
Jun 01, 2024 pm 07:07 PM
The performance of Java frameworks can be improved by implementing caching mechanisms, parallel processing, database optimization, and reducing memory consumption. Caching mechanism: Reduce the number of database or API requests and improve performance. Parallel processing: Utilize multi-core CPUs to execute tasks simultaneously to improve throughput. Database optimization: optimize queries, use indexes, configure connection pools, and improve database performance. Reduce memory consumption: Use lightweight frameworks, avoid leaks, and use analysis tools to reduce memory consumption.
 How to use profiling in Java to optimize performance?
Jun 01, 2024 pm 02:08 PM
Profiling in Java is used to determine the time and resource consumption in application execution. Implement profiling using JavaVisualVM: Connect to the JVM to enable profiling, set the sampling interval, run the application, stop profiling, and the analysis results display a tree view of the execution time. Methods to optimize performance include: identifying hotspot reduction methods and calling optimization algorithms
 What are the common methods for program performance optimization?
May 09, 2024 am 09:57 AM
Program performance optimization methods include: Algorithm optimization: Choose an algorithm with lower time complexity and reduce loops and conditional statements. Data structure selection: Select appropriate data structures based on data access patterns, such as lookup trees and hash tables. Memory optimization: avoid creating unnecessary objects, release memory that is no longer used, and use memory pool technology. Thread optimization: identify tasks that can be parallelized and optimize the thread synchronization mechanism. Database optimization: Create indexes to speed up data retrieval, optimize query statements, and use cache or NoSQL databases to improve performance.
 How to quickly diagnose PHP performance issues
Jun 03, 2024 am 10:56 AM
Effective techniques for quickly diagnosing PHP performance issues include using Xdebug to obtain performance data and then analyzing the Cachegrind output. Use Blackfire to view request traces and generate performance reports. Examine database queries to identify inefficient queries. Analyze memory usage, view memory allocations and peak usage.
 Nginx Performance Tuning: Optimizing for Speed and Low Latency
Apr 05, 2025 am 12:08 AM
Nginx performance tuning can be achieved by adjusting the number of worker processes, connection pool size, enabling Gzip compression and HTTP/2 protocols, and using cache and load balancing. 1. Adjust the number of worker processes and connection pool size: worker_processesauto; events{worker_connections1024;}. 2. Enable Gzip compression and HTTP/2 protocol: http{gzipon;server{listen443sslhttp2;}}. 3. Use cache optimization: http{proxy_cache_path/path/to/cachelevels=1:2k


