
 Development Tools
VSCode
How to enable debugging mode in VSCode? Brief analysis of three methods
Development Tools
VSCode
How to enable debugging mode in VSCode? Brief analysis of three methods
How to enable debugging mode in VSCode? Brief analysis of three methods

This article will introduce the necessity of trial mode to everyone, and talk about the three ways to enable debugging mode in VSCode. I hope it will be helpful to everyone!

In the process of code writing or maintenance (
bug), for simple values or problems, we can useConsolecan be used to solve the problem. Some people even think thatconsoleis a good method and a silver bullet that can solve all problems. I don’t think it is. For those who want to clarify the execution logic of the code, there is also the option of checking complex types. (Reference type) value, you still have to use debug mode (debugger). https://juejin.cn/post/7024890041948176398#heading-1
debuggeris a statement injs, run here One line, if the program is in debugging mode, there will be a breakpoint, that is, it will stop at this line, then we can see the context at this time, including the values of the most important variables, and the call stack. And it also supports our single Debugging step by step, or debugging block by block.
Usually debugging is more in the browser. In the browser, you only need to open the console, turn on the debugging mode, and then encounter# The ##debugger
statement, or a custom breakpoint, will stop the program and enterdebugmode.

This article will mainly discuss how to enable debugging mode invscode
, because I am going to write avscodeplug-in (stay tuned), debuggingvscodeis inevitable, and the simple debugging before will definitely not meet my needs, so let’s learn about the debugging mode ofvscode.
This article will not write about debugging skills, but will write about,Rediscuss the necessity of debugging modevscode
How to enable debuggingjs.Here is vscodeofficial documentation
If you only need to see a simple value, then you can useconsole
, because the debugging mode is turned on The cost is relatively large.
In the browser, because the object is a reference type and the browser will not directly fold the object, so ifconsole
after After modifying the object, go to the console to see it. What you get will be the modified object
It will not be automatically folded after printing
When I fold it manually, the browser reads the value again and it has become the modified value
This kind of problem occurs because of the object, so if we convert it to a string and then print it, we won't have this problem. However, it doesn't look good. Here is just an example. In some cases, you still need to use debugging mode.Enable debugging mode in
vscode
Debug in vscodejs,ts Code, there are three ways
- When running
node
in thevscodeterminal, it will be automatically attached,See 3.1.##Directly use the - debug
terminal provided by
vscode,see 3.2Use the configuration file, - See 3.3
In When running
nodeThere are 4 options in total, and there are three ways to switch optionsin the terminal of
vscode, it will automatically determine whether to start thedebugmode based on different options.
1.1 Ways to switch options
No matter which setting method is used, change After knowing the setting method, it is best to restart
vscodeBy settingto make it take better effect
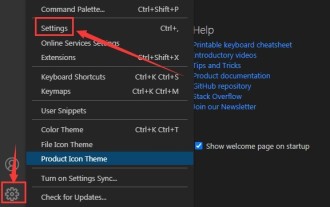
##By modifying the configuration file
Open the configuration file
settings.jsonAfter the file
// 修改或添加
{
  "debug.javascript.autoAttachFilter": "onlyWithFlag"
}By command (recommended)
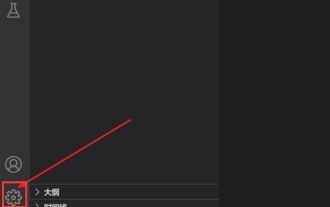
Use
Ctrl Shift Pto call up the command (macor find it yourself if you have modified the shortcut keys),
Enter
attachto find it. After selecting, you can see these four options, and then select the option again to switch to the option you want
1.2 The meaning of each option
The documentation on the official website has not been updated, and the default option is no longer
smart, changed todisabled
| option | meaning |
|---|---|
Always (always) | Always start in debug mode |
Intelligent(smart) | Only the specified file will enter the debug mode |
Only with the flag (onlyWithFlag ) | With --inspect or inspect-brk parameters, start in debug mode |
Disabled(disabled) | Never start in debug mode |
Smart(smart)is the file path that specifies whether to enabledebugmode through thedebug.javascript.autoAttachSmartPatternconfiguration item. The default value is["${ workspaceFolder}/**","!**/node_modules/**","**/$KNOWN_TOOLS$/**"]
##If starteddisable( disabled)
mode, thennode --inspectwill not enterdebugmode, and can only be entered by opening adebugterminal in the following waydebugmode, hey~vscodeis also a scam, I don’t know when the default mode was changed todisabled, so I remember one time I usednode --inspectfailed to enter thedebugmode, which was quite strange. Now I understand what happened.
2 JavaScript Debug Terminal(debug Terminal)
Directly start a terminal indebug
mode, andnodestarted in it will enterdebugmode.
Through the above method (Auto Attach
), all terminals started invscodeare controlled. This only controls the one started by it. Terminal.
3 Launch Configuration
#This is the highlight, and I am the main one Want to know more about this
Startup configuration is a way to set how to start thedebug
mode in the form of a configuration file. It provides more configuration to meet the needs of running and debugging. Complex application
3.1 Properties of launch configuration
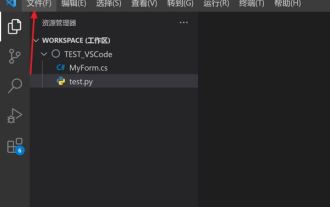
This configuration file is located in.vscode/launch.json in the current workspace directory
, you can create one manually, or quickly create one throughvscode

and then selectnode
That’s it
Required attributes
##Required attributes, the most modified ones should bename, the other two are in
nodeand generally will not be modified.
| Meaning | Attribute value example | |||||||||||||||||||||||||||||||||||
|---|---|---|---|---|---|---|---|---|---|---|---|---|---|---|---|---|---|---|---|---|---|---|---|---|---|---|---|---|---|---|---|---|---|---|---|---|
| Debugger type, can also be considered as debugging language | node => pwa-node | , chrome => pwa-chrome | ##request||||||||||||||||||||||||||||||||||
| debug | mode has only two values | : start, attach: attach | name||||||||||||||||||||||||||||||||||
| Customized, just understand it yourself, for your own use |
| 属性 | 含义 |
|---|---|
| outFiles | 指定Source maps文件所在路径 |
| resolveSourceMapLocations | 也是指定与Source maps相关的路径 |
| timeout | 附加的超时时间, 超时就放弃 |
| stopOnEntry | 项目启动起来, 立即debugger一下, 就是相当于在代码的第一行加了一个debugger |
| localRoot | 这个是用来远程调试用的, 我就先不了解它了... |
| remoteRoot | 这个是用来远程调试用的, 我就先不了解它了... |
| smartStep | 自动跳过没有映射到的源文件 |
| skipFiles | 指定单步跳过的文件, 就是debugger不跟进去看的源代码 |
| trace | 开启会将一些调试输出保存到vscode指定的文件中 |
skipFiles
(这个挺有用的, 有些代码不想跟进去看, 但是经常点快了, 就进去了..., 可以把这些文件排除掉,
<node_internals>/**/*.js配置上这个, 可以跳过node核心模块的代码.)
trace
开启
trace后
launch支持的属性
| 属性 | 含义 |
|---|---|
| program | 启动项目的入口文件地址(就是要执行的js的路径) |
| args | 相当于命令行参数(下面有详解) |
| cwd | 指定程序启动的路径(下面有详解) |
| runtimeExecutable | 指定可执行程序的启动路径(下面有详解) |
| runtimeArgs | 给可执行程序的参数(下面有详解) |
| env | 指定环境变量(下面有详解) |
args
"args": ["aaa", "bbb"]:在命令行传递参数的方式, 在node中可以通过process.argv拿到
cwd
"cwd": "${workspaceFolder}/demo", 配置这个路径, 在node中, 相当于指定了process.cwd()的路径
runtimeExecutable
这个可以指定启动的程序名, 比如使用
nodemon启动, 或者指定路径, 比如你有3个版本的node想启动调试看看各个版本的差异, 就不需要切换全局的node版本, 只需要设置多个配置项就行啦. 这样很方便的.
{
  "version": "0.2.0",
  "configurations": [
    {
      "name": "v10 版本启动",
      "program": "${workspaceFolder}/demo.js",
      "request": "launch",
      "type": "pwa-node",
      "runtimeExecutable": "C:\\Program Files\\nodejsv10\\node.js" // 这里是 v10 版本的node路径
    },
    {
      "name": "v11 版本启动",
      "program": "${workspaceFolder}/demo.js",
      "request": "launch",
      "type": "pwa-node",
      "runtimeExecutable": "C:\\Program Files\\nodejsv11\\node.js" // 这里是 v11 版本的node路径
    },
    {
      "name": "v12 版本启动",
      "program": "${workspaceFolder}/demo.js",
      "request": "launch",
      "type": "pwa-node",
      "runtimeExecutable": "C:\\Program Files\\nodejsv12\\node.js" // 这里是 v12 版本的node路径
    }
  ]
}runtimeArgs
这个里面写的参数会紧跟在可执行程序后面, 在
node程序中,node会将它后面的第一个参数视为它要执行的文件的路径, 所以需要有所调整.
{
  "version": "0.2.0",
  "configurations": [
    {
      "name": "v10 版本启动",
      "program": "${workspaceFolder}/demo.js", // 这个现在已经不是 node 的执行文件地址了, 它只是一个参数了
      "request": "launch",
      "type": "pwa-node",
      "args": ["args1", "args2"],
      "runtimeArgs": ["${workspaceFolder}/demo.js", "runtimeArgs2"] // 因为它紧跟在 可执行程序后面, 所以它的第一个参数需要设置为它要执行的文件的地址
      // 如果它是 --experimental-modules 类型参数就没事了, 因为node会把它解析成参数, 这个参数的含义是 启动 es 模块支持. 接下来我会写一篇 js 的模块化的文章, 敬请期待哈
    }
  ]
}
// 启动的命令行是
// C:\Program Files\nodejs\node.exe E:\font-end/demo.js runtimeArgs2 .\demo.js args1 args2
这个参数在弄成
npm启动项目的时候, 比较有用
env
{
  "version": "0.2.0",
  "configurations": [
    {
      "name": "v10 版本启动",
      "program": "${workspaceFolder}/demo.js",
      "request": "launch",
      "type": "pwa-node",
      "env": {
        "NODE_ENV": "prod"
      }
    }
  ]
}
attach支持的属性
我们常用的是
launch方式启动, 就先不了解attach的方式启动了.
总结
对于如何在
vscode中启动debug模式, 应该是比较清楚的了
在
vscode中, 一共有三种方式启动debug调试, 分别是
自动附加(影响全局的终端), 如果对自己电脑性能有自信, 设置为
always. 命令行运行进入debug模式.强制开启(只影响这一个终端), 如果不方便配置开启全局的自动
debug, 使用这种方式进入debug, 也是比较放便的, 就是重新开启这个debug终端之后, 需要cd到需要运行的js文件目录, 比较麻烦. 命令行运行进入debug模式.配置开启(功能强大, 适合调试复杂应用),配置好
.vscode/launch.json后,f5启动进入debug模式
// 比较完整一个 launch.json 配置
{
  // 使用 IntelliSense 了解相关属性。
  // 悬停以查看现有属性的描述。
  // 欲了解更多信息,请访问: https://go.microsoft.com/fwlink/?linkid=830387
  "version": "0.2.0",
  "configurations": [
    {
      "name": "v10 版本启动", // 配置名称
      "program": "${workspaceFolder}/demo.js", // 项目启动入口文件
      "request": "launch", // `debug`模式的请求方式
      "stopOnEntry": true, // 项目启动, 立即`debugger`一下
      "type": "pwa-node", // 调试器类型
      "env": {
        // 环境变量
        "NODE_ENV": "prod"
      },
      "args": ["aaaa"], // 启动命令时跟在 program 后的参数
      "skipFiles": [
        // 指定单步调试不进去的文件
        "<node_internals>/**" // node 的核心库, 比如`require`
      ],
      "cwd": "${workspaceFolder}", // 指定可执行程序的启动路径, process.cwd(),
      "runtimeExecutable": "nodemon", // 指定可执行程序名称, 或者路径, 在这里 type 为 pwa-node 默认值是 node
      "runtimeArgs": ["--experimental-modules"] // 启动命令时, 跟在 runtimeExecutable 后的参数
    }
  ]
}最后
这里已经有三个坑了, 模块化,调试技巧, vscode插件开发, 我目前更想先写一个vscode插件,敬请期待.
感觉这篇文章能改到你启发的, 希望给个点赞, 评论, 收藏, 关注...
更多编程相关知识,请访问:编程视频!!
The above is the detailed content of How to enable debugging mode in VSCode? Brief analysis of three methods. For more information, please follow other related articles on the PHP Chinese website!

Hot AI Tools

Undresser.AI Undress
AI-powered app for creating realistic nude photos

AI Clothes Remover
Online AI tool for removing clothes from photos.

Undress AI Tool
Undress images for free

Clothoff.io
AI clothes remover

AI Hentai Generator
Generate AI Hentai for free.

Hot Article
Hot Tools

Notepad++7.3.1
Easy-to-use and free code editor

SublimeText3 Chinese version
Chinese version, very easy to use

Zend Studio 13.0.1
Powerful PHP integrated development environment

Dreamweaver CS6
Visual web development tools

SublimeText3 Mac version
God-level code editing software (SublimeText3)
Hot Topics
 1377
1377
 52
52

 How to view word documents in vscode How to view word documents in vscode
May 09, 2024 am 09:37 AM
How to view word documents in vscode How to view word documents in vscode
May 09, 2024 am 09:37 AM
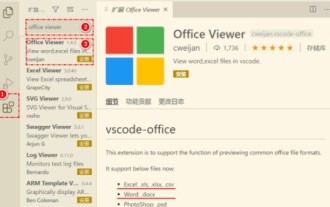
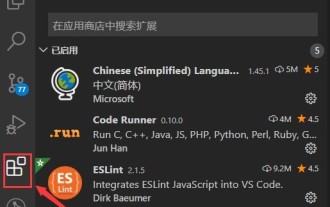
First, open the vscode software on the computer, click the [Extension] icon on the left, as shown in ① in the figure. Then, enter [officeviewer] in the search box of the extension interface, as shown in ② in the figure. Then, from the search Select [officeviewer] to install in the results, as shown in ③ in the figure. Finally, open the file, such as docx, pdf, etc., as shown below
 How to draw a flow chart with vscode_How to draw a flow chart with visual_studio code
Apr 23, 2024 pm 02:13 PM
How to draw a flow chart with vscode_How to draw a flow chart with visual_studio code
Apr 23, 2024 pm 02:13 PM
First, open visual studio code on the computer, click the four square buttons on the left, then enter draw.io in the search box to query the plug-in, click Install. After installation, create a new test.drawio file, then select the test.drawio file, enter the editing mode on the left There are various graphics on the side. You can draw the flow chart by selecting at will. After drawing, click File → Embed → svg and then select Embed. Copy the svg code. Paste the copied svg code into the html code. Open the html web page and you can see it. Click on the picture on the web page to jump to the flow chart. On this page, you can zoom in and out of the flow chart. Here, we choose to click on the pencil pattern in the lower right corner to jump to the web page.
 Caltech Chinese use AI to subvert mathematical proofs! Speed up 5 times shocked Tao Zhexuan, 80% of mathematical steps are fully automated
Apr 23, 2024 pm 03:01 PM
Caltech Chinese use AI to subvert mathematical proofs! Speed up 5 times shocked Tao Zhexuan, 80% of mathematical steps are fully automated
Apr 23, 2024 pm 03:01 PM
LeanCopilot, this formal mathematics tool that has been praised by many mathematicians such as Terence Tao, has evolved again? Just now, Caltech professor Anima Anandkumar announced that the team released an expanded version of the LeanCopilot paper and updated the code base. Image paper address: https://arxiv.org/pdf/2404.12534.pdf The latest experiments show that this Copilot tool can automate more than 80% of the mathematical proof steps! This record is 2.3 times better than the previous baseline aesop. And, as before, it's open source under the MIT license. In the picture, he is Song Peiyang, a Chinese boy. He is
 How to add files to vscode workspace How to add files to vscode workspace
May 09, 2024 am 09:43 AM
How to add files to vscode workspace How to add files to vscode workspace
May 09, 2024 am 09:43 AM
1. First, open the vscode software, click the explorer icon, and find the workspace window 2. Then, click the file menu in the upper left corner and find the add folder to workspace option 3. Finally, find the folder location in the local disk , click the add button
 How to enable background updates in vscode How to enable background updates in vscode
May 09, 2024 am 09:52 AM
How to enable background updates in vscode How to enable background updates in vscode
May 09, 2024 am 09:52 AM
1. First, after opening the interface, click the file menu in the upper left corner. 2. Then, click the settings button in the preferences column. 3. Then, in the settings page that jumps, find the update section. 4. Finally, click the mouse to check and enable it. Download and install the new VSCode version button in the background on Windows and restart the program.
 How to disable wsl configuration file in vscode How to disable wsl configuration file in vscode
May 09, 2024 am 10:30 AM
How to disable wsl configuration file in vscode How to disable wsl configuration file in vscode
May 09, 2024 am 10:30 AM
1. First, open the settings option in the settings menu. 2. Then, find the terminal column in the commonly used page. 3. Finally, uncheck the usewslprofiles button on the right side of the column.
 How to set animation smooth insertion in VScode VScode tutorial to set animation smooth insertion
May 09, 2024 am 09:49 AM
How to set animation smooth insertion in VScode VScode tutorial to set animation smooth insertion
May 09, 2024 am 09:49 AM
1. First, after opening the interface, click the workspace interface 2. Then, in the open editing panel, click the File menu 3. Then, click the Settings button under the Preferences column 4. Finally, click the mouse to check the CursorSmoothCaretAnimation button and save Just set it
 How to open workspace trust permissions in Vscode Vscode method to open workspace trust permissions
May 09, 2024 am 10:34 AM
How to open workspace trust permissions in Vscode Vscode method to open workspace trust permissions
May 09, 2024 am 10:34 AM
1. First, after opening the editing window, click the configuration icon in the lower left corner 2. Then, click the Manage Workspace Trust button in the submenu that opens 3. Then, find the page in the editing window 4. Finally, according to your office Just check the relevant instructions if required
