Let's talk about two ways to debug Node.js code
How to debug your Node code? The following article will introduce to you two common ways to debug Node.js. It has certain reference value and I hope it will be helpful to you!
Many times, I worry about debugging Node.js and only use the intrusive method of console.log, but in fact Node.js can also be as convenient as browser debugging.
Environment of this article:
mac
Chrome 94.0.4606.81
node v12.12.0
vscode Version: 1.61.1
Example of this article
The example of this article uses the onion model that was previously explored. There is only one file, which is index.js in the root directory. , as follows:
const Koa = require('koa');

const app = new Koa();
console.log('test')

// 中间件1
app.use((ctx, next) => {
  console.log(1);
  next();
  console.log(2);
});

// 中间件 2
app.use((ctx, next) => {
  console.log(3);
  next();
  console.log(4);
});

app.listen(9000, () => {
    console.log(`Server is starting`);
});V8 Inspector Protocol Chrome DevTools
v8 Inspector Protocol is a newly added debugging protocol in nodejs v6.3, which interacts with Client/IDE through websocket, and at the same time Devtools based on Chrome/Chromium browser provides a graphical debugging interface.
We enter the project root directory and execute (note the 8888 port, which will be used later):
node --inspect=8888 index.js
The results are as follows:
The result is a link——ws://127.0.0.1:8888/5f5c59fc-d42b-4ab0-be15-6feb1a05ed2d. This link is the websocket address that Node.js and Chrome used to communicate before. Through websocket communication, we can see the results of Node.js in Chrome in real time.
How to enter Chrome’s debugging interface
The first way (try it yourself is invalid)
Openhttp://localhost:8888 /json/list, where 8888 is the parameter of --inspect above.
[
    {
        "description": "node.js instance",
        "devtoolsFrontendUrl": "chrome-devtools://devtools/bundled/js_app.html?experiments=true&v8only=true&ws=localhost:8888/5f5c59fc-d42b-4ab0-be15-6feb1a05ed2d",
        "devtoolsFrontendUrlCompat": "chrome-devtools://devtools/bundled/inspector.html?experiments=true&v8only=true&ws=localhost:8888/5f5c59fc-d42b-4ab0-be15-6feb1a05ed2d",
        "faviconUrl": "https://nodejs.org/static/images/favicons/favicon.ico",
        "id": "5f5c59fc-d42b-4ab0-be15-6feb1a05ed2d",
        "title": "index.js",
        "type": "node",
        "url": "file:///Users/gpingfeng/Documents/Personal/Test/test-onion/index.js",
        "webSocketDebuggerUrl": "ws://localhost:8888/5f5c59fc-d42b-4ab0-be15-6feb1a05ed2d"
    }
]A lot of information says that it can be accessed directly through devtoolsFrontendUrl, but I tried it and it didn't work. [Maybe related to my environment]
Second method
I checked the information and found the corresponding solution in stackoverflow, as follows:
devtools://devtools/bundled/inspector.html?experiments=true&ws=127.0.0.1:8888/5f5c59fc-d42b-4ab0-be15-6feb1a05ed2d
devtools://devtools/bundled/inspector.html?experiments=true is fixed, and the ws parameter corresponds to the websocket address.
You can see the interface as follows:

The third method
Chrome browser opens the HTTP listening interface Page, open the dev tool, and after executing node --inspect=8888 index.js, you can see this icon, click on it:

The same debugging page as the browser appears, such as Sources Panel to view scripts, Profile Panel to monitor performance, etc.

In addition, you can visit chrome://inspect/#devices and you can see all the inspects currently monitored by the browser.

Vscode debugging
In addition to browsers, all major IDEs support Node.js debugging. This article takes Vscode as an example.
Launch Configuration
Open the debugging page and add a launch configuration to our Node project:

Select Node.js

This will generate the corresponding file .vscode/launch.json (of course you can also create it manually) in the project root directory, where program refers to the file entry, ${workspaceFolder} refers to the root directory.
{
  // Use IntelliSense to learn about possible attributes.
  // Hover to view descriptions of existing attributes.
  // For more information, visit: https://go.microsoft.com/fwlink/?linkid=830387
  "version": "0.2.0",
  "configurations": [
    {
      "type": "pwa-node",
      "request": "launch",
      "name": "Launch Program",
      "skipFiles": [
        "<node_internals>/**"
      ],
      "program": "${workspaceFolder}/index.js"
    }
  ]
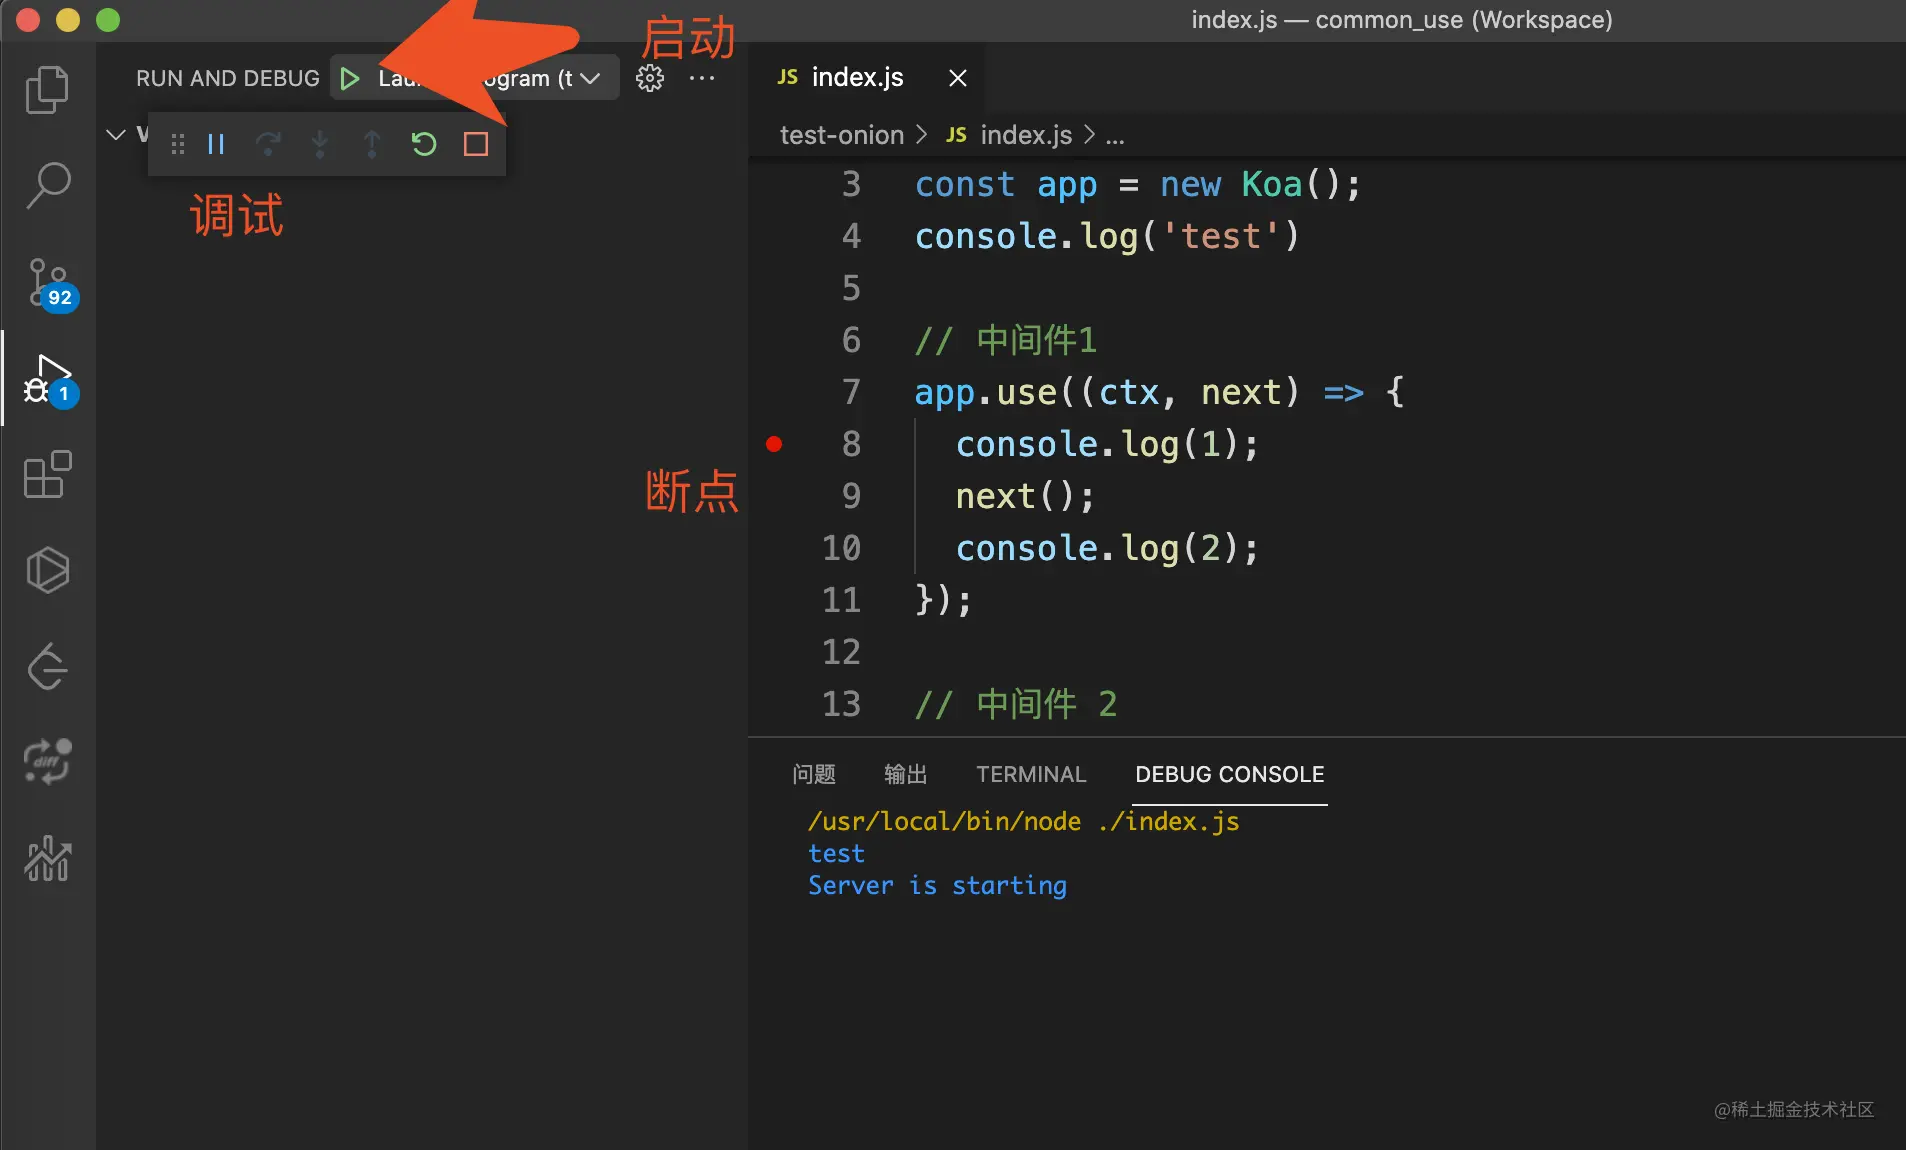
}Press F5, or click the following button:

The result:
You can see , you can display the value of the current scope, call stack and other information on the left side, and you can also gradually debug functions, restart and other functions on the upper right side, which is very powerful.
Attach to Node Process Action
With Attach to Node Process Action, we can directly debug the running Node.js process.
For example, let’s start the project first——npm run start.
Thencommand shift p (window Ctrl Shift p), enter Attach to Node Process Action, press Enter, and then select the running process Press Enter again and you can debug the code as configured above.
Summary
This article summarizes two common ways to debug Node.js. The first Node.js transmits information to the Chrome browser through websocket, and we debug directly in Chrome. The second is to debug through Vscode Launch Configuration and custom configuration. Through Attach to Node Process Action, you can conveniently debug the running Node.js code without configuration.
For more node-related knowledge, please visit: nodejs tutorial! !
The above is the detailed content of Let's talk about two ways to debug Node.js code. For more information, please follow other related articles on the PHP Chinese website!

Hot AI Tools

Undresser.AI Undress
AI-powered app for creating realistic nude photos

AI Clothes Remover
Online AI tool for removing clothes from photos.

Undress AI Tool
Undress images for free

Clothoff.io
AI clothes remover

AI Hentai Generator
Generate AI Hentai for free.

Hot Article

Hot Tools

Notepad++7.3.1
Easy-to-use and free code editor

SublimeText3 Chinese version
Chinese version, very easy to use

Zend Studio 13.0.1
Powerful PHP integrated development environment

Dreamweaver CS6
Visual web development tools

SublimeText3 Mac version
God-level code editing software (SublimeText3)

Hot Topics
 1378
1378
 52
52
 An article about memory control in Node
Apr 26, 2023 pm 05:37 PM
The Node service built based on non-blocking and event-driven has the advantage of low memory consumption and is very suitable for handling massive network requests. Under the premise of massive requests, issues related to "memory control" need to be considered. 1. V8’s garbage collection mechanism and memory limitations Js is controlled by the garbage collection machine
 Detailed graphic explanation of the memory and GC of the Node V8 engine
Mar 29, 2023 pm 06:02 PM
This article will give you an in-depth understanding of the memory and garbage collector (GC) of the NodeJS V8 engine. I hope it will be helpful to you!
 Let's talk about how to choose the best Node.js Docker image?
Dec 13, 2022 pm 08:00 PM
Choosing a Docker image for Node may seem like a trivial matter, but the size and potential vulnerabilities of the image can have a significant impact on your CI/CD process and security. So how do we choose the best Node.js Docker image?
 Let's talk in depth about the File module in Node
Apr 24, 2023 pm 05:49 PM
The file module is an encapsulation of underlying file operations, such as file reading/writing/opening/closing/delete adding, etc. The biggest feature of the file module is that all methods provide two versions of **synchronous** and **asynchronous**, with Methods with the sync suffix are all synchronization methods, and those without are all heterogeneous methods.
 Node.js 19 is officially released, let's talk about its 6 major features!
Nov 16, 2022 pm 08:34 PM
Node 19 has been officially released. This article will give you a detailed explanation of the 6 major features of Node.js 19. I hope it will be helpful to you!
 Let's talk about the GC (garbage collection) mechanism in Node.js
Nov 29, 2022 pm 08:44 PM
How does Node.js do GC (garbage collection)? The following article will take you through it.
 Let's talk about the event loop in Node
Apr 11, 2023 pm 07:08 PM
The event loop is a fundamental part of Node.js and enables asynchronous programming by ensuring that the main thread is not blocked. Understanding the event loop is crucial to building efficient applications. The following article will give you an in-depth understanding of the event loop in Node. I hope it will be helpful to you!
 What should I do if node cannot use npm command?
Feb 08, 2023 am 10:09 AM
The reason why node cannot use the npm command is because the environment variables are not configured correctly. The solution is: 1. Open "System Properties"; 2. Find "Environment Variables" -> "System Variables", and then edit the environment variables; 3. Find the location of nodejs folder; 4. Click "OK".


