
 Operation and Maintenance
Linux Operation and Maintenance
Detailed analysis of top command parameters in Linux
Operation and Maintenance
Linux Operation and Maintenance
Detailed analysis of top command parameters in Linux
Detailed analysis of top command parameters in Linux

This article brings you knowledge about the top command in Linux, including the usage of the top command and the meaning of each output parameter. I hope it will be helpful to you.

top command usage
The top command is often used to monitor the system status of Linux. It is a commonly used performance analysis tool that can display the status of each process in the system in real time. Resource usage.
How to use top top [-d number] | top [-bnp]
Parameter explanation:
-d: number represents the number of seconds, indicating the number displayed by the top command The interval between page updates. The default is 5 seconds. -b: Execute top in batch mode. -n: used in conjunction with -b, indicates that the output results of the top command need to be performed several times. -p: Specify a specific pid process number for observation.
On the page displayed by the top command, you can also enter the following keys to perform the corresponding functions (note that they are case-sensitive):
?: Display the commands that can be entered in top. P: Use the CPU's Sort by resource usage and display M: Sort by memory resource usage and display N: Sort by pid and display T: Sort by accumulated time used by the process and display k: Give a signal to a certain pid. Can be used to kill the process r: re-customize a nice value (i.e. priority) for a certain pid q: exit top (you can also exit top with ctrl c).
The meaning of each output parameter of top
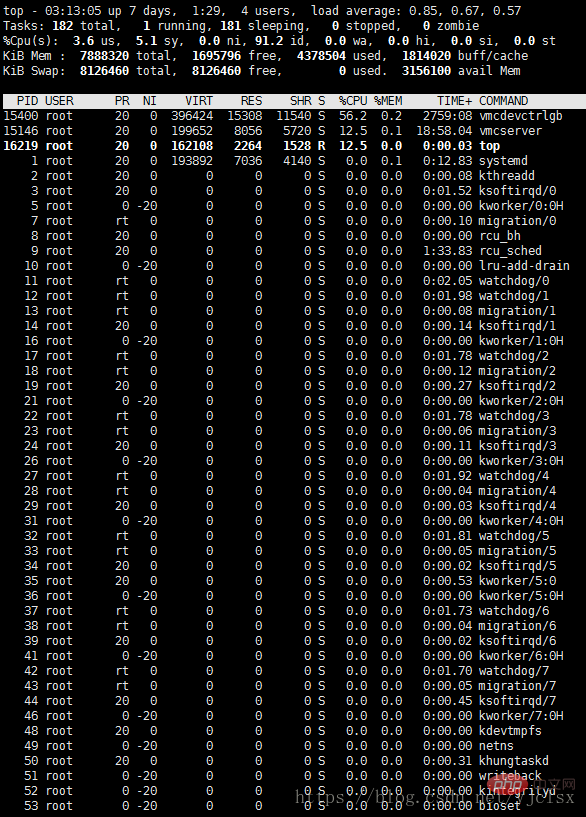
The following is a screenshot of using the top command to perform performance testing:
Figure 1 (ubuntu):
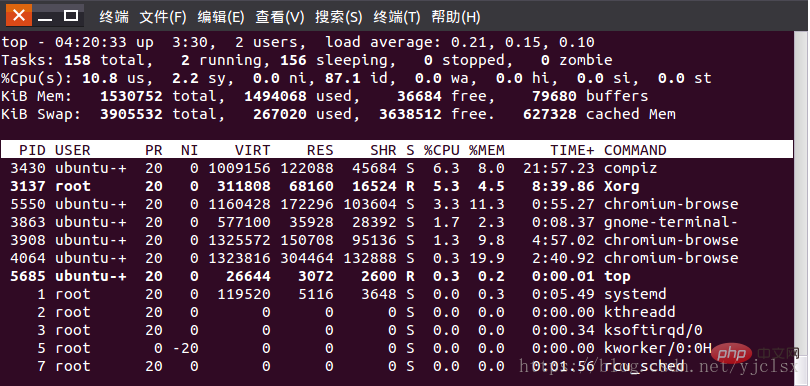
Figure 2 (centos):
1. Statistical information of the first 5 rows of top
Row 1: top - 05:43:27 up 4:52, 2 users, load average: 0.58, 0.41, 0.30
The first line is the task queue information, its parameters are as follows:
| Content | Meaning |
|---|---|
| represents the current time | |
| The system running time format is hours: minutes | |
| Number of currently logged in users | |
| System load, that is, the average length of the task queue. The three values are the average values from 1 minute, 5 minutes, and 15 minutes ago to now. |
Line 2: Tasks: 159 total, 1 running, 158 sleeping, 0 stopped, 0 zombie
Line 3: %Cpu(s): 37.0 us , 3.7 sy, 0.0 ni, 59.3 id, 0.0 wa, 0.0 hi, 0.0 si, 0.0 st
The 2nd and 3rd lines are process and CPU information When there are multiple CPUs, these contents may There will be more than two lines, and the parameters are as follows:
| 1 running | |
| 158 sleeping | |
| 0 stopped | |
| 0 zombie | |
| 37.0 us | |
| 3.7 sy | |
| CPU percentage occupied by processes that have changed priorities in the user process space | 59.3 id |
| 0.0 wa | |
| Percentage of CPU occupied by Hardware IRQ | |
| Percentage of CPU occupied by software interrupts | ##0.0 st |
| Line 4: KiB Mem: 1530752 total, 1481968 used, 48784 free, 70988 buffers |
The 4th and 5th lines are memory information
The parameters are as follows:
##Content
| KiB Mem: 1530752 total | ||||||||||||||||||||||||||||||||||||||||||||||||||||||
|---|---|---|---|---|---|---|---|---|---|---|---|---|---|---|---|---|---|---|---|---|---|---|---|---|---|---|---|---|---|---|---|---|---|---|---|---|---|---|---|---|---|---|---|---|---|---|---|---|---|---|---|---|---|---|
| 1481968 used | Physical used Total memory | |||||||||||||||||||||||||||||||||||||||||||||||||||||
| 48784 free | Total free memory | |||||||||||||||||||||||||||||||||||||||||||||||||||||
| 70988 buffers(buff/cache) | Amount of memory used for kernel cache | |||||||||||||||||||||||||||||||||||||||||||||||||||||
| KiB Swap: 3905532 total | Total amount of swap area | |||||||||||||||||||||||||||||||||||||||||||||||||||||
| 267544 used | Total amount of swap area used | |||||||||||||||||||||||||||||||||||||||||||||||||||||
| 3637988 free | Total amount of free swap area | |||||||||||||||||||||||||||||||||||||||||||||||||||||
| 617312 cached Mem | The total amount of cached swap area. | |||||||||||||||||||||||||||||||||||||||||||||||||||||
| 3156100 avail Mem | Represents the amount of physical memory available for the next allocation of the process | |||||||||||||||||||||||||||||||||||||||||||||||||||||
| Column name | Meaning |
|---|---|
| PID | Process id |
| PPID | Parent process id |
| RUSER | Real user name |
| UID | User ID of the process owner |
| USER | Username of the process owner |
| GROUP | Group name of the process owner |
| TTY | Terminal name for starting the process. Processes that are not started from the terminal are displayed as? |
| PR | Priority |
| NI | nice value. Negative values indicate high priority, positive values indicate low priority |
| P | The last CPU used is only meaningful in a multi-CPU environment |
| %CPU | CPU time usage percentage since last update |
| TIME | Total CPU time used by the process , unit second |
| TIME | Total CPU time used by the process, unit 1/100 second |
| %MEM | Percentage of physical memory used by the process |
| VIRT | The total amount of virtual memory used by the process, in kb. VIRT=SWAP RES |
| SWAP | The size of the virtual memory used by the process that is swapped out, unit kb |
| RES | The size of the physical memory used by the process and not swapped out, in kb. RES=CODE DATA |
| CODE | The physical memory size occupied by the executable code, unit kb |
| DATA | The physical memory size occupied by parts other than the executable code (data segment stack), unit kb |
| SHR | Shared memory size, unit kb |
| nFLT | Number of page errors |
| nDRT | The page that has been modified since the last time it was written number. |
| S | Process status. D=uninterruptible sleep state R=run S=sleep T=track/stop Z=zombie process |
| COMMAND | Command name/command line |
| WCHAN | If the process is sleeping, the name of the system function in sleep is displayed |
| Flags | Task flag |
Others
When entering top by default, the processes are sorted according to CPU usage.
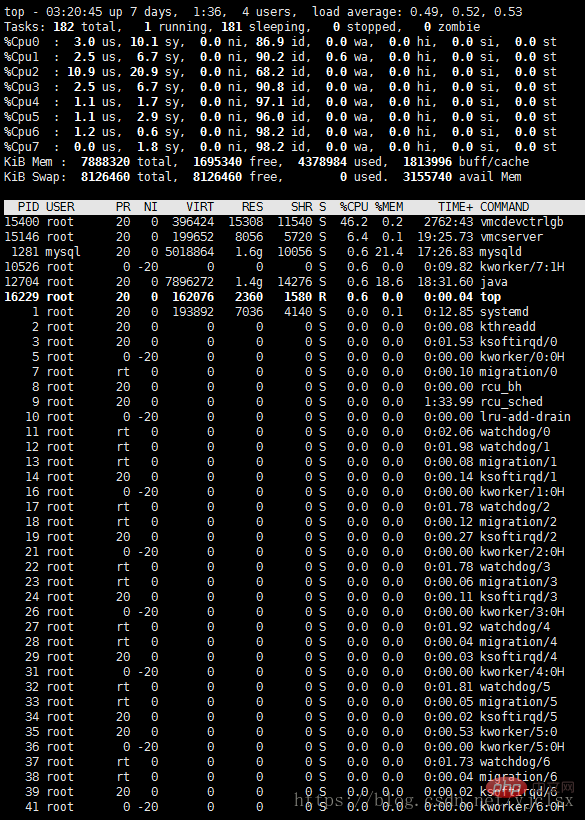
1. In the top basic view, press the keyboard number "1" to monitor the status of each logical CPU:
2. Press the keyboard 'b' ( Turn on and off the highlighting effect) The top view changes as follows:
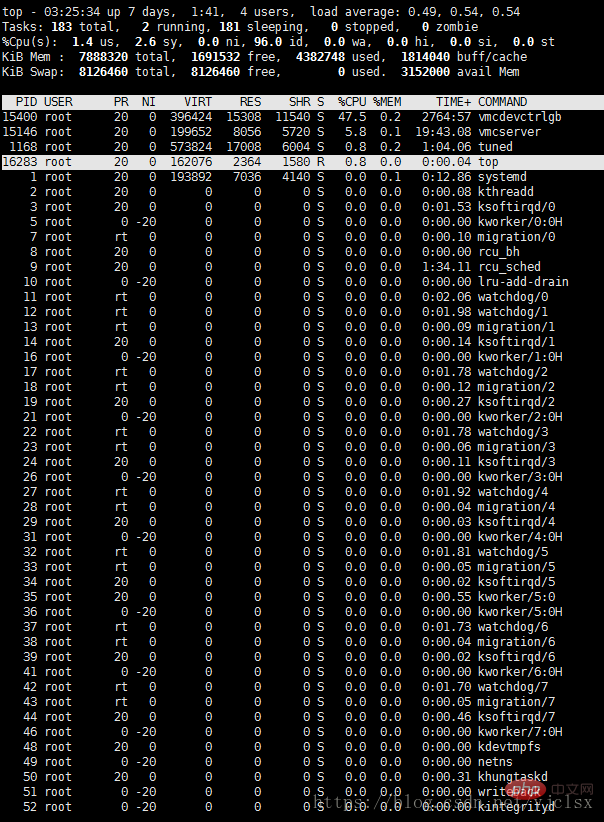
PID 16283 is the only running process in the current top view. You can also press 'y' on the keyboard to turn on or off the highlighting effect of running processes.
3. Press 'x' on the keyboard (turn on/off the highlighting effect of the sort column), the top view changes as follows:
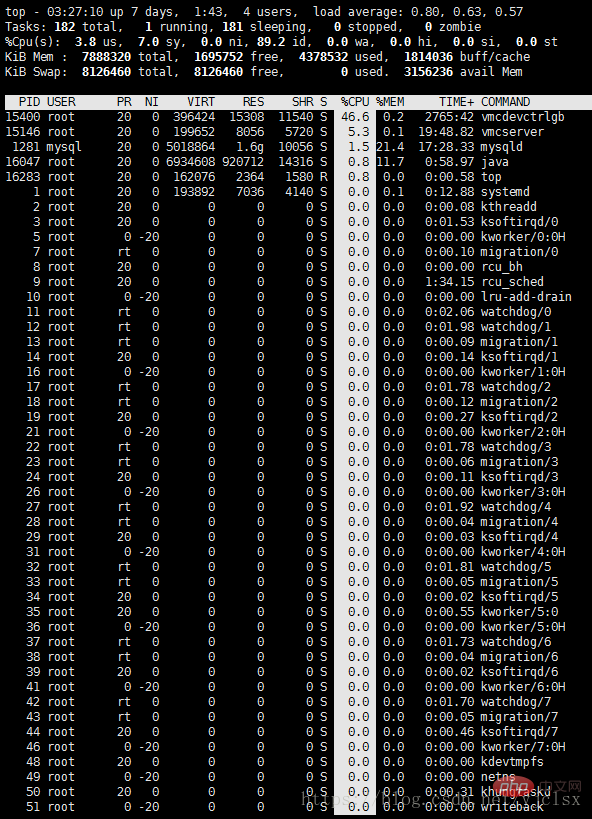
You can see now It is sorted by "%CPU". You can press "shift >" or "shift <" to change the sorting sequence.
4. Change the process display field
In the top basic view, tap "f" to enter another view, where you can edit the display fields in the basic view:
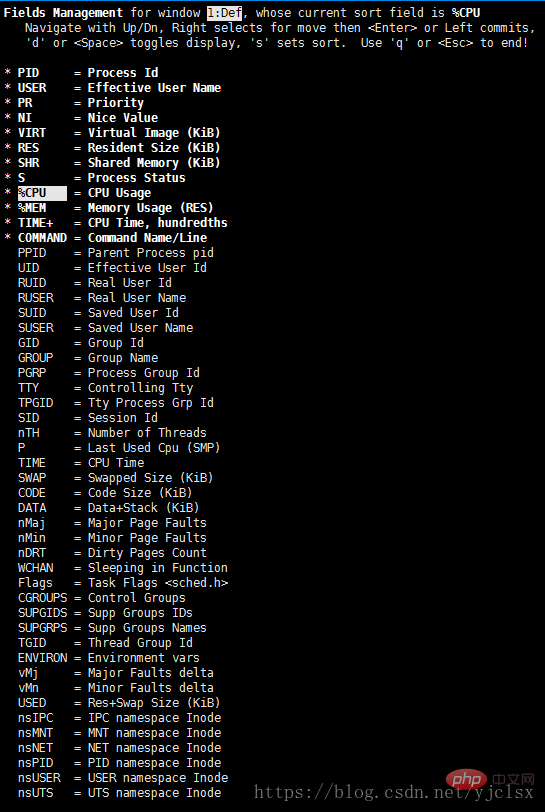
Use the up and down keys to select an option, and press the space bar to decide whether to display this option in the basic view.
The top command is a very powerful function, but the smallest unit it monitors is a process. If you want to monitor a smaller unit, you need to use the ps or netstate command to meet our requirements.
Related recommendations: "Linux Video Tutorial"
The above is the detailed content of Detailed analysis of top command parameters in Linux. For more information, please follow other related articles on the PHP Chinese website!

Hot AI Tools

Undresser.AI Undress
AI-powered app for creating realistic nude photos

AI Clothes Remover
Online AI tool for removing clothes from photos.

Undress AI Tool
Undress images for free

Clothoff.io
AI clothes remover

Video Face Swap
Swap faces in any video effortlessly with our completely free AI face swap tool!

Hot Article
Hot Tools

Notepad++7.3.1
Easy-to-use and free code editor

SublimeText3 Chinese version
Chinese version, very easy to use

Zend Studio 13.0.1
Powerful PHP integrated development environment

Dreamweaver CS6
Visual web development tools

SublimeText3 Mac version
God-level code editing software (SublimeText3)
Hot Topics
 1392
1392
 52
52

 How to view the docker process
Apr 15, 2025 am 11:48 AM
How to view the docker process
Apr 15, 2025 am 11:48 AM
Docker process viewing method: 1. Docker CLI command: docker ps; 2. Systemd CLI command: systemctl status docker; 3. Docker Compose CLI command: docker-compose ps; 4. Process Explorer (Windows); 5. /proc directory (Linux).
 What computer configuration is required for vscode
Apr 15, 2025 pm 09:48 PM
What computer configuration is required for vscode
Apr 15, 2025 pm 09:48 PM
VS Code system requirements: Operating system: Windows 10 and above, macOS 10.12 and above, Linux distribution processor: minimum 1.6 GHz, recommended 2.0 GHz and above memory: minimum 512 MB, recommended 4 GB and above storage space: minimum 250 MB, recommended 1 GB and above other requirements: stable network connection, Xorg/Wayland (Linux)
 vscode cannot install extension
Apr 15, 2025 pm 07:18 PM
vscode cannot install extension
Apr 15, 2025 pm 07:18 PM
The reasons for the installation of VS Code extensions may be: network instability, insufficient permissions, system compatibility issues, VS Code version is too old, antivirus software or firewall interference. By checking network connections, permissions, log files, updating VS Code, disabling security software, and restarting VS Code or computers, you can gradually troubleshoot and resolve issues.
 Can vscode be used for mac
Apr 15, 2025 pm 07:36 PM
Can vscode be used for mac
Apr 15, 2025 pm 07:36 PM
VS Code is available on Mac. It has powerful extensions, Git integration, terminal and debugger, and also offers a wealth of setup options. However, for particularly large projects or highly professional development, VS Code may have performance or functional limitations.
 What is vscode What is vscode for?
Apr 15, 2025 pm 06:45 PM
What is vscode What is vscode for?
Apr 15, 2025 pm 06:45 PM
VS Code is the full name Visual Studio Code, which is a free and open source cross-platform code editor and development environment developed by Microsoft. It supports a wide range of programming languages and provides syntax highlighting, code automatic completion, code snippets and smart prompts to improve development efficiency. Through a rich extension ecosystem, users can add extensions to specific needs and languages, such as debuggers, code formatting tools, and Git integrations. VS Code also includes an intuitive debugger that helps quickly find and resolve bugs in your code.
 How to run java code in notepad
Apr 16, 2025 pm 07:39 PM
How to run java code in notepad
Apr 16, 2025 pm 07:39 PM
Although Notepad cannot run Java code directly, it can be achieved by using other tools: using the command line compiler (javac) to generate a bytecode file (filename.class). Use the Java interpreter (java) to interpret bytecode, execute the code, and output the result.
 What is the main purpose of Linux?
Apr 16, 2025 am 12:19 AM
What is the main purpose of Linux?
Apr 16, 2025 am 12:19 AM
The main uses of Linux include: 1. Server operating system, 2. Embedded system, 3. Desktop operating system, 4. Development and testing environment. Linux excels in these areas, providing stability, security and efficient development tools.
 vscode Previous Next Shortcut Key
Apr 15, 2025 pm 10:51 PM
vscode Previous Next Shortcut Key
Apr 15, 2025 pm 10:51 PM
VS Code One-step/Next step shortcut key usage: One-step (backward): Windows/Linux: Ctrl ←; macOS: Cmd ←Next step (forward): Windows/Linux: Ctrl →; macOS: Cmd →
