
 Operation and Maintenance
Linux Operation and Maintenance
Let me summarize for you how to check the status of memory, disk, CPU and network in Linux
Operation and Maintenance
Linux Operation and Maintenance
Let me summarize for you how to check the status of memory, disk, CPU and network in Linux
Let me summarize for you how to check the status of memory, disk, CPU and network in Linux

This article brings you relevant knowledge about how to check the memory, disk, cpu and network io in Linux. I hope it will be helpful to you.

Today’s focus:
① Learn to check various statuses of Linux, including: network IO, disk, CPU, memory, etc.;
② Learn to understand the meaning of commands and quickly discover problems in the cluster.
1. Core commands
linux monitors network IO, disk, CPU, memory:
- CPU: vmstat, sar –u, top
- Disk IO: iostat –xd, sar –d, top
- Network IO: iftop -n, ifstat, dstat –nt, sar -n DEV 2 3
- Disk capacity: df –h
- Memory usage: free –m, top
2. Commonly used commands
(1) Memory : number of strips, size of each strip, whether the memory is DDR4 or DDR3, memory Is the frequency 2666MT/S or 1600MT/s
number of entries: dmidecode|grep -A5 'Memory Device'|grep Size | grep -v Installed |wc -l
Size of each item: dmidecode|grep -A5 'Memory Device'|grep Size | grep -v Installed |uniq
Memory type: dmidecode | grep -A16 "Memory Device" | grep 'Type:' | grep -v Unknown | uniq
Memory frequency: dmidecode | grep -A16 "Memory Device" | grep 'Speed' | grep -v Unknown |uniq
(2) Hard disk: number of blocks, size
fdisk -l | grep "Disk /dev/sd"
(3) Check what process occupies the port
netstat -antp | fgrep
(4) Check the process resources
- jps -l # Get the process id
- jmap -heap 21046
(5) Number of CPUs
cat / proc/cpuinfo| grep "physical id"| sort| uniq| wc -l
(6)CPU core number
cat /proc/cpuinfo| grep "cpu cores"| uniq
(7) CPU frequency
cat /proc/cpuinfo| grep "model name"| uniq
3. Detailed explanation of core commands
3.1. ps aux
ps command is used to view the process status in the system
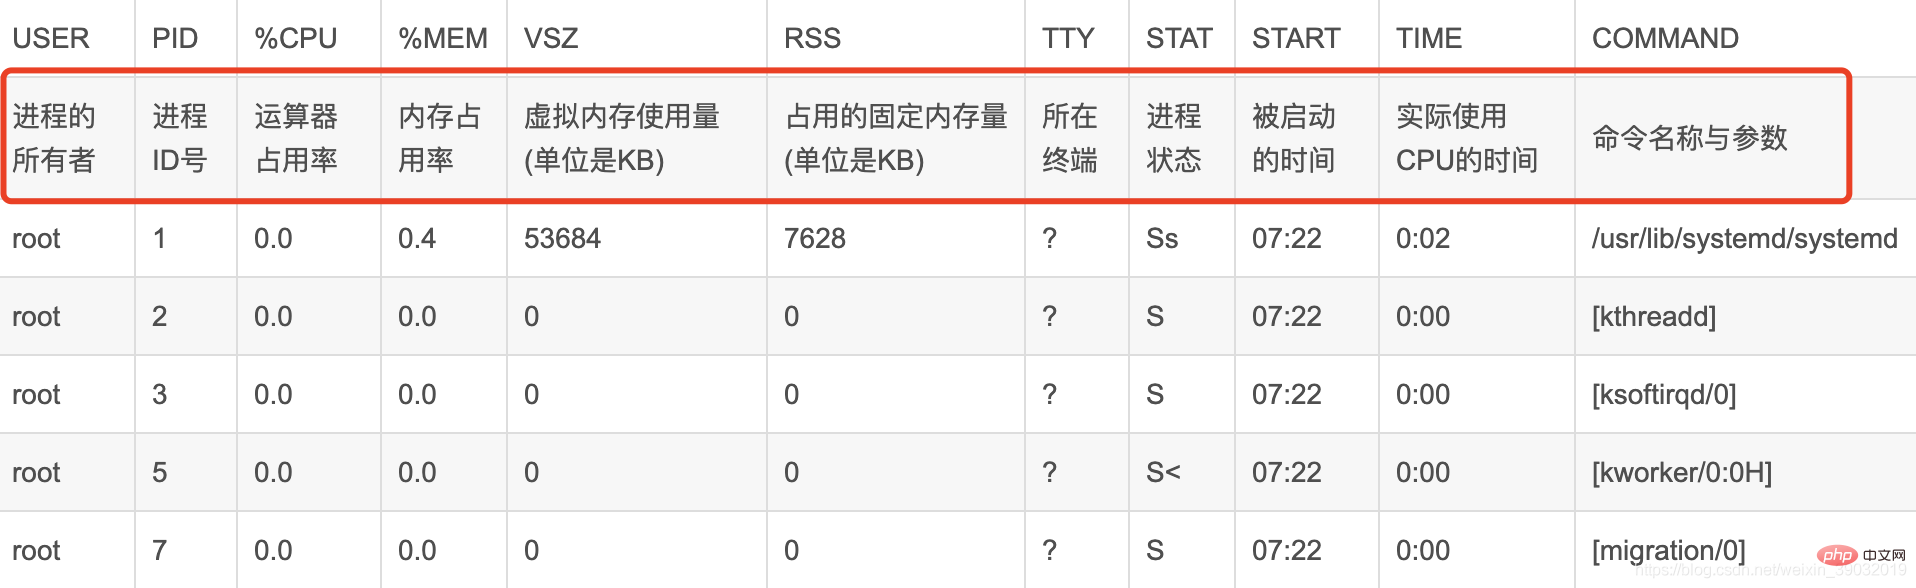
USER PID %CPU %MEM VSZ RSS TTY STAT START TIME COMMAND
● USER, the user name of the process owner.
● PID, process number, can uniquely identify the process.
● %CPU, the CPU time occupied by the process since the last refresh and the percentage of the total time.
● %MEM, the percentage of memory used by the process.
● VSZ, the virtual memory size used by the process, in K.
● RSS, the total amount of physical memory occupied by the process, in K.
● TTY, process-related terminal name.
● STAT, process status, used (R--running or ready to run; S--sleep state; I--idle; Z--frozen; D--uninterrupted sleep; W-process has no resident pages; T stop or track.) these letters to represent.
● START, the time when the process starts running.
● TIME, the total CPU time used by the process.
● COMMAND, the command line to be executed.
3.2. Top
#The top command is a commonly used performance analysis tool under Linux, which can display the resource usage of each process in the system in real time, similar to Windows Task Manager.
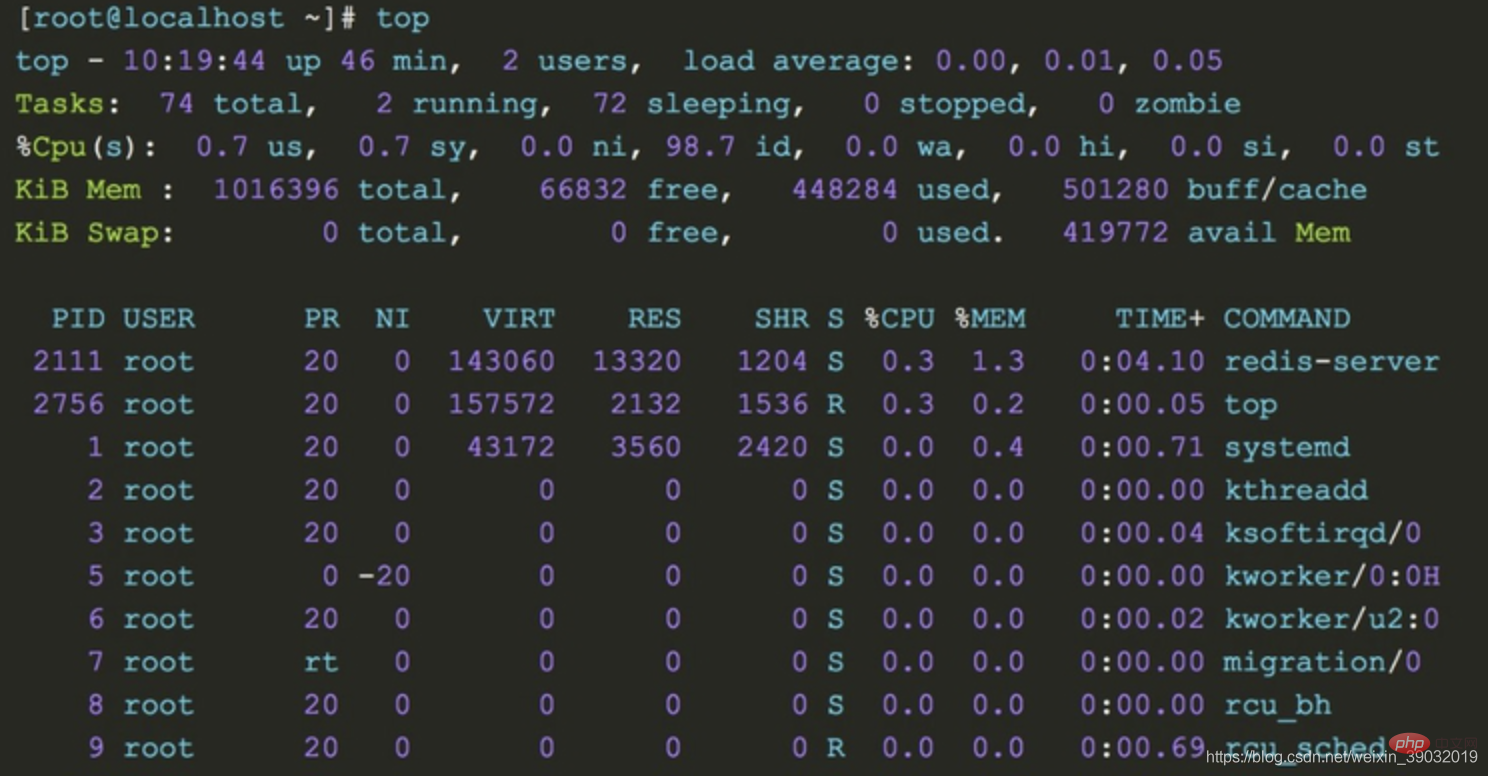
1. The upper part shows the overall system load:
- top row: From left to right are the current system time, system running time, and the average load value of the system’s CPU in the previous 1min, 5min, and 15min
- Tasks line: This line gives the overall statistical information of the process, including the total number of processes within the statistical period, the number of running processes, the number of dormant state processes, the number of stopped state processes and the number of zombie state processes
- Cpu(s) line: Overall cpu statistical information, including the ratio of cpu time occupied by processes in user mode and system mode. Processes with a nice value greater than 0 occupy the cpu time ratio in user mode. The cpu is in The time ratio of idle state, wait state, and the time ratio of processing hard interrupt and soft interrupt
- Mem line: This line provides memory statistics, including total physical memory, used Memory, free memory and the amount of memory used as buffer
- Swap line: Virtual memory statistics, including total amount of swap space, used swap area size, free swap area size and used The size of the swap space for caching
2. The lower part shows the running status of each process:
- PID : Process pid
- USER: The user who started the process
- PR: The column value plus 100 is the process priority, if the priority is less than 100, then the process is a real-time process, otherwise it is a normal process. The real-time process has a higher priority and is easier to obtain CPU scheduling. In the above output, the java process priority is 120, which is a normal process. Process, the priority of the had process is 2, which is a real-time process. The priority RT of the migration process corresponds to 0, which is the highest priority.
- NI: The nice priority value of the process, this column , the nice value of the real-time process is 0, and the nice value of the ordinary process ranges from -20~19
- VIRT: The size of the virtual memory occupied by the process (default unit kB)
- RES: The size of the physical memory occupied by the process (default unit kB)
- SHR: The size of the shared memory occupied by the process (default unit kB)
- S: The running status of the process
- %CPU: The percentage of CPU occupied by the process during the sampling period
- %MEM: Percentage of memory occupied by the process during the sampling period
- TIME : Total cpu time used by the process
- COMMAND: Command to pull up the process
【Message from Tomatoes】
1. Don’t panic when you encounter problems. Based on experience, you can then use commands to troubleshoot memory, disk, network, and CPU. The problems are just in these categories. You must not make changes in a hurry to complicate simple problems.
2. According to the above command, set the monitoring warning in advance. Monitoring and early warning can allow you to discover system performance information in time, such as the disk is almost full or the memory is overloaded. We can make adjustments in advance.
Related recommendations: "Linux Video Tutorial"
The above is the detailed content of Let me summarize for you how to check the status of memory, disk, CPU and network in Linux. For more information, please follow other related articles on the PHP Chinese website!

Hot AI Tools

Undresser.AI Undress
AI-powered app for creating realistic nude photos

AI Clothes Remover
Online AI tool for removing clothes from photos.

Undress AI Tool
Undress images for free

Clothoff.io
AI clothes remover

AI Hentai Generator
Generate AI Hentai for free.

Hot Article
Hot Tools

Notepad++7.3.1
Easy-to-use and free code editor

SublimeText3 Chinese version
Chinese version, very easy to use

Zend Studio 13.0.1
Powerful PHP integrated development environment

Dreamweaver CS6
Visual web development tools

SublimeText3 Mac version
God-level code editing software (SublimeText3)
Hot Topics
 1378
1378
 52
52

 How to start nginx in Linux
Apr 14, 2025 pm 12:51 PM
How to start nginx in Linux
Apr 14, 2025 pm 12:51 PM
Steps to start Nginx in Linux: Check whether Nginx is installed. Use systemctl start nginx to start the Nginx service. Use systemctl enable nginx to enable automatic startup of Nginx at system startup. Use systemctl status nginx to verify that the startup is successful. Visit http://localhost in a web browser to view the default welcome page.
 How to check whether nginx is started
Apr 14, 2025 pm 01:03 PM
How to check whether nginx is started
Apr 14, 2025 pm 01:03 PM
How to confirm whether Nginx is started: 1. Use the command line: systemctl status nginx (Linux/Unix), netstat -ano | findstr 80 (Windows); 2. Check whether port 80 is open; 3. Check the Nginx startup message in the system log; 4. Use third-party tools, such as Nagios, Zabbix, and Icinga.
 How to start nginx server
Apr 14, 2025 pm 12:27 PM
How to start nginx server
Apr 14, 2025 pm 12:27 PM
Starting an Nginx server requires different steps according to different operating systems: Linux/Unix system: Install the Nginx package (for example, using apt-get or yum). Use systemctl to start an Nginx service (for example, sudo systemctl start nginx). Windows system: Download and install Windows binary files. Start Nginx using the nginx.exe executable (for example, nginx.exe -c conf\nginx.conf). No matter which operating system you use, you can access the server IP
 How to solve nginx403
Apr 14, 2025 am 10:33 AM
How to solve nginx403
Apr 14, 2025 am 10:33 AM
How to fix Nginx 403 Forbidden error? Check file or directory permissions; 2. Check .htaccess file; 3. Check Nginx configuration file; 4. Restart Nginx. Other possible causes include firewall rules, SELinux settings, or application issues.
 How to solve nginx304 error
Apr 14, 2025 pm 12:45 PM
How to solve nginx304 error
Apr 14, 2025 pm 12:45 PM
Answer to the question: 304 Not Modified error indicates that the browser has cached the latest resource version of the client request. Solution: 1. Clear the browser cache; 2. Disable the browser cache; 3. Configure Nginx to allow client cache; 4. Check file permissions; 5. Check file hash; 6. Disable CDN or reverse proxy cache; 7. Restart Nginx.
 How to check whether nginx is started?
Apr 14, 2025 pm 12:48 PM
How to check whether nginx is started?
Apr 14, 2025 pm 12:48 PM
In Linux, use the following command to check whether Nginx is started: systemctl status nginx judges based on the command output: If "Active: active (running)" is displayed, Nginx is started. If "Active: inactive (dead)" is displayed, Nginx is stopped.
 How to solve nginx403 error
Apr 14, 2025 pm 12:54 PM
How to solve nginx403 error
Apr 14, 2025 pm 12:54 PM
The server does not have permission to access the requested resource, resulting in a nginx 403 error. Solutions include: Check file permissions. Check the .htaccess configuration. Check nginx configuration. Configure SELinux permissions. Check the firewall rules. Troubleshoot other causes such as browser problems, server failures, or other possible errors.
 How to clean nginx error log
Apr 14, 2025 pm 12:21 PM
How to clean nginx error log
Apr 14, 2025 pm 12:21 PM
The error log is located in /var/log/nginx (Linux) or /usr/local/var/log/nginx (macOS). Use the command line to clean up the steps: 1. Back up the original log; 2. Create an empty file as a new log; 3. Restart the Nginx service. Automatic cleaning can also be used with third-party tools such as logrotate or configured.
