 Development Tools
 VSCode
 A brief discussion on how to debug the main process code of Electron application in VSCode
A brief discussion on how to debug the main process code of Electron application in VSCode
How to debug the main process code of Electron application in
VSCode? The following article will introduce you to the VSCode debugging method. I hope it will be helpful to you!

When developing Electron applications, in order to improve work efficiency, we need to use debugging tools to discover and solve problems in time.
VSCode is the most popular code editor at the moment. Most of my codes are developed on it, and Electron applications are no exception. Today, I will share how to debug the main process code of Electron application on VSCode. [Recommended study: "vscode introductory tutorial"]
The steps described in this article are based on those who are already familiar with or know the VSCode debugging method, please follow your needs!
Building environment
The project used in this article is electron-quick-start (https://github.com/electron/electron-quick-start#/).
$ git clone https://github.com/electron/electron-quick-start
$ cd ./electron-quick-start
$ npm install
After the above steps, the basic Electron application development environment has been set up. View package.json:
{
  "name": "electron-quick-start",
  "version": "1.0.0",
  "description": "A minimal Electron application",
  "main": "main.js",
  "scripts": {
    "start": "electron ."
  },
  "repository": "https://github.com/electron/electron-quick-start",
  "keywords": [
    "Electron",
    "quick",
    "start",
    "tutorial",
    "demo"
  ],
  "author": "GitHub",
  "license": "CC0-1.0",
  "devDependencies": {
    "electron": "16.0.6"
  }
} We can run npm run start in the terminal to view the running results:

As you can see, the environment construction is complete! Next, enter the development and debugging phase.
Debug configuration
Open with VSCode and do the following:

Generate the following configuration lauch.json File:
{
    // 使用 IntelliSense 了解相关属性。
    // 悬停以查看现有属性的描述。
    // 欲了解更多信息,请访问: https://go.microsoft.com/fwlink/?linkid=830387
    "version": "0.2.0",
    "configurations": [
        {
            "type": "pwa-node",
            "request": "launch",
            "name": "Launch Program",
            "skipFiles": [
                "<node_internals>/**"
            ],
            "program": "${workspaceFolder}/main.js"
        }
    ]
}We modify its configuration as follows:
{
    "version": "0.2.0",
    "configurations": [
        {
            "name": "Debug Main Process",
            "type": "node",
            "request": "launch",
            "cwd": "${workspaceFolder}",
            "runtimeExecutable": "${workspaceFolder}/node_modules/.bin/electron",
            "windows": {
                "runtimeExecutable": "${workspaceFolder}/node_modules/.bin/electron.cmd"
            },
            "args": [
                "./main.js",  // 主文件路径
            ]
        }
    ]
}Start debugging
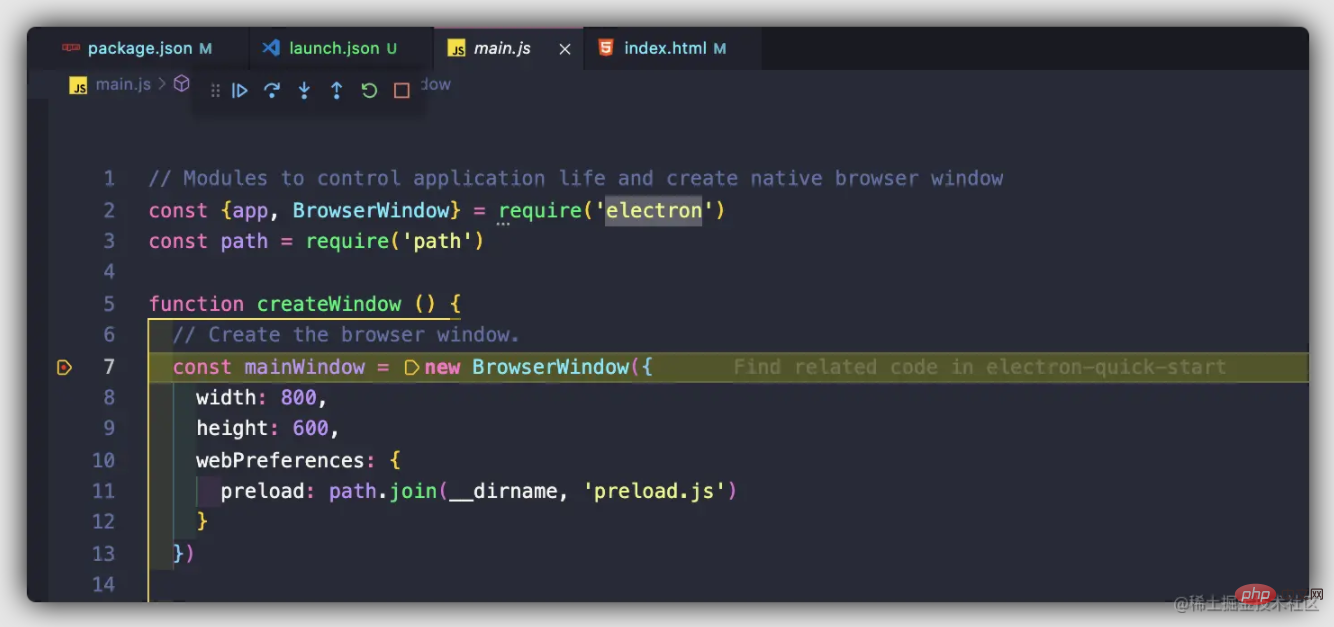
After we have completed the above environment setup and file configuration, we can have fun debugging (Put breakpoints as needed):

Everyone should be familiar with the debugging methods of VSCode, so I won’t go into details here. I hope everyone has a happy debugging and happy fishing!
Conclusion
The method introduced in this article is just one of the ways to debug the Electron main process code. It can be regarded as an introduction. If you have a better debugging method, please leave a message in the comment area to communicate. Looking forward to it. Interaction with everyone!
~This article is over, thank you for reading!
For more knowledge about VSCode, please visit: vscode tutorial! !
The above is the detailed content of A brief discussion on how to debug the main process code of Electron application in VSCode. For more information, please follow other related articles on the PHP Chinese website!

Hot AI Tools

Undresser.AI Undress
AI-powered app for creating realistic nude photos

AI Clothes Remover
Online AI tool for removing clothes from photos.

Undress AI Tool
Undress images for free

Clothoff.io
AI clothes remover

Video Face Swap
Swap faces in any video effortlessly with our completely free AI face swap tool!

Hot Article

Hot Tools

Notepad++7.3.1
Easy-to-use and free code editor

SublimeText3 Chinese version
Chinese version, very easy to use

Zend Studio 13.0.1
Powerful PHP integrated development environment

Dreamweaver CS6
Visual web development tools

SublimeText3 Mac version
God-level code editing software (SublimeText3)

Hot Topics
 1386
1386
 52
52
 What computer configuration is required for vscode
Apr 15, 2025 pm 09:48 PM
VS Code system requirements: Operating system: Windows 10 and above, macOS 10.12 and above, Linux distribution processor: minimum 1.6 GHz, recommended 2.0 GHz and above memory: minimum 512 MB, recommended 4 GB and above storage space: minimum 250 MB, recommended 1 GB and above other requirements: stable network connection, Xorg/Wayland (Linux)
 How to define header files for vscode
Apr 15, 2025 pm 09:09 PM
How to define header files using Visual Studio Code? Create a header file and declare symbols in the header file using the .h or .hpp suffix name (such as classes, functions, variables) Compile the program using the #include directive to include the header file in the source file. The header file will be included and the declared symbols are available.
 How to switch Chinese mode with vscode
Apr 15, 2025 pm 11:39 PM
VS Code To switch Chinese mode: Open the settings interface (Windows/Linux: Ctrl, macOS: Cmd,) Search for "Editor: Language" settings Select "Chinese" in the drop-down menu Save settings and restart VS Code
 How to set vscode in Chinese
Apr 15, 2025 pm 09:27 PM
There are two ways to set up a Chinese language in Visual Studio Code: 1. Install the Chinese language package; 2. Modify the "locale" settings in the configuration file. Make sure Visual Studio Code version is 1.17 or higher.
 Common commands for vscode terminal
Apr 15, 2025 pm 10:06 PM
Common commands for VS Code terminals include: Clear the terminal screen (clear), list the current directory file (ls), change the current working directory (cd), print the current working directory path (pwd), create a new directory (mkdir), delete empty directory (rmdir), create a new file (touch) delete a file or directory (rm), copy a file or directory (cp), move or rename a file or directory (mv) display file content (cat) view file content and scroll (less) view file content only scroll down (more) display the first few lines of the file (head)
 How to solve the problem of vscode Chinese annotations becoming question marks
Apr 15, 2025 pm 11:36 PM
How to solve the problem that Chinese comments in Visual Studio Code become question marks: Check the file encoding and make sure it is "UTF-8 without BOM". Change the font to a font that supports Chinese characters, such as "Song Style" or "Microsoft Yahei". Reinstall the font. Enable Unicode support. Upgrade VSCode, restart the computer, and recreate the source file.
 vscode Previous Next Shortcut Key
Apr 15, 2025 pm 10:51 PM
VS Code One-step/Next step shortcut key usage: One-step (backward): Windows/Linux: Ctrl ←; macOS: Cmd ←Next step (forward): Windows/Linux: Ctrl →; macOS: Cmd →
 How to use VSCode
Apr 15, 2025 pm 11:21 PM
Visual Studio Code (VSCode) is a cross-platform, open source and free code editor developed by Microsoft. It is known for its lightweight, scalability and support for a wide range of programming languages. To install VSCode, please visit the official website to download and run the installer. When using VSCode, you can create new projects, edit code, debug code, navigate projects, expand VSCode, and manage settings. VSCode is available for Windows, macOS, and Linux, supports multiple programming languages and provides various extensions through Marketplace. Its advantages include lightweight, scalability, extensive language support, rich features and version


