
 Web Front-end
JS Tutorial
Completely Master JavaScript Memory Leak (Detailed Graphical and Text Explanation)
Web Front-end
JS Tutorial
Completely Master JavaScript Memory Leak (Detailed Graphical and Text Explanation)
Completely Master JavaScript Memory Leak (Detailed Graphical and Text Explanation)

This article brings you relevant knowledge about memory leaks in JavaScript, including what memory leaks are, what situations will cause memory leaks and other related problems. I hope it will be helpful to everyone.
#js memory leak
What is a memory leak?
The program requires memory to run. Whenever a program asks for it, the operating system or runtime must provide memory.
For a continuously running service process (daemon), memory that is no longer used must be released in a timely manner. Otherwise, the memory usage will become higher and higher, which will affect the system performance at best and cause the process to crash at worst. 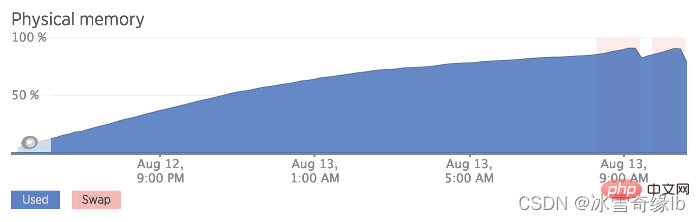
Memory that is no longer used and is not released in time is called a memory leak.
Some languages (such as C language) must manually release memory, and the programmer is responsible for memory management.
char * buffer;buffer = (char*) malloc(42);// Do something with bufferfree(buffer);
The above is C language code. The malloc method is used to apply for memory. After use, you must use the free method to release the memory.
This is troublesome, so most languages provide automatic memory management to reduce the burden on programmers. This is called a "garbage collector" (garbage collector).
Although the front-end has a garbage collection mechanism, when a piece of useless memory cannot be considered as garbage by the garbage collection mechanism, a memory leak will occur.
What situations can cause memory leaks
1. Unexpected global variables
Global variables have the longest life cycle until the page is closed. are all alive, so the memory on global variables will never be reclaimed.
When global variables are used improperly, are not recycled in time (manual assignment of null), or a variable is mounted to a global variable due to spelling errors, memory leaks occur.
2. Forgotten timers
setTimeout and setInterval are maintained by browser dedicated threads, so when a timer is used on a certain page, when the timer is used, When the page is destroyed, if these timers are not manually released and cleaned, then these timers are still alive.
In other words, the life cycle of the timer is not attached to the page, so when a callback function is registered through the timer in the js of the current page, and the callback function holds the current page When a certain variable or certain DOM elements are used, even if the page is destroyed, the page cannot be recycled normally because the timer holds a partial reference to the page, resulting in a memory leak.
If the same page is opened again at this time, there will actually be double page data in the memory. If it is closed and opened multiple times, the memory leak will become more and more serious. And this scenario is easy to happen, because people who use timers can easily forget to clear it.
3. Improper use of closures
The function itself will hold a reference to the lexical environment in which it was defined, but usually, after using the function, the function is The allocated memory will be reclaimed.
But when a function is returned within the function, because the returned function holds the lexical environment of the external function, and the returned function is held by other life cycle things, although the external function has been executed, it will not be executed. The memory cannot be reclaimed.
4. Missing DOM elements
The normal life cycle of a DOM element depends on whether it is mounted on the DOM tree. When it is removed from the DOM tree, it can Destroyed and recycled
But if a DOM element also holds a reference to it in js, then its life cycle is determined by both js and whether it is on the DOM tree. Remember, when removing, both Every place needs to be cleaned before it can be recycled properly.
5. Network callback
In some scenarios, a network request is initiated on a certain page and a callback is registered, and the callback function holds some content of the page, then , when the page is destroyed, the network callback should be logged out, otherwise, because the network holds part of the page content, part of the page content will not be recycled.
How to monitor memory leaks
Memory leaks can be divided into two categories. One is more serious, and the leaked one will never be recovered, and the other is slightly more serious. Be gentle, even if memory leak is caused by not cleaning up in time, it can still be cleaned up after a period of time.
No matter which one, if you use the memory map captured by the developer tool, you should see that the memory usage continues to decrease linearly over a period of time. This is due to the continuous occurrence of GC, which is caused by garbage collection. .
Insufficient memory will cause continuous GC, and GC will block the main thread, so it will affect page performance and cause lag, so the memory leak problem still needs to be paid attention to.
Scenario 1: Apply for a piece of memory in a certain function, and then the function is called continuously in a short period of time
// 点击按钮,就执行一次函数,申请一块内存startBtn.addEventListener("click", function() {
	var a = new Array(100000).fill(1);
	var b = new Array(20000).fill(1);});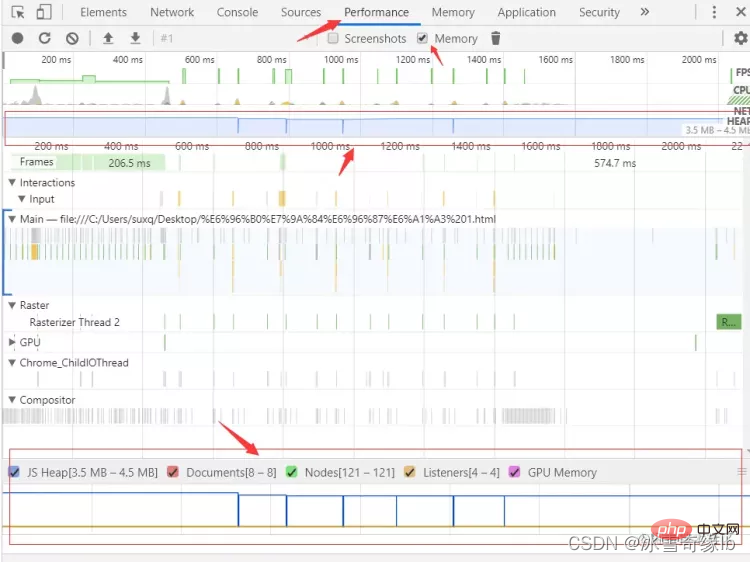
一个页面能够使用的内存是有限的,当内存不足时,就会触发垃圾回收机制去回收没用的内存。
而在函数内部使用的变量都是局部变量,函数执行完毕,这块内存就没用可以被回收了。
所以当我们短时间内不断调用该函数时,可以发现,函数执行时,发现内存不足,垃圾回收机制工作,回收上一个函数申请的内存,因为上个函数已经执行结束了,内存无用可被回收了。
所以图中呈现内存使用量的图表就是一条横线过去,中间出现多处竖线,其实就是表示内存清空,再申请,清空再申请,每个竖线的位置就是垃圾回收机制工作以及函数执行又申请的时机。
场景二:在某个函数内申请一块内存,然后该函数在短时间内不断被调用,但每次申请的内存,有一部分被外部持有。
// 点击按钮,就执行一次函数,申请一块内存var arr = [];startBtn.addEventListener("click", function() {
	var a = new Array(100000).fill(1);
	var b = new Array(20000).fill(1);
    arr.push(b);});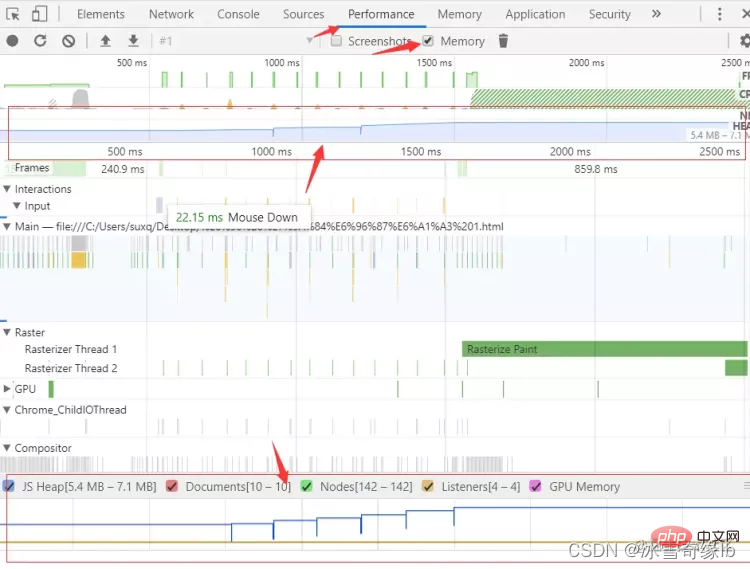
看一下跟第一张图片有什么区别?
不再是一条横线了吧,而且横线中的每个竖线的底部也不是同一水平了吧。
其实这就是内存泄漏了。
我们在函数内申请了两个数组内存,但其中有个数组却被外部持有,那么,即使每次函数执行完,这部分被外部持有的数组内存也依旧回收不了,所以每次只能回收一部分内存。
这样一来,当函数调用次数增多时,没法回收的内存就越多,内存泄漏的也就越多,导致内存使用量一直在增长
另外,也可以使用 performance monitor 工具,在开发者工具里找到更多的按钮,在里面打开此功能面板,这是一个可以实时监控 cpu,内存等使用情况的工具,会比上面只能抓取一段时间内工具更直观一点: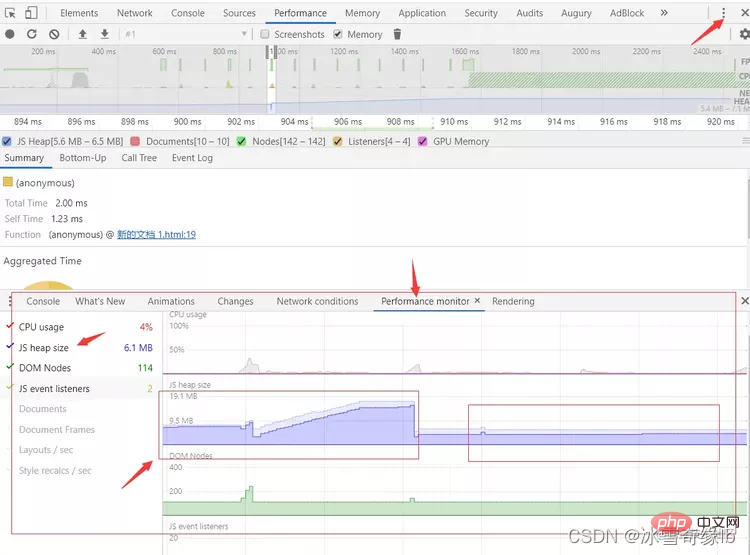
梯状上升的就是发生内存泄漏了,每次函数调用,总有一部分数据被外部持有导致无法回收,而后面平滑状的则是每次使用完都可以正常被回收。
这张图需要注意下,第一个红框末尾有个直线式下滑,这是因为,我修改了代码,把外部持有函数内申请的数组那行代码去掉,然后刷新页面,手动点击 GC 才触发的效果,否则,无论你怎么点 GC,有部分内存一直无法回收,是达不到这样的效果图的。
以上,是监控是否发生内存泄漏的一些工具,但下一步才是关键,既然发现内存泄漏,那该如何定位呢?如何知道,是哪部分数据没被回收导致的泄漏呢?
如何分析内存泄漏,找出有问题的代码
分析内存泄漏的原因,还是需要借助开发者工具的 Memory 功能,这个功能可以抓取内存快照,也可以抓取一段时间内,内存分配的情况,还可以抓取一段时间内触发内存分配的各函数情况。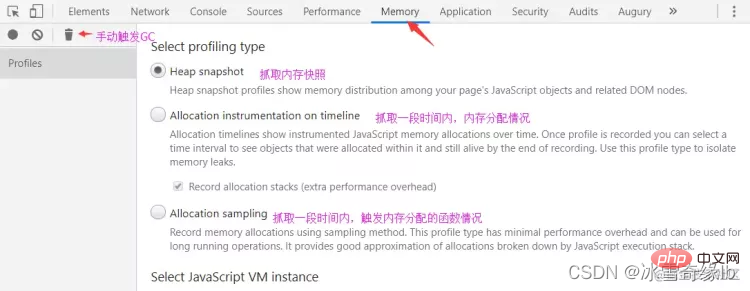
利用这些工具,我们可以分析出,某个时刻是由于哪个函数操作导致了内存分配,分析出大量重复且没有被回收的对象是什么。
这样一来,有嫌疑的函数也知道了,有嫌疑的对象也知道了,再去代码中分析下,这个函数里的这个对象到底是不是就是内存泄漏的元凶,搞定。
先举个简单例子,再举个实际内存泄漏的例子:
场景一:在某个函数内申请一块内存,然后该函数在短时间内不断被调用,但每次申请的内存,有一部分被外部持有
// 每次点击按钮,就有一部分内存无法回收,因为被外部 arr 持有了var arr = [];startBtn.addEventListener("click", function() {
	var a = new Array(100000).fill(1);
	var b = new Array(20000).fill(1);
  arr.push(b);});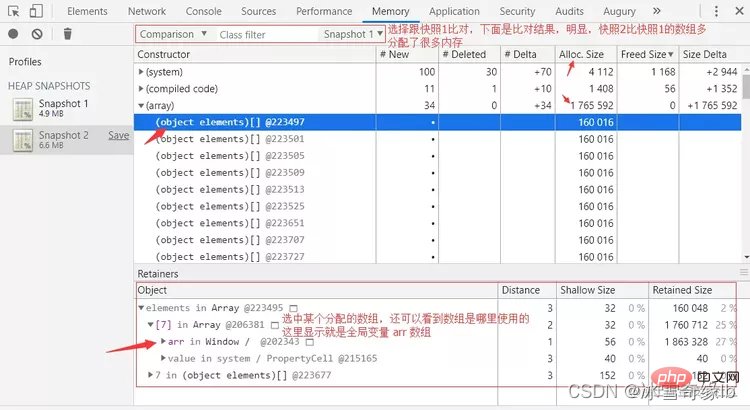
可以抓取两份快照,两份快照中间进行内存泄漏操作,最后再比对两份快照的区别,查看增加的对象是什么,回收的对象又是哪些,如上图。
也可以单独查看某个时刻快照,从内存占用比例来查看占据大量内存的是什么对象,如下图: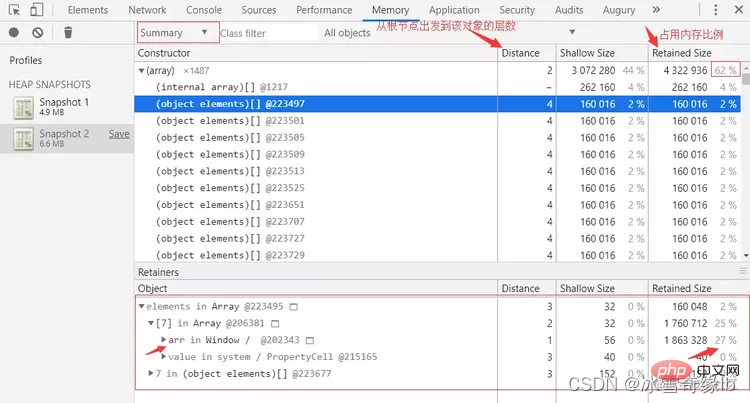
还可以从垃圾回收机制角度出发,查看从 GC root 根节点出发,可达的对象里,哪些对象占用大量内存: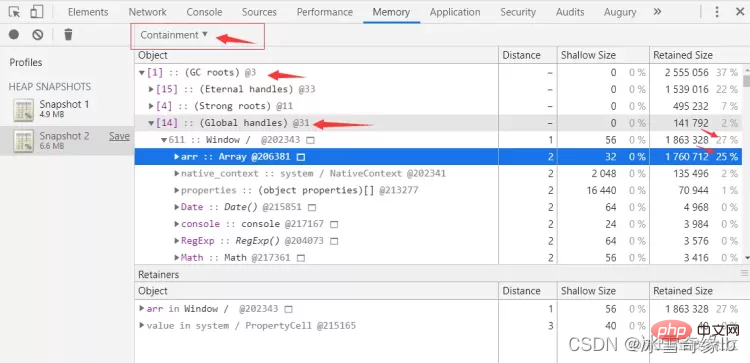
从上面这些方式入手,都可以查看到当前占用大量内存的对象是什么,一般来说,这个就是嫌疑犯了。
当然,也并不一定,当有嫌疑对象时,可以利用多次内存快照间比对,中间手动强制 GC 下,看下该回收的对象有没有被回收,这是一种思路。
- 抓取一段时间内,内存分配情况。

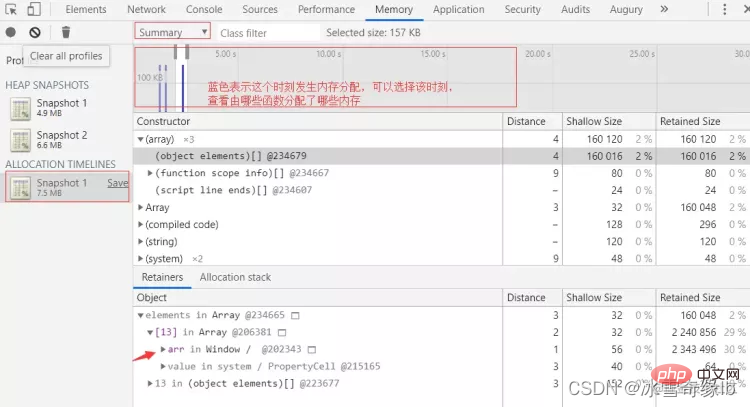
这个方式,可以有选择性的查看各个内存分配时刻是由哪个函数发起,且内存存储的是什么对象。
当然,内存分配是正常行为,这里查看到的还需要借助其他数据来判断某个对象是否是嫌疑对象,比如内存占用比例,或结合内存快照等等。
- 抓取一段时间内函数的内存使用情况
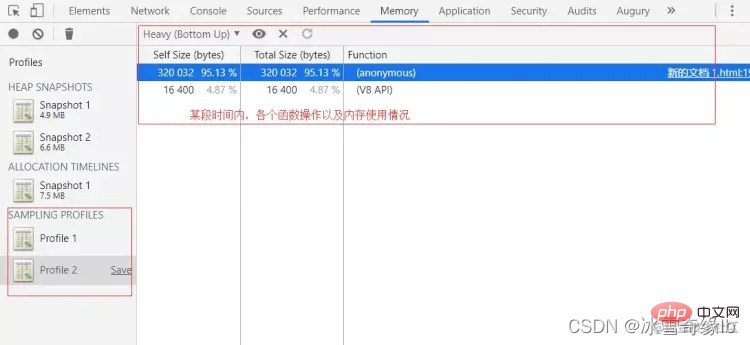
这个能看到的内容很少,比较简单,目的也很明确,就是一段时间内,都有哪些操作在申请内存,且用了多少。
总之,这些工具并没有办法直接给你答复,告诉你 xxx 就是内存泄漏的元凶,如果浏览器层面就能确定了,那它干嘛不回收它,干嘛还会造成内存泄漏
所以,这些工具,只能给你各种内存使用信息,你需要自己借助这些信息,根据自己代码的逻辑,去分析,哪些嫌疑对象才是内存泄漏的元凶。
实例分析
例子1:
var t = null;var replaceThing = function() {
  var o = t  var unused = function() {
    if (o) {
      console.log("hi")
    }
  }

  t = {
    longStr: new Array(100000).fill('*'),
    someMethod: function() {
      console.log(1)
    }
}}setInterval(replaceThing, 1000)先说说这代码用途,声明了一个全局变量 t 和 replaceThing 函数,函数目的在于会为全局变量赋值一个新对象,然后内部有个变量存储全局变量 t 被替换前的值,最后定时器周期性执行 replaceThing 函数
- 发现问题
我们先利用工具看看,是不是会发生内存泄漏: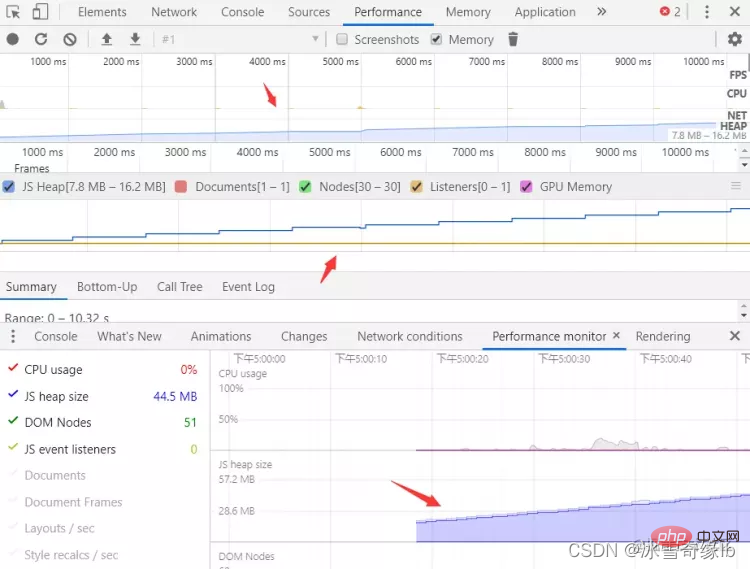
三种内存监控图表都显示,这发生内存泄漏了:反复执行同个函数,内存却梯状式增长,手动点击 GC 内存也没有下降,说明函数每次执行都有部分内存泄漏了。
这种手动强制垃圾回收都无法将内存将下去的情况是很严重的,长期执行下去,会耗尽可用内存,导致页面卡顿甚至崩掉。
- 分析问题
既然已经确定有内存泄漏了,那么接下去就该找出内存泄漏的原因了。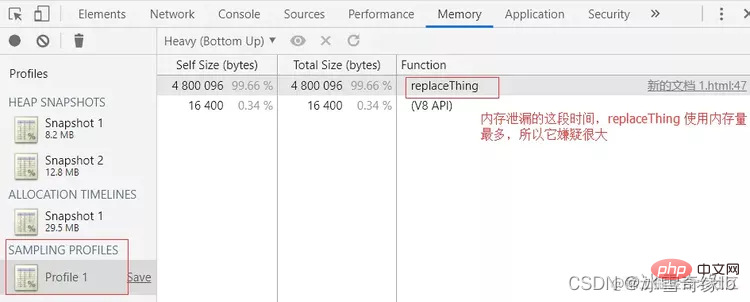
首先通过 sampling profile,我们把嫌疑定位到 replaceThing 这个函数上
接着,我们抓取两份内存快照,比对一下,看看能否得到什么信息: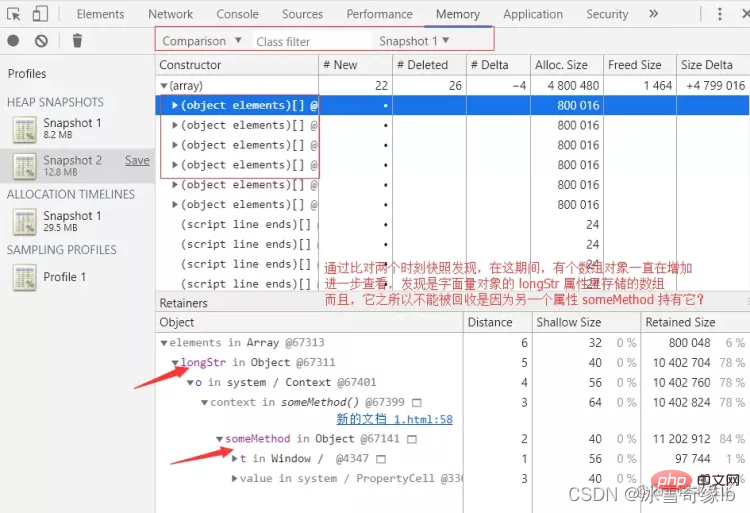
比对两份快照可以发现,这过程中,数组对象一直在增加,而且这个数组对象来自 replaceThing 函数内部创建的对象的 longStr 属性。
其实这张图信息很多了,尤其是下方那个嵌套图,嵌套关系是反着来,你倒着看的话,就可以发现,从全局对象 Window 是如何一步步访问到该数组对象的,垃圾回收机制正是因为有这样一条可达的访问路径,才无法回收。
其实这里就可以分析了,为了多使用些工具,我们换个图来分析吧。
我们直接从第二份内存快照入手,看看: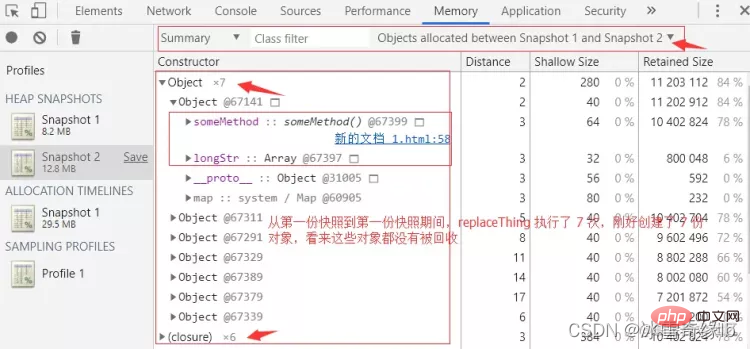
为什么每一次 replaceThing 函数调用后,内部创建的对象都无法被回收呢?
因为 replaceThing 的第一次创建,这个对象被全局变量 t 持有,所以回收不了。
后面的每一次调用,这个对象都被上一个 replaceThing 函数内部的 o 局部变量持有而回收不了。
而这个函数内的局部变量 o 在 replaceThing 首次调用时被创建的对象的 someMethod 方法持有,该方法挂载的对象被全局变量 t 持有,所以也回收不了。
这样层层持有,每一次函数的调用,都会持有函数上次调用时内部创建的局部变量,导致函数即使执行结束,这些局部变量也无法回收。
相关推荐:javascript学习教程
The above is the detailed content of Completely Master JavaScript Memory Leak (Detailed Graphical and Text Explanation). For more information, please follow other related articles on the PHP Chinese website!

Hot AI Tools

Undresser.AI Undress
AI-powered app for creating realistic nude photos

AI Clothes Remover
Online AI tool for removing clothes from photos.

Undress AI Tool
Undress images for free

Clothoff.io
AI clothes remover

AI Hentai Generator
Generate AI Hentai for free.

Hot Article
Hot Tools

Notepad++7.3.1
Easy-to-use and free code editor

SublimeText3 Chinese version
Chinese version, very easy to use

Zend Studio 13.0.1
Powerful PHP integrated development environment

Dreamweaver CS6
Visual web development tools

SublimeText3 Mac version
God-level code editing software (SublimeText3)
Hot Topics
 1378
1378
 52
52

 Table Border in HTML
Sep 04, 2024 pm 04:49 PM
Table Border in HTML
Sep 04, 2024 pm 04:49 PM
Guide to Table Border in HTML. Here we discuss multiple ways for defining table-border with examples of the Table Border in HTML.
 HTML margin-left
Sep 04, 2024 pm 04:48 PM
HTML margin-left
Sep 04, 2024 pm 04:48 PM
Guide to HTML margin-left. Here we discuss a brief overview on HTML margin-left and its Examples along with its Code Implementation.
 Nested Table in HTML
Sep 04, 2024 pm 04:49 PM
Nested Table in HTML
Sep 04, 2024 pm 04:49 PM
This is a guide to Nested Table in HTML. Here we discuss how to create a table within the table along with the respective examples.
 HTML Table Layout
Sep 04, 2024 pm 04:54 PM
HTML Table Layout
Sep 04, 2024 pm 04:54 PM
Guide to HTML Table Layout. Here we discuss the Values of HTML Table Layout along with the examples and outputs n detail.
 HTML Input Placeholder
Sep 04, 2024 pm 04:54 PM
HTML Input Placeholder
Sep 04, 2024 pm 04:54 PM
Guide to HTML Input Placeholder. Here we discuss the Examples of HTML Input Placeholder along with the codes and outputs.
 HTML Ordered List
Sep 04, 2024 pm 04:43 PM
HTML Ordered List
Sep 04, 2024 pm 04:43 PM
Guide to the HTML Ordered List. Here we also discuss introduction of HTML Ordered list and types along with their example respectively
 Moving Text in HTML
Sep 04, 2024 pm 04:45 PM
Moving Text in HTML
Sep 04, 2024 pm 04:45 PM
Guide to Moving Text in HTML. Here we discuss an introduction, how marquee tag work with syntax and examples to implement.
 HTML onclick Button
Sep 04, 2024 pm 04:49 PM
HTML onclick Button
Sep 04, 2024 pm 04:49 PM
Guide to HTML onclick Button. Here we discuss their introduction, working, examples and onclick Event in various events respectively.
