What are the debugging methods in PHP?
The debug (debugging) methods in PHP are: 1. Add echo, var_dump, print_r and exit statements in the PHP code, and print information through the browser for debugging; 2. Use Xdebug for debugging; 3. Through Console terminal for debugging.

The operating environment of this tutorial: Windows 7 system, PHP version 7.1, DELL G3 computer
Commonly used debugging methods for PHP
Debug by printing information from the browser
Method
Add echo, var_dump, print_r and exit, view the output in the browser.
Advantages and Disadvantages
Advantages:
- Simple, easy to use, no need to install plug-ins
- For the code you write , or a more familiar framework, you can use it like this
Disadvantages:
- For multi-branch logic, you need to add a lot of code or try multiple times
- For Unfamiliar logic cannot reflect the complete execution process.
- It is possible to leave debugging statements in the project
- Unable to single step
Tips
When debugging, In order to format output variables, you often need to implement your own dump() function in the project. Using Composer, the dump() function in the symfony/var-dumper package can be installed globally, making it available to all projects without modifying the project.
- Global installation
symfony/var-dumperPackage:
By default, it will be installed to the${HOME}/.config/composerdirectory
composer global require symfony/var-dumper
- Modify the
php.inifile and include the specified file before executing the PHP code
auto_prepend_file = ${HOME}/.config/composer/vendor/autoload.phpUse Xdebug Debugging
XDebug is a C/S structure, where Client is Xdebug installed in PHP, Server is the plug-in installed in IDE, and uses DBGP protocol to communicate. When PHP runs a script, it sends debugging information to the IDE through the Xdebug plug-in and receives control signals from the IDE.
You need to install and enable Xdebug for PHP, and then set up the IDE's Xdebug plug-in so that the two can communicate.
Advantages and Disadvantages
- Supports single-step debugging and acquisition of arbitrary variable values
- Complex configuration, requires IDE to install plug-ins
- Support cooperation with browsers, the request needs to carry
XDEBUG_SESSION_STARTParameters
Web App debugging
For web applications, To enable Xdebug debugging mode, additional flags must be added to the request sent by the browser. You can add XDEBUG_SESSION_START=session_name in the GET/POST/Cookie parameters, so that Xdebug will understand that this request needs to be debugged and connect to the IDE.
But it is troublesome to set it manually every time. There are two ways to simplify the operation:
- Use the method provided by the IDE. For PhpStorm, see Debugging PHP Web Applications with Run Debug Configurations. When using it, you need to configure the Web Server in the IDE, then set up a PHP Web Application, click the Debug button to start debugging, then the IDE will automatically open the browser and enter the URL, and add
XDEBUG_SESSION_START=session_name. - Use a browser plug-in and turn on the debugging switch of the plug-in. The plug-in can automatically bring the corresponding cookie in the request. For Chrome you can install Xdebug helper.
Debug through the console terminal (CLI mode)
For non-web applications, such as scheduled tasks or unit tests, you can directly Debugging in the console.
In PhpStorm, use the Alt F12 shortcut key to open the command line terminal. However, because only one terminal can be displayed in the IDE, the debugging terminal after debugging is turned on will cover the command line terminal, so it is better to open a separate command line terminal (you can use a DOS window or PowerShell under Windows).
Method and principle
Web applications debug requests through GET/POST/Cookie parameter flags, while non-web applications enable debugging by setting environment variables in the command line terminal. .
Two steps:
- Set environment variables
XDEBUG_CONFIG="idekey=session_name", this idekey needs to be matched withphp.iniSome of the idekey settings are the same. - Execute the script in the command line terminal. When executed, the debug terminal of the IDE will be evoked, allowing single-step debugging, and the output results will be displayed in the command line terminal in real time.
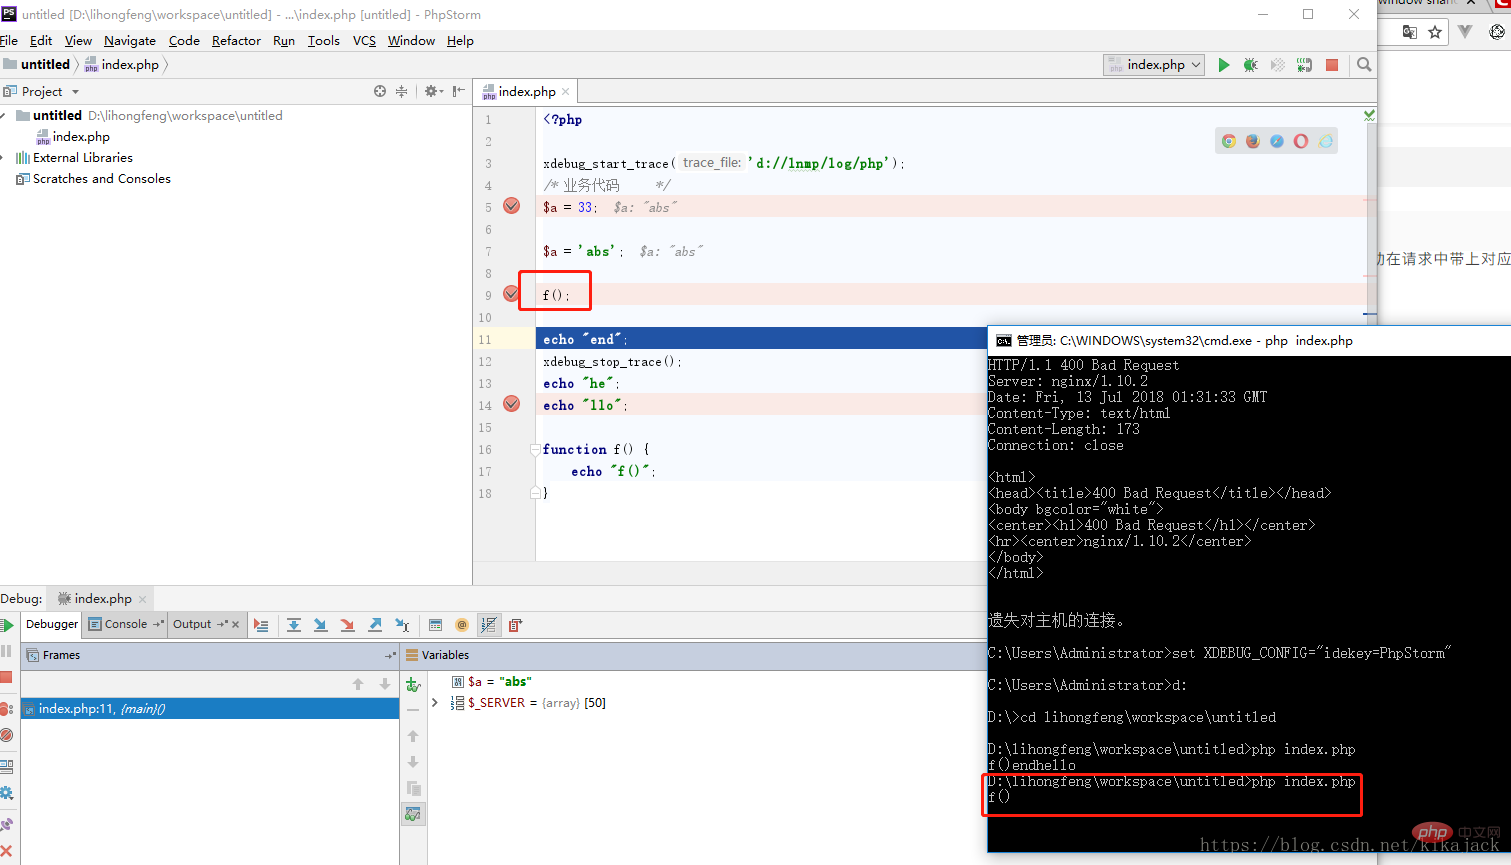
IDE usually provides shortcut operations. For PHPStorm, you can refer to Debugging PHP CLI scripts with PhpStorm.
After starting debugging through the IDE, the IDE will start the Xdebug plug-in to listen to a certain port (PhpStorm defaults to 9000, but this conflicts with PHP-FPM and can be changed to 9001) to obtain the debugging information returned by the PHP server.
D:\lnmp\php72\php.exe -dxdebug.remote_enable=1 -dxdebug.remote_mode=req -dxdebug.remote_port=9001 -dxdebug.remote_host=127.0.0.1 D:\lihongfeng\workspace\untitled\index.php
设置、查看和释放环境变量
- Linux
export XDEBUG_CONFIG="idekey=session_name" // 设置环境变量
echo $XDEBUG_CONFIG // 查看环境变量
unset XDEBUG_CONFIG // 删除环境变量
- Windows
set XDEBUG_CONFIG="idekey=session_name" // 设置环境变量
echo %XDEBUG_CONFIG% // 查看环境变量
set XDEBUG_CONFIG // 查看环境变量
set XDEBUG_CONFIG= // 删除环境变量
推荐学习:《PHP视频教程》
The above is the detailed content of What are the debugging methods in PHP?. For more information, please follow other related articles on the PHP Chinese website!

Hot AI Tools

Undresser.AI Undress
AI-powered app for creating realistic nude photos

AI Clothes Remover
Online AI tool for removing clothes from photos.

Undress AI Tool
Undress images for free

Clothoff.io
AI clothes remover

Video Face Swap
Swap faces in any video effortlessly with our completely free AI face swap tool!

Hot Article

Hot Tools

Notepad++7.3.1
Easy-to-use and free code editor

SublimeText3 Chinese version
Chinese version, very easy to use

Zend Studio 13.0.1
Powerful PHP integrated development environment

Dreamweaver CS6
Visual web development tools

SublimeText3 Mac version
God-level code editing software (SublimeText3)

Hot Topics
 1389
1389
 52
52
 PHP 8.4 Installation and Upgrade guide for Ubuntu and Debian
Dec 24, 2024 pm 04:42 PM
PHP 8.4 brings several new features, security improvements, and performance improvements with healthy amounts of feature deprecations and removals. This guide explains how to install PHP 8.4 or upgrade to PHP 8.4 on Ubuntu, Debian, or their derivati
 7 PHP Functions I Regret I Didn't Know Before
Nov 13, 2024 am 09:42 AM
If you are an experienced PHP developer, you might have the feeling that you’ve been there and done that already.You have developed a significant number of applications, debugged millions of lines of code, and tweaked a bunch of scripts to achieve op
 How To Set Up Visual Studio Code (VS Code) for PHP Development
Dec 20, 2024 am 11:31 AM
Visual Studio Code, also known as VS Code, is a free source code editor — or integrated development environment (IDE) — available for all major operating systems. With a large collection of extensions for many programming languages, VS Code can be c
 Explain JSON Web Tokens (JWT) and their use case in PHP APIs.
Apr 05, 2025 am 12:04 AM
JWT is an open standard based on JSON, used to securely transmit information between parties, mainly for identity authentication and information exchange. 1. JWT consists of three parts: Header, Payload and Signature. 2. The working principle of JWT includes three steps: generating JWT, verifying JWT and parsing Payload. 3. When using JWT for authentication in PHP, JWT can be generated and verified, and user role and permission information can be included in advanced usage. 4. Common errors include signature verification failure, token expiration, and payload oversized. Debugging skills include using debugging tools and logging. 5. Performance optimization and best practices include using appropriate signature algorithms, setting validity periods reasonably,
 How do you parse and process HTML/XML in PHP?
Feb 07, 2025 am 11:57 AM
This tutorial demonstrates how to efficiently process XML documents using PHP. XML (eXtensible Markup Language) is a versatile text-based markup language designed for both human readability and machine parsing. It's commonly used for data storage an
 PHP Program to Count Vowels in a String
Feb 07, 2025 pm 12:12 PM
A string is a sequence of characters, including letters, numbers, and symbols. This tutorial will learn how to calculate the number of vowels in a given string in PHP using different methods. The vowels in English are a, e, i, o, u, and they can be uppercase or lowercase. What is a vowel? Vowels are alphabetic characters that represent a specific pronunciation. There are five vowels in English, including uppercase and lowercase: a, e, i, o, u Example 1 Input: String = "Tutorialspoint" Output: 6 explain The vowels in the string "Tutorialspoint" are u, o, i, a, o, i. There are 6 yuan in total
 Explain late static binding in PHP (static::).
Apr 03, 2025 am 12:04 AM
Static binding (static::) implements late static binding (LSB) in PHP, allowing calling classes to be referenced in static contexts rather than defining classes. 1) The parsing process is performed at runtime, 2) Look up the call class in the inheritance relationship, 3) It may bring performance overhead.
 What are PHP magic methods (__construct, __destruct, __call, __get, __set, etc.) and provide use cases?
Apr 03, 2025 am 12:03 AM
What are the magic methods of PHP? PHP's magic methods include: 1.\_\_construct, used to initialize objects; 2.\_\_destruct, used to clean up resources; 3.\_\_call, handle non-existent method calls; 4.\_\_get, implement dynamic attribute access; 5.\_\_set, implement dynamic attribute settings. These methods are automatically called in certain situations, improving code flexibility and efficiency.


