 Development Tools
 VSCode
 [Summary of vomiting blood] Tips on debugging and using VSCode to double your development work efficiency
[Summary of vomiting blood] Tips on debugging and using VSCode to double your development work efficiency
This article will summarize and share with you some VSCode advanced debugging and usage skills for each scenario, so as to double the efficiency of your daily development work. I hope it will be helpful to everyone!
![[Summary of vomiting blood] Tips on debugging and using VSCode to double your development work efficiency](https://img.php.cn/upload/article/000/000/024/6226ccb9b9c9f759.jpg)
#VsCode has quickly become popular with its excellent features since its birth. Especially for front-end development partners, it has almost become an indispensable development tool. Therefore, mastering the respective usage skills and debugging skills of VsCode will double the efficiency of your daily development work. This article will use a large number of pictures and texts to introduce various techniques of VsCode in detail from the following aspects:
- The first part mainly introduces the basic techniques of VsCode, such as commonly used shortcut keys, auxiliary rulers, etc. Those who are familiar with this part can skip it directly. [Recommended study: "vscode introductory tutorial"]
- The second part mainly focuses on various breakpoints (such as log breakpoints, inline breakpoints, expression breakpoints, etc.), data Panels, etc.
- The third part mainly explains the practical debugging of various projects, such as the practical debugging of Node programs, TS programs, Vue programs, Electron programs, Html, etc.
- The last part will explain Other useful tips, such as code snippets, refactoring, Emmet, etc.
Basic Tips
Quick Start
After VsCode is installed, environment variables will be automatically written , enter code in the terminal to invoke the VsCode application.
Commonly used shortcut keys
-
ctrl pQuickly search for files and jump, add:to jump to the specified line
![164670877669153[Summary of vomiting blood] Tips on debugging and using VSCode to double your development work efficiency [Summary of vomiting blood] Tips on debugging and using VSCode to double your development work efficiency](https://img.php.cn/upload/image/279/872/331/1646709588942290.png)
ctrl shift pAccess all available commands based on your current context.ctrl shift cOpen a terminal externally and navigate to the current project pathctrl Press the left of key 1 SymbolShow hidden terminal panelCtrl BSwitch sidebarCtrl \Quickly split file editingalt single left clickAdd multiple cursorsalt shift single Left clickAdd cursor to all positions in the same columnalt shift mouse selectionSelect the area with the same start and end
![164670878188167[Summary of vomiting blood] Tips on debugging and using VSCode to double your development work efficiency [Summary of vomiting blood] Tips on debugging and using VSCode to double your development work efficiency](https://img.php.cn/upload/image/279/872/331/1646709588942290.png)
-
alt up key or down keyMove the current line or selected area up/down one line
Vertical Ruler
Add the following configuration in the configuration file to increase the number of characters. Ruler auxiliary lines
"editor.rulers": [40, 80, 100]
![164670878671032[Summary of vomiting blood] Tips on debugging and using VSCode to double your development work efficiency [Summary of vomiting blood] Tips on debugging and using VSCode to double your development work efficiency](https://img.php.cn/upload/image/279/872/331/1646709588942290.png)
Advanced skills
breakpoint Basic usage
The following takes quickly debugging a Node project in VsCode as an example to demonstrate the basic use of breakpoints. The following article will continue to complete various advanced breakpoints.
- Create a basic node project for Nodejs
- Open the debugging panel on the left, select the name of the node project you want to debug, and add debugging configuration
![164670879220531[Summary of vomiting blood] Tips on debugging and using VSCode to double your development work efficiency [Summary of vomiting blood] Tips on debugging and using VSCode to double your development work efficiency](https://img.php.cn/upload/image/279/872/331/1646709588942290.png)
- Select the debugging project type as Node.js
![164670879861601[Summary of vomiting blood] Tips on debugging and using VSCode to double your development work efficiency [Summary of vomiting blood] Tips on debugging and using VSCode to double your development work efficiency](https://img.php.cn/upload/image/279/872/331/1646709588942290.png)
- Open the generated .vscode/launch. json file, specify the program entry file
program field is used to specify your program entry file, ${workspaceFolder} represents the current project root path
![164670880212187[Summary of vomiting blood] Tips on debugging and using VSCode to double your development work efficiency [Summary of vomiting blood] Tips on debugging and using VSCode to double your development work efficiency](https://img.php.cn/upload/image/279/872/331/1646709588942290.png)
- To add a breakpoint in the program, just click on the sidebar on the left to add a breakpoint
![164670880890986[Summary of vomiting blood] Tips on debugging and using VSCode to double your development work efficiency [Summary of vomiting blood] Tips on debugging and using VSCode to double your development work efficiency](https://img.php.cn/upload/image/279/872/331/1646709588942290.png)
- Press
F5to start debugging. If debugging is successful, there will be a floating window operation bar.
![16467088126363[Summary of vomiting blood] Tips on debugging and using VSCode to double your development work efficiency [Summary of vomiting blood] Tips on debugging and using VSCode to double your development work efficiency](https://img.php.cn/upload/image/279/872/331/1646709588942290.png)
The operation button functions of the floating window are in sequence. For:
- Continue (
F5), - Debug next step (
F10), - Single step jump Enter (
F11), - Single step out (
Shift F11), - Redebug (
Ctrl Shift F5) , - End debugging (
Shift F5)
Log breakpoint
Log breakpoint is a variant of ordinary breakpoint. The difference is that will not interrupt debugging , but can log information to the console. Log breakpoints are particularly useful when debugging services that cannot be paused or stopped. Proceed as follows:
- Steps to add a log breakpoint
![164670881772604[Summary of vomiting blood] Tips on debugging and using VSCode to double your development work efficiency [Summary of vomiting blood] Tips on debugging and using VSCode to double your development work efficiency](https://img.php.cn/upload/image/279/872/331/1646709588942290.png)
- Enter the information to be logged and click Enter to complete the addition
You can use {} to use variables, for example Add a log breakpoint here, the value of b is ${b}
![164670882273111[Summary of vomiting blood] Tips on debugging and using VSCode to double your development work efficiency [Summary of vomiting blood] Tips on debugging and using VSCode to double your development work efficiency](https://img.php.cn/upload/image/279/872/331/1646709588942290.png)
- After the log breakpoint is added successfully, there will be a diamond icon
![164670882657138[Summary of vomiting blood] Tips on debugging and using VSCode to double your development work efficiency 1[Summary of vomiting blood] Tips on debugging and using VSCode to double your development work efficiency](https://img.php.cn/upload/image/279/872/331/1646709588942290.png)
- Press
F5Run to view debugging results
![164670883321793[Summary of vomiting blood] Tips on debugging and using VSCode to double your development work efficiency 1[Summary of vomiting blood] Tips on debugging and using VSCode to double your development work efficiency](https://img.php.cn/upload/image/279/872/331/1646709588942290.png)
Expression conditional breakpoint
Conditional breakpoint is when the expression result is true Breakpoints will be made, the steps are as follows:
- Right-click on the left side of the code line, you can also add a breakpoint, select add conditional breakpoint here
![164670958419309[Summary of vomiting blood] Tips on debugging and using VSCode to double your development work efficiency 1[Summary of vomiting blood] Tips on debugging and using VSCode to double your development work efficiency](https://img.php.cn/upload/image/279/872/331/1646709588942290.png)
- Fill in the expression and press Enter
![1646709588942290.png 1[Summary of vomiting blood] Tips on debugging and using VSCode to double your development work efficiency](https://img.php.cn/upload/image/279/872/331/1646709588942290.png)
- The small icon added successfully is as follows
![164670959390625[Summary of vomiting blood] Tips on debugging and using VSCode to double your development work efficiency 1[Summary of vomiting blood] Tips on debugging and using VSCode to double your development work efficiency](https://img.php.cn/upload/image/798/456/642/1646709675917390.png)
- Press
F5to debug, the condition is established, so the breakpoint is hit
![16467095994463[Summary of vomiting blood] Tips on debugging and using VSCode to double your development work efficiency 1[Summary of vomiting blood] Tips on debugging and using VSCode to double your development work efficiency](https://img.php.cn/upload/image/798/456/642/1646709675917390.png)
- Select the conditional breakpoint, switch to the number of hits option, fill in the number of hits
![164670960637088[Summary of vomiting blood] Tips on debugging and using VSCode to double your development work efficiency 1[Summary of vomiting blood] Tips on debugging and using VSCode to double your development work efficiency](https://img.php.cn/upload/image/798/456/642/1646709675917390.png)
- The successful completion is as follows As shown in the picture
![164670961339653[Summary of vomiting blood] Tips on debugging and using VSCode to double your development work efficiency 1[Summary of vomiting blood] Tips on debugging and using VSCode to double your development work efficiency](https://img.php.cn/upload/image/798/456/642/1646709675917390.png)
- Press
- F5
to debug, as shown in the picture, it will interrupt when the index is 9
![164670961812898[Summary of vomiting blood] Tips on debugging and using VSCode to double your development work efficiency 1[Summary of vomiting blood] Tips on debugging and using VSCode to double your development work efficiency](https://img.php.cn/upload/image/798/456/642/1646709675917390.png)
- Press
- Shift F9
![164670962779761[Summary of vomiting blood] Tips on debugging and using VSCode to double your development work efficiency [Summary of vomiting blood] Tips on debugging and using VSCode to double your development work efficiency](https://img.php.cn/upload/image/798/456/642/1646709675917390.png)
- at the specified location. After debugging, each time Code running to this inline will be interrupted
![16467096333950[Summary of vomiting blood] Tips on debugging and using VSCode to double your development work efficiency 2[Summary of vomiting blood] Tips on debugging and using VSCode to double your development work efficiency](https://img.php.cn/upload/image/798/456/642/1646709675917390.png)
- The data panel can view all variables
![16467096385371[Summary of vomiting blood] Tips on debugging and using VSCode to double your development work efficiency 2[Summary of vomiting blood] Tips on debugging and using VSCode to double your development work efficiency](https://img.php.cn/upload/image/798/456/642/1646709675917390.png)
- Right-click on the variable to set the variable value, copy the variable value and other operations
![164670964470325[Summary of vomiting blood] Tips on debugging and using VSCode to double your development work efficiency 2[Summary of vomiting blood] Tips on debugging and using VSCode to double your development work efficiency](https://img.php.cn/upload/image/798/456/642/1646709675917390.png)
- When focusing on the data panel, you can search and filter by typing values. Click the button shown below to control whether to filter.
![164670965090581[Summary of vomiting blood] Tips on debugging and using VSCode to double your development work efficiency 2[Summary of vomiting blood] Tips on debugging and using VSCode to double your development work efficiency](https://img.php.cn/upload/image/798/456/642/1646709675917390.png)
![164670965591179[Summary of vomiting blood] Tips on debugging and using VSCode to double your development work efficiency 2[Summary of vomiting blood] Tips on debugging and using VSCode to double your development work efficiency](https://img.php.cn/upload/image/798/456/642/1646709675917390.png)
- Add variables to the monitoring panel by right-clicking on the variable panel and selecting "Add to Monitoring"
![164670965913904[Summary of vomiting blood] Tips on debugging and using VSCode to double your development work efficiency 2[Summary of vomiting blood] Tips on debugging and using VSCode to double your development work efficiency](https://img.php.cn/upload/image/798/456/642/1646709675917390.png)
- You can also directly Select the Add button in the monitoring panel to add variables
![164670966578223[Summary of vomiting blood] Tips on debugging and using VSCode to double your development work efficiency 2[Summary of vomiting blood] Tips on debugging and using VSCode to double your development work efficiency](https://img.php.cn/upload/image/798/456/642/1646709675917390.png)
- After adding variables, you can monitor changes in variables in real time
![164670967026991[Summary of vomiting blood] Tips on debugging and using VSCode to double your development work efficiency 2[Summary of vomiting blood] Tips on debugging and using VSCode to double your development work efficiency](https://img.php.cn/upload/image/798/456/642/1646709675917390.png)
补充知识点:调试服务器时打开一个URI
开发 Web 程序通常需要在 Web 浏览器中打开特定 URL,以便在调试器中访问服务器代码。VS Code 有一个内置功能“ serverReadyAction ”来自动化这个任务。
- 一段简单的server代码
var express = require('express');
var app = express();

app.get('/', function(req, res) {
  res.send('Hello World!');
});

app.listen(3000, function() {
  console.log('Example app listening on port 3000!');
});- 配置launch.json,以支持打开URI
{
  "type": "node",
  "request": "launch",
  "name": "Launch Program",
  "program": "${workspaceFolder}/app.js",

  "serverReadyAction": {
    "pattern": "listening on port ([0-9]+)",
    "uriFormat": "http://localhost:%s",
    "action": "openExternally"
  }
}pattern是设置匹配的程度端口号,端口号放在小括号内,即作为一个正则的捕获组使用。uriFormat映射为URI,其中%s使用pattern中的第一个捕获组替换。最后使用该URI作为外部程序打开的URI。
- 按
F5调试,会自动打开浏览器,且会在下图所示处中断,当继续执行后,浏览器才能看到输出了server的内容
![1646709675917390.png 2[Summary of vomiting blood] Tips on debugging and using VSCode to double your development work efficiency](https://img.php.cn/upload/image/798/456/642/1646709675917390.png)
终局:各场景调试实战
调试NodeJS项目
关于NodeJs项目的调试方法,已经在上述的断点的基本使用部分做了介绍,可以网上滚动翻阅。
调试Typescript项目
调试TS项目前,先创建一个TS项目
- 先初始化一个ts程序,生成默认的
tsconfig.json文件
# 终端运行
tsc --init
Copy after login- 打开
tsconfig.json文件,开启sourceMap选项和指定编译后输出的路径
VS Code 内置了对 Ts 调试的支持。为了支持调试 Ts 与正在执行的 Js 代码相结合,VS Code 依赖于调试器的source map在 Ts 源代码和正在运行的 Js 之间进行映射,所以需要需要开启
sourceMap选项。{ "sourceMap": true, "outDir": "./out" }Copy after login- 新建index.ts文件,写一个基本的ts代码
const num: number = 123;
console.log(num);

function fn(arg: string): void {
  console.log('fn', arg);
}

fn("Hello");
Copy after login- 先初始化一个ts程序,生成默认的
手动编译调试TS
在上述的ts基本项目中:
- 终端执行ts的编译命令
tsc
![164670970630604[Summary of vomiting blood] Tips on debugging and using VSCode to double your development work efficiency [Summary of vomiting blood] Tips on debugging and using VSCode to double your development work efficiency](/static/imghw/default1.png)
- 此时可以看到生成了out文件夹,里面包含一个
index.js和一个index.js.map文件
![164670971564666[Summary of vomiting blood] Tips on debugging and using VSCode to double your development work efficiency 3[Summary of vomiting blood] Tips on debugging and using VSCode to double your development work efficiency](/static/imghw/default1.png)
- 在index.ts中随意添加一个断点
![164670972060729[Summary of vomiting blood] Tips on debugging and using VSCode to double your development work efficiency 3[Summary of vomiting blood] Tips on debugging and using VSCode to double your development work efficiency](/static/imghw/default1.png)
- 按
F5或者运行 -> 启动调试,此时可以看到可以正常debug调试
![164670972711453[Summary of vomiting blood] Tips on debugging and using VSCode to double your development work efficiency 3[Summary of vomiting blood] Tips on debugging and using VSCode to double your development work efficiency](/static/imghw/default1.png)
- 终端执行ts的编译命令
通过构建任务构建调试TS
- 按
Ctrl+Shift+B或选择终端 -> 运行生成任务,此时会弹出一个下拉菜单
![164670973398388[Summary of vomiting blood] Tips on debugging and using VSCode to double your development work efficiency 3[Summary of vomiting blood] Tips on debugging and using VSCode to double your development work efficiency](/static/imghw/default1.png)
- 选择
tsc构建选项,此时可以看到自动生成了编译文件
![164670973953206[Summary of vomiting blood] Tips on debugging and using VSCode to double your development work efficiency 3[Summary of vomiting blood] Tips on debugging and using VSCode to double your development work efficiency](/static/imghw/default1.png)
注意,如果你使用的是其他终端(比如
cmder)的话,有可能会生成不了,如下图所示,使用默认的powershell即可:![164670974523885[Summary of vomiting blood] Tips on debugging and using VSCode to double your development work efficiency 3[Summary of vomiting blood] Tips on debugging and using VSCode to double your development work efficiency](/static/imghw/default1.png)
- 调试的话和上述步骤一样,在有了编译后的文件后,按
F5即可
- 按
监视改变并实时编译
- 按
Ctrl + Shift + B选择监视选项,可以实时监视文件内容发生变化,重新编译
![164670975151343[Summary of vomiting blood] Tips on debugging and using VSCode to double your development work efficiency 3[Summary of vomiting blood] Tips on debugging and using VSCode to double your development work efficiency](/static/imghw/default1.png)
- 如下图所示,会实时编译
- 按
![1646709757834590.png 3[Summary of vomiting blood] Tips on debugging and using VSCode to double your development work efficiency](https://img.php.cn/upload/image/276/358/767/1646709757834590.png)
补充知识点:tasks配置文件的创建方式
- 方法1:点击
终端 -> 配置任务 -> 选择任务可以生成对应的tasks.json配置
![164671007552949[Summary of vomiting blood] Tips on debugging and using VSCode to double your development work efficiency 3[Summary of vomiting blood] Tips on debugging and using VSCode to double your development work efficiency](/static/imghw/default1.png)
![164671008039439[Summary of vomiting blood] Tips on debugging and using VSCode to double your development work efficiency [Summary of vomiting blood] Tips on debugging and using VSCode to double your development work efficiency](/static/imghw/default1.png)
- 方法2:点击
终端 -> 运行生成任务 -> 点击设置图标也可以生成对应的tasks.json配置
![16467100843586[Summary of vomiting blood] Tips on debugging and using VSCode to double your development work efficiency 4[Summary of vomiting blood] Tips on debugging and using VSCode to double your development work efficiency](/static/imghw/default1.png)
![164671009668000[Summary of vomiting blood] Tips on debugging and using VSCode to double your development work efficiency 4[Summary of vomiting blood] Tips on debugging and using VSCode to double your development work efficiency](/static/imghw/default1.png)
补充知识点:每次调试时重新编译
- 按上述的操作已经生成了task.json配置文件
{
	"version": "2.0.0",
	"tasks": [
    {
      "type": "typescript",
      "tsconfig": "tsconfig.json",
      "problemMatcher": [
        "$tsc"
      ],
      "group": "build",
      "label": "tsc: 构建 - tsconfig.json"
    }
  ]
}- 点击
运行 -> 添加配置 -> 选择nodejs
![164671010232067[Summary of vomiting blood] Tips on debugging and using VSCode to double your development work efficiency 4[Summary of vomiting blood] Tips on debugging and using VSCode to double your development work efficiency](/static/imghw/default1.png)
- 在生成的
launch.json文件中,添加preLaunchTask字段,值是tasks.json的label值,一定要相同,注意大小写。该字段的作用是在执行命令前先执行改task任务。
![164671010678702[Summary of vomiting blood] Tips on debugging and using VSCode to double your development work efficiency 4[Summary of vomiting blood] Tips on debugging and using VSCode to double your development work efficiency](/static/imghw/default1.png)
注意,如果编译后的js文件不在相应的位置,通过图中的outFiles字段可以指定ts编译后的js路径。
- 在
index.ts文件中按F5启动调试,可以看到调试前已经生成了编译文件,而后就可以正常调试了。
![164671011092693[Summary of vomiting blood] Tips on debugging and using VSCode to double your development work efficiency 4[Summary of vomiting blood] Tips on debugging and using VSCode to double your development work efficiency](/static/imghw/default1.png)
补充知识点:VsCode的TS版本说明
vscode本身内置了对ts的支持
vscode内置的ts版本(即工作区版本),仅仅用于IntelliSense(代码提示),工作区ts版本与用于编译的ts版本无任何关系。
修改工作区ts版本的方法:
- 在状态栏选择typescript的图标,选择版本切换
![164671013861211[Summary of vomiting blood] Tips on debugging and using VSCode to double your development work efficiency 4[Summary of vomiting blood] Tips on debugging and using VSCode to double your development work efficiency](/static/imghw/default1.png)
- 选择你需要的版本即可
![164671014249043[Summary of vomiting blood] Tips on debugging and using VSCode to double your development work efficiency 4[Summary of vomiting blood] Tips on debugging and using VSCode to double your development work efficiency](/static/imghw/default1.png)
![164671014654864[Summary of vomiting blood] Tips on debugging and using VSCode to double your development work efficiency 4[Summary of vomiting blood] Tips on debugging and using VSCode to double your development work efficiency](/static/imghw/default1.png)
调试html项目
学会了上述ts的调试后,我们尝试调试html文件,并且html文件中引入ts文件:
- 创建html,引入ts编译后的js文件
<!DOCTYPE html>
<html>
<head>
  <meta charset="UTF-8">
  <meta http-equiv="X-UA-Compatible" content="IE=edge">
  <meta name="viewport" content="width=device-width, initial-scale=1.0">
  <title>Document</title>
</head>
<body>
  <h3 id="Hello">Hello</h3>
  <script ></script>
</body>
</html>
- ts源文件如下:
const num: number =  1221;
console.log(num);

function fn(arg: string): void {
  console.log('fn', arg);
}

document.body.append('World')

fn("he");- 打debug
![164671015173588[Summary of vomiting blood] Tips on debugging and using VSCode to double your development work efficiency 4[Summary of vomiting blood] Tips on debugging and using VSCode to double your development work efficiency](https://img.php.cn/upload/image/407/693/213/1646710246233305.gif)
- launch.json启动命令配置
{
  // 使用 IntelliSense 了解相关属性。
  // 悬停以查看现有属性的描述。
  // 欲了解更多信息,请访问: https://go.microsoft.com/fwlink/?linkid=830387
  "version": "0.2.0",
  "configurations": [
    {
      "type": "pwa-chrome",
      "request": "launch",
      "name": "Launch Chrome",
      "url": "file:///E:/demo/vscode/debug/ts/index.html",
      "preLaunchTask": "tsc: 构建 - tsconfig.json",
      "webRoot": "${workspaceFolder}"
    }
  ]
}- 选择我们的启动命令
![164671015537207[Summary of vomiting blood] Tips on debugging and using VSCode to double your development work efficiency [Summary of vomiting blood] Tips on debugging and using VSCode to double your development work efficiency](https://img.php.cn/upload/image/407/693/213/1646710246233305.gif)
- 按
F5可以正常唤起chrome浏览器,并在vscode的ts源码处会有debug效果
调试Vue项目的两种方式
下面介绍两种调试vue2项目的3种方法,其他框架的调试也类似:
不使用vscode插件Debugger for chrome的方法
- 初始化vue项目,配置
vue.config.js,指定要生成sourceMaps资源
module.exports = {
  configureWebpack: {
    // 生成sourceMaps
    devtool: "source-map"
  }
};- 根目录下创建
./vscode/launch.json文件或者选择运行 -> 添加配置 -> Chrome
![164671015999556[Summary of vomiting blood] Tips on debugging and using VSCode to double your development work efficiency 5[Summary of vomiting blood] Tips on debugging and using VSCode to double your development work efficiency](https://img.php.cn/upload/image/407/693/213/1646710246233305.gif)
{
  "version": "0.2.0",
  "configurations": [
    {
      "type": "chrome",
      "request": "launch",
      "name": "vuejs: chrome",
      "url": "http://localhost:8080",
      "webRoot": "${workspaceFolder}",
      "breakOnLoad": true,
      "pathMapping": {
        "/_karma_webpack_": "${workspaceFolder}"
      },
      "sourceMapPathOverrides": {
        "webpack:/*": "${webRoot}/*",
        "/./*": "${webRoot}/*",
        "/src/*": "${webRoot}/*",
        "/*": "*",
        "/./~/*": "${webRoot}/node_modules/*"
      },
      "preLaunchTask": "serve"
    }
  ]
}- 添加任务脚本
{
  "version": "2.0.0",
  "tasks": [
    {
      "label": "serve",
      "type": "npm",
      "script": "serve",
      "isBackground": true,
      "problemMatcher": [
        {
          "base": "$tsc-watch",
          "background": {
            "activeOnStart": true,
            "beginsPattern": "Starting development server",
            "endsPattern": "Compiled successfully"
          }
        }
      ],
      "group": {
        "kind": "build",
        "isDefault": true
      }
    }
  ]
}该脚本的作用是运行npm run serve编译命令。
- 按
F5启动调试即可
注意:此方式的主要点在于launch.json配置文件中,通过preLaunchTask字段指定调试前先运行一个任务脚本,preLaunchTask的值对应tasks.json文件中的label值。
更多详细内容,大家可以点击这里的参考文档查阅。
https://github.com/microsoft/vscode-recipes/tree/main/vuejs-cli
借助vscode插件Debugger for Chrome在Chrome中调试
- 第一步还是初始化vue项目,添加
vue.config.js文件配置,指定要生成sourceMaps资源
module.exports = {
  configureWebpack: {
    // 生成sourceMaps
    devtool: "source-map"
  }
};- vscode中扩展中安装
Debugger for Chrome插件,并确保没有禁用插件
![164671016479835[Summary of vomiting blood] Tips on debugging and using VSCode to double your development work efficiency 5[Summary of vomiting blood] Tips on debugging and using VSCode to double your development work efficiency](https://img.php.cn/upload/image/407/693/213/1646710246233305.gif)
- 手动启动项目的运行, 此方式不需要配置
tasks.json任务
# 终端执行命令,启动项目
npm run serve
- 按
F5启动调试即可
![164671016815313[Summary of vomiting blood] Tips on debugging and using VSCode to double your development work efficiency 5[Summary of vomiting blood] Tips on debugging and using VSCode to double your development work efficiency](https://img.php.cn/upload/image/407/693/213/1646710246233305.gif)
更多详细内容,请点击这里的参考文档查阅。
https://vuejs.org/v2/cookbook/debugging-in-vscode.html
借助vscode插件Debugger for Firfox在Firefox中调试
- 和
Debugger for Chrome基本一样,区别在于安装Debugger for Firfox插件,并在launch.json配置中,增加调试Firefox的配置即可,配置如下
{
  "version": "0.2.0",
  "configurations": [
    // 省略Chrome的配置...
    // 下面添加的Firefox的配置
    {
      "type": "firefox",
      "request": "launch",
      "reAttach": true,
      "name": "vuejs: firefox",
      "url": "http://localhost:8080",
      "webRoot": "${workspaceFolder}/src",
      "pathMappings": [{ "url": "webpack:///src/", "path": "${webRoot}/" }]
    }
  ]
}- 调试时选择对应的调试命令即可
![164671017874178[Summary of vomiting blood] Tips on debugging and using VSCode to double your development work efficiency 5[Summary of vomiting blood] Tips on debugging and using VSCode to double your development work efficiency](https://img.php.cn/upload/image/407/693/213/1646710246233305.gif)
Firefox初始启动时不会触发调试,需要刷新一次
调试Electron项目
Electron很多人都使用过,主要用于开发跨平台的系统桌面应用。那么来看下vue-cli-electron-builder创建的Electron项目怎么调试。步骤如下:
- 在初始化项目后,首先修改
vue.config.js文件配置,增加sourceMaps配置:
module.exports = {
  configureWebpack: {
    devtool: 'source-map'
  }
}- 创建调试配置
.vscode/launch.json
{
  "version": "0.2.0",
  "configurations": [
    {
      "name": "Electron: Main",
      "type": "node",
      "request": "launch",
      "protocol": "inspector",
      "preLaunchTask": "bootstarp-service",
      "runtimeExecutable": "${workspaceRoot}/node_modules/.bin/electron",
      "windows": {
        "runtimeExecutable": "${workspaceRoot}/node_modules/.bin/electron.cmd"
      },
      "args": ["--remote-debugging-port=9223", "./dist_electron"],
      "outFiles": ["${workspaceFolder}/dist_electron/**/*.js"]
    },
    {
      "name": "Electron: Renderer",
      "type": "chrome",
      "request": "attach",
      "port": 9223,
      "urlFilter": "http://localhost:*",
      "timeout": 0,
      "webRoot": "${workspaceFolder}/src",
      "sourceMapPathOverrides": {
        "webpack:///./src/*": "${webRoot}/*"
      }
    },
  ],
  "compounds": [
    {
      "name": "Electron: All",
      "configurations": ["Electron: Main", "Electron: Renderer"]
    }
  ]
}此处配置了两个调试命令: Electron: Main用于调试主进程,Electron: Renderer用于调试渲染进程;compounds[].选项用于定义复合调试选项; configurations定义的复合命令是并行的; preLaunchTask用于配置命令执行前先执行的任务脚本,其值对应tasks.json中的label字段; preLaunchTask用在compounds时,用于定义configurations复合任务执行前先执行的脚本。
- 创建任务脚本
{
  // See https://go.microsoft.com/fwlink/?LinkId=733558
  // for the documentation about the tasks.json format
  "version": "2.0.0",
  "tasks": [
    {
      "label": "bootstarp-service",
      "type": "process",
      "command": "./node_modules/.bin/vue-cli-service",
      "windows": {
        "command": "./node_modules/.bin/vue-cli-service.cmd",
        "options": {
          "env": {
            "VUE_APP_ENV": "dev",
            "VUE_APP_TYPE": "local"
          }
        }
      },
      "isBackground": true,
      "args": [
        "electron:serve", "--debug"
      ],
      "problemMatcher": {
        "owner": "custom",
        "pattern": {
          "regexp": ""
        },
        "background": {
          "beginsPattern": "Starting development server\\.\\.\\.",
          "endsPattern": "Not launching electron as debug argument was passed\\."
        }
      }
    }
  ]
}- 启动调试
在主进程相关代码上打上断点,然后启动调试主进程命令就可以调试主进程了
![164671018483126[Summary of vomiting blood] Tips on debugging and using VSCode to double your development work efficiency 5[Summary of vomiting blood] Tips on debugging and using VSCode to double your development work efficiency](https://img.php.cn/upload/image/407/693/213/1646710246233305.gif)
注意,这里的options参数是根据实际的情况,自定义添加我们运行项目时所需要的参数,比如我这里因为启动项目的npm命令是:
"serve-local:dev": "cross-env VUE_APP_TYPE=local VUE_APP_ENV=dev vue-cli-service electron:serve"
- 主进程调试成功
![164671019120761[Summary of vomiting blood] Tips on debugging and using VSCode to double your development work efficiency 5[Summary of vomiting blood] Tips on debugging and using VSCode to double your development work efficiency](https://img.php.cn/upload/image/407/693/213/1646710246233305.gif)
- 开始调试渲染进程
切换到渲染进程的调试选项,在渲染进程的代码处打上断点,点击调试。注意,此时并不会有断点终端,需要ctrl+r手动刷新软件进程才会看到渲染进程的断点。
![164671019818176[Summary of vomiting blood] Tips on debugging and using VSCode to double your development work efficiency 5[Summary of vomiting blood] Tips on debugging and using VSCode to double your development work efficiency](https://img.php.cn/upload/image/407/693/213/1646710246233305.gif)
- 刷新渲染进程后的效果,如下图,已经进入了断点
![164671020361823[Summary of vomiting blood] Tips on debugging and using VSCode to double your development work efficiency 5[Summary of vomiting blood] Tips on debugging and using VSCode to double your development work efficiency](https://img.php.cn/upload/image/407/693/213/1646710246233305.gif)
- 另一种方式
同时开启渲染进程和主进程的调试,只需要切换到调试全部的选项即可。注意,此种方式因为compounds[].configurations配置是并行执行的,并不一定能保证渲染进程调试一定能附加到主进程调试成功(估计是时机问题),有些时候会调试渲染进程不成功。所以,可以采取上面的方式进行调试。
![164671020843515[Summary of vomiting blood] Tips on debugging and using VSCode to double your development work efficiency 5[Summary of vomiting blood] Tips on debugging and using VSCode to double your development work efficiency](https://img.php.cn/upload/image/407/693/213/1646710246233305.gif)
更多调试Electron的内容,可以点击参考文档查阅。
https://nklayman.github.io/vue-cli-plugin-electron-builder/guide/recipes.html#debugging-with-vscode

补充:更进一步:
VS调试React app文档(https://medium.com/@auchenberg/live-edit-and-debug-your-react-apps-directly-from-vs-code-without-leaving-the-editor-3da489ed905f)
VS调试Next.js文档(https://github.com/microsoft/vscode-recipes/tree/main/Next-js)
更多...(https://code.visualstudio.com/docs/nodejs/debugging-recipes)
其他技巧
技巧一:代码片段(snippets)
从扩展商店中安装snippets
@category:"snippets"
![164671021770723[Summary of vomiting blood] Tips on debugging and using VSCode to double your development work efficiency [Summary of vomiting blood] Tips on debugging and using VSCode to double your development work efficiency](https://img.php.cn/upload/image/407/693/213/1646710246233305.gif)
创建全局代码片段
- 选择
文件 -> 首选项 -> 用户片段 - 选择
新建全局代码片段文件
![164671022241583[Summary of vomiting blood] Tips on debugging and using VSCode to double your development work efficiency 6[Summary of vomiting blood] Tips on debugging and using VSCode to double your development work efficiency](https://img.php.cn/upload/image/407/693/213/1646710246233305.gif)
添加代码片段文件的文件名称,会生成
.code-snippets后缀的文件定义用户片段
{
  "自动补全console.log": {
    "scope": "javascript,typescript",
      "prefix": "log",
      "body": [
        "console.log('$1');",
        "$2"
      ],
    "description": "输出console.log('')"
  }
}| 关键词 | 类型 | 说明 |
|---|---|---|
| scope | string | 代码片段生效的作用域,可以是多个语言,比如javascript,typescript表示在js和ts生效,不加scope字段表示对所有文件类型生效 |
| prefix | `string | string[]` |
| body | string[] | 代码片段内容,数组的每一项会是一行 |
| description | string | IntelliSense 显示的片段的可选描述 |
| n | - | 定义光标的位置,光标根据数字大小按tab依次跳转;注意$0是特殊值,表示光标退出的位置,是最后的光标位置。 |
- 在键盘输入
log时效果如下
![164671022814694[Summary of vomiting blood] Tips on debugging and using VSCode to double your development work efficiency 6[Summary of vomiting blood] Tips on debugging and using VSCode to double your development work efficiency](https://img.php.cn/upload/image/407/693/213/1646710246233305.gif)
- 指定光标处的默认值并选中
"body": [
  "console.log('${1:abc}');"
],![164671023387234[Summary of vomiting blood] Tips on debugging and using VSCode to double your development work efficiency 6[Summary of vomiting blood] Tips on debugging and using VSCode to double your development work efficiency](https://img.php.cn/upload/image/407/693/213/1646710246233305.gif)
- 指定光标处的默认值有多个,并提供下拉选择
用两个竖线包含多个选择值,|多个选择值直接用逗号隔开|
"body": [
  "console.log('${1:abc}');",
  "${2|aaa,bbb,ccc|}"
],![164671023748759[Summary of vomiting blood] Tips on debugging and using VSCode to double your development work efficiency 6[Summary of vomiting blood] Tips on debugging and using VSCode to double your development work efficiency](https://img.php.cn/upload/image/407/693/213/1646710246233305.gif)
新建当前工作区的代码片段
只需要选择文件 -> 首选项 -> 用户片段 -> 新建xxx文件夹的代码片段, 新建后会在当前工作区生成.vscode/xxx.code-snippets文件
![164671024225034[Summary of vomiting blood] Tips on debugging and using VSCode to double your development work efficiency 6[Summary of vomiting blood] Tips on debugging and using VSCode to double your development work efficiency](https://img.php.cn/upload/image/407/693/213/1646710246233305.gif)
技巧二:Emmet
vscode内置了对Emmet的支持,无需额外扩展。例如html的Emmet演示如下:
![1646710246233305.gif [Summary of vomiting blood] Tips on debugging and using VSCode to double your development work efficiency](https://img.php.cn/upload/image/407/693/213/1646710246233305.gif)
技巧三:对光标处代码变量快速重命名
选中或者光标所处的位置,按F2可以对所有的变量重命名
技巧四:代码重构建议
- 选中要重构的代码,点击出现的黄色小灯的图标
- 选中重构的类型
- 输入新的变量名
- 还可以重构到函数
- TS中还可以提取接口等等
补充:VsCode扩展插件开发
VsCode扩展插件可以做什么事情?
- 定制主题、文件图标
- 扩展工作台功能
- 创建webView
- 自定义新的语言提示
- 支持调试特定的runtime
基于Yeoman快速开发VsCode插件,步骤如下:
- 安装
Yeoman和用于生成模板的插件VS Code Extension Generator(https://www.npmjs.com/package/generator-code)
# 终端运行,主要node版本需要12及以上,node10会安装报错
npm i -g yo generator-code
- 运行
yo code创建命令,选择要生成的项目模板。这里演示New extension
- 根据提示依次选择
- 生成的内容如下
- 按
F5生成编译项目,此时会自动打开一个新窗口 - 在新窗口按
Ctrl+Shfit+P,输入Hello World命令
- 此时会弹出一个弹窗的效果
- 至此,一个最简单的插件就完成了
更多关于VSCode的相关知识,请访问:vscode教程!!
The above is the detailed content of [Summary of vomiting blood] Tips on debugging and using VSCode to double your development work efficiency. For more information, please follow other related articles on the PHP Chinese website!

Hot AI Tools

Undresser.AI Undress
AI-powered app for creating realistic nude photos

AI Clothes Remover
Online AI tool for removing clothes from photos.

Undress AI Tool
Undress images for free

Clothoff.io
AI clothes remover

AI Hentai Generator
Generate AI Hentai for free.

Hot Article

Hot Tools

Notepad++7.3.1
Easy-to-use and free code editor

SublimeText3 Chinese version
Chinese version, very easy to use

Zend Studio 13.0.1
Powerful PHP integrated development environment

Dreamweaver CS6
Visual web development tools

SublimeText3 Mac version
God-level code editing software (SublimeText3)

Hot Topics
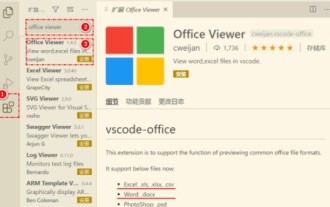 How to view word documents in vscode How to view word documents in vscode
May 09, 2024 am 09:37 AM
First, open the vscode software on the computer, click the [Extension] icon on the left, as shown in ① in the figure. Then, enter [officeviewer] in the search box of the extension interface, as shown in ② in the figure. Then, from the search Select [officeviewer] to install in the results, as shown in ③ in the figure. Finally, open the file, such as docx, pdf, etc., as shown below
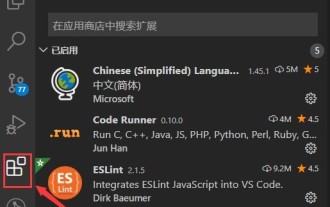 How to draw a flow chart with vscode_How to draw a flow chart with visual_studio code
Apr 23, 2024 pm 02:13 PM
First, open visual studio code on the computer, click the four square buttons on the left, then enter draw.io in the search box to query the plug-in, click Install. After installation, create a new test.drawio file, then select the test.drawio file, enter the editing mode on the left There are various graphics on the side. You can draw the flow chart by selecting at will. After drawing, click File → Embed → svg and then select Embed. Copy the svg code. Paste the copied svg code into the html code. Open the html web page and you can see it. Click on the picture on the web page to jump to the flow chart. On this page, you can zoom in and out of the flow chart. Here, we choose to click on the pencil pattern in the lower right corner to jump to the web page.
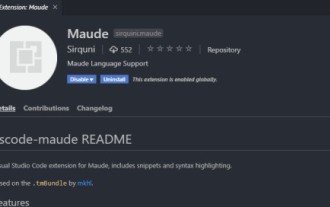 How to write Maude in Vscode_How to write Maude in Vscode
Apr 23, 2024 am 10:25 AM
First, you can search for the Maude plug-in in the vscode plug-in manager. Then, create a new file with the extension maude to use maude's code snippets and syntax highlighting. Terminal -> New Terminal can open the vscode built-in terminal in the current folder to run the maude or full-maude program. In maude's official tutorial, there are also examples of http clients, which can be called and run as shown in the figure. If you want to associate files with the fm extension, open settings, search for fileassociations in user settings, and open settings.json. Just add an entry to the file association, that is, the entry from *.fm to maude. But full
 Caltech Chinese use AI to subvert mathematical proofs! Speed up 5 times shocked Tao Zhexuan, 80% of mathematical steps are fully automated
Apr 23, 2024 pm 03:01 PM
LeanCopilot, this formal mathematics tool that has been praised by many mathematicians such as Terence Tao, has evolved again? Just now, Caltech professor Anima Anandkumar announced that the team released an expanded version of the LeanCopilot paper and updated the code base. Image paper address: https://arxiv.org/pdf/2404.12534.pdf The latest experiments show that this Copilot tool can automate more than 80% of the mathematical proof steps! This record is 2.3 times better than the previous baseline aesop. And, as before, it's open source under the MIT license. In the picture, he is Song Peiyang, a Chinese boy. He is
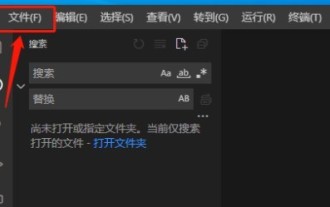 How to enable background updates in vscode How to enable background updates in vscode
May 09, 2024 am 09:52 AM
1. First, after opening the interface, click the file menu in the upper left corner. 2. Then, click the settings button in the preferences column. 3. Then, in the settings page that jumps, find the update section. 4. Finally, click the mouse to check and enable it. Download and install the new VSCode version button in the background on Windows and restart the program.
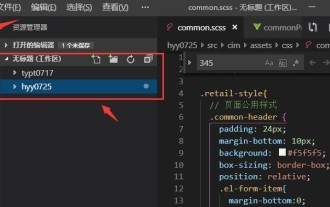 How to add files to vscode workspace How to add files to vscode workspace
May 09, 2024 am 09:43 AM
1. First, open the vscode software, click the explorer icon, and find the workspace window 2. Then, click the file menu in the upper left corner and find the add folder to workspace option 3. Finally, find the folder location in the local disk , click the add button
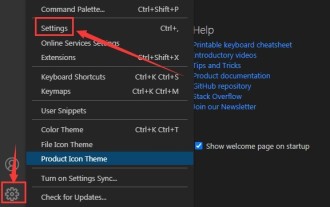 How to disable wsl configuration file in vscode How to disable wsl configuration file in vscode
May 09, 2024 am 10:30 AM
1. First, open the settings option in the settings menu. 2. Then, find the terminal column in the commonly used page. 3. Finally, uncheck the usewslprofiles button on the right side of the column.
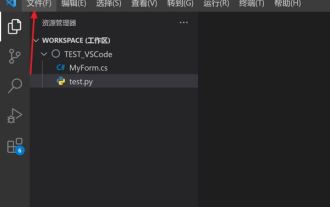 How to set animation smooth insertion in VScode VScode tutorial to set animation smooth insertion
May 09, 2024 am 09:49 AM
1. First, after opening the interface, click the workspace interface 2. Then, in the open editing panel, click the File menu 3. Then, click the Settings button under the Preferences column 4. Finally, click the mouse to check the CursorSmoothCaretAnimation button and save Just set it


![164671025085411[Summary of vomiting blood] Tips on debugging and using VSCode to double your development work efficiency 6[Summary of vomiting blood] Tips on debugging and using VSCode to double your development work efficiency](https://img.php.cn/upload/image/996/784/698/164671025085411[Summary of vomiting blood] Tips on debugging and using VSCode to double your development work efficiency)
![164671025458069[Summary of vomiting blood] Tips on debugging and using VSCode to double your development work efficiency 6[Summary of vomiting blood] Tips on debugging and using VSCode to double your development work efficiency](https://img.php.cn/upload/image/415/997/279/164671025458069[Summary of vomiting blood] Tips on debugging and using VSCode to double your development work efficiency)
![164671025854020[Summary of vomiting blood] Tips on debugging and using VSCode to double your development work efficiency 6[Summary of vomiting blood] Tips on debugging and using VSCode to double your development work efficiency](https://img.php.cn/upload/image/288/699/361/164671025854020[Summary of vomiting blood] Tips on debugging and using VSCode to double your development work efficiency)
![164671026753496[Summary of vomiting blood] Tips on debugging and using VSCode to double your development work efficiency [Summary of vomiting blood] Tips on debugging and using VSCode to double your development work efficiency](https://img.php.cn/upload/image/615/425/822/164671026753496[Summary of vomiting blood] Tips on debugging and using VSCode to double your development work efficiency)
![164671027271686[Summary of vomiting blood] Tips on debugging and using VSCode to double your development work efficiency 7[Summary of vomiting blood] Tips on debugging and using VSCode to double your development work efficiency](https://img.php.cn/upload/image/660/970/670/164671027271686[Summary of vomiting blood] Tips on debugging and using VSCode to double your development work efficiency)
![164671027636026[Summary of vomiting blood] Tips on debugging and using VSCode to double your development work efficiency 7[Summary of vomiting blood] Tips on debugging and using VSCode to double your development work efficiency](https://img.php.cn/upload/image/580/653/477/164671027636026[Summary of vomiting blood] Tips on debugging and using VSCode to double your development work efficiency)
![164671028235564[Summary of vomiting blood] Tips on debugging and using VSCode to double your development work efficiency 7[Summary of vomiting blood] Tips on debugging and using VSCode to double your development work efficiency](https://img.php.cn/upload/image/480/211/608/164671028235564%5BSummary%20of%20vomiting%20blood%5D%20Tips%20on%20debugging%20and%20using%20VSCode%20to%20double%20your%20development%20work%20efficiency)
![164671028870399[Summary of vomiting blood] Tips on debugging and using VSCode to double your development work efficiency 7[Summary of vomiting blood] Tips on debugging and using VSCode to double your development work efficiency](https://img.php.cn/upload/image/593/673/386/164671028870399%5BSummary%20of%20vomiting%20blood%5D%20Tips%20on%20debugging%20and%20using%20VSCode%20to%20double%20your%20development%20work%20efficiency)
![164671029438666[Summary of vomiting blood] Tips on debugging and using VSCode to double your development work efficiency 7[Summary of vomiting blood] Tips on debugging and using VSCode to double your development work efficiency](https://img.php.cn/upload/image/625/783/758/164671029438666%5BSummary%20of%20vomiting%20blood%5D%20Tips%20on%20debugging%20and%20using%20VSCode%20to%20double%20your%20development%20work%20efficiency)
![16467103008360[Summary of vomiting blood] Tips on debugging and using VSCode to double your development work efficiency 7[Summary of vomiting blood] Tips on debugging and using VSCode to double your development work efficiency](https://img.php.cn/upload/image/971/407/525/16467103008360%5BSummary%20of%20vomiting%20blood%5D%20Tips%20on%20debugging%20and%20using%20VSCode%20to%20double%20your%20development%20work%20efficiency)
![164671030469332[Summary of vomiting blood] Tips on debugging and using VSCode to double your development work efficiency 7[Summary of vomiting blood] Tips on debugging and using VSCode to double your development work efficiency](https://img.php.cn/upload/image/102/781/201/164671030469332%5BSummary%20of%20vomiting%20blood%5D%20Tips%20on%20debugging%20and%20using%20VSCode%20to%20double%20your%20development%20work%20efficiency)


