
 Backend Development
Python Tutorial
In-depth understanding of Python data processing and visualization
Backend Development
Python Tutorial
In-depth understanding of Python data processing and visualization
In-depth understanding of Python data processing and visualization

This article brings you relevant knowledge about python, which mainly introduces related issues about data processing and visualization, including the preliminary use of NumPy, the use of Matplotlib package and data statistics Visual display, etc. I hope it will be helpful to everyone.

Recommended learning: python tutorial
1. Preliminary use of NumPy
Tables are general representations of data form, but it is incomprehensible to the machine, that is, it is unrecognizable data, so we need to adjust the form of the table.
The commonly used machine learning representation is a data matrix. 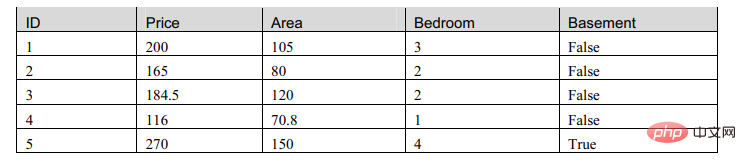
We observed this table and found that there are two types of attributes in the matrix, one is numeric type and the other is Boolean type. So we will now build a model to describe this table:
#  数据的矩阵化import numpy as np
data = np.mat([[1,200,105,3,False],[2,165,80,2,False],[3,184.5,120,2,False],
              [4,116,70.8,1,False],[5,270,150,4,True]])row = 0for line in data:
    row += 1print( row )print(data.size)print(data)
The first line of code here means introducing NumPy and renaming it to np. In the second line, we use the mat() method in NumPy to create a data matrix, and row is the variable introduced to calculate the number of rows.
The size here means a table of 5*5. You can see the data by printing the data directly: 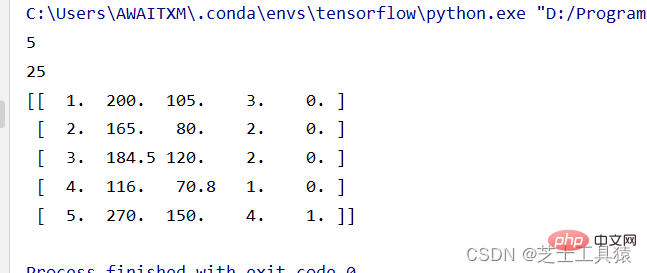
2. Use of Matplotlib package – graphical data processing
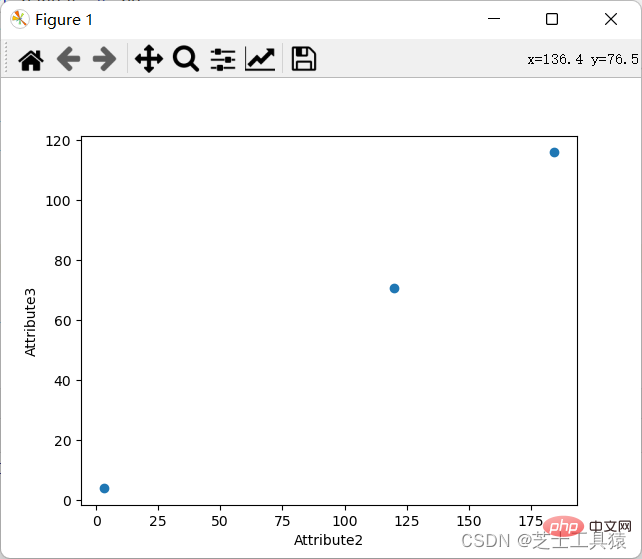
Let’s still look at the top table. The second column is the difference in housing prices. It is not easy to see the difference intuitively (because there are only numbers), so we hope to draw it (Research The method for numerical differences and anomalies is to draw the distribution of data ):
import numpy as npimport scipy.stats as statsimport pylab
data =  np.mat([[1,200,105,3,False],[2,165,80,2,False],[3,184.5,120,2,False],
              [4,116,70.8,1,False],[5,270,150,4,True]])coll = []for row in data:
    coll.append(row[0,1])stats.probplot(coll,plot=pylab)pylab.show()
The result of this code is to generate a graph: 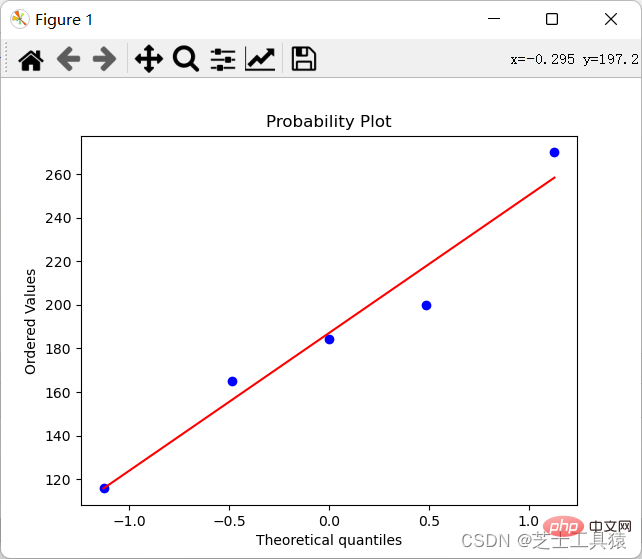
So that we can clearly see it There is a difference.
The requirement for a coordinate chart is to show the specific values of data through different rows and columns.
Of course, we can also display the coordinate diagram: 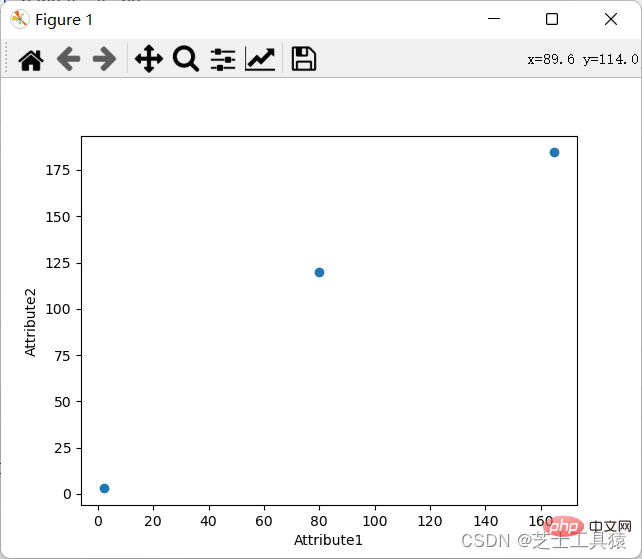
3. Deep learning theoretical method – similarity calculation (can be skipped)
Similarity There are many calculation methods, and we choose the two most commonly used ones, namely Euclidean similarity and cosine similarity calculation.
1. Similarity calculation based on Euclidean distance
Euclidean distance is used to represent the true distance between two points in three-dimensional space. We all know the formula, but we rarely hear the name: 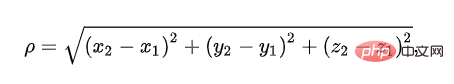
So let’s take a look at its practical application:
This table shows the ratings of items by three users: 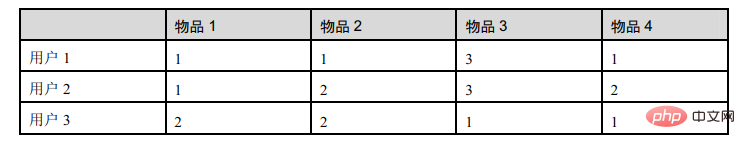
d12 represents the similarity between user 1 and user 2, then there is: 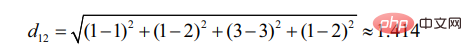
Similarly, d13: 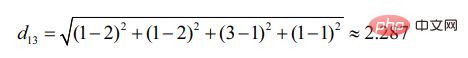
It can be seen that user 2 is more similar to User 1 (the smaller the distance, the greater the similarity).
2. Similarity calculation based on cosine angle
The starting point for the calculation of cosine angle is the difference in the included angle. 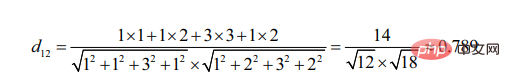
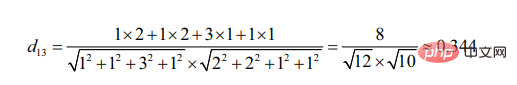
It can be seen that compared to user 3, user 2 is more similar to user 1 (the more similar the two targets are, the smaller the angle formed by their line segments)
4. Visual display of data statistics (taking precipitation in Bozhou City as an example)
Quartiles of data
Quartiles are the statistical median scores A kind of digit, that is, the data is arranged from small to large, and then divided into four equal parts. The data at the three dividing points is the quartile.
First quartile (Q1), also called lower quartile;
Second quartile (Q1), also called median;
Third quartile (Q1), also called lower quartile;
The gap between the third quartile and the first quartile is also called the four-point gap (IQR).
若n为项数,则:
Q1的位置 = (n+1)*0.25
Q2的位置 = (n+1)*0.50
Q3的位置 = (n+1)*0.75
四分位示例:
关于这个rain.csv,有需要的可以私我要文件,我使用的是亳州市2010-2019年的月份降水情况。
from pylab import *import pandas as pdimport matplotlib.pyplot as plot
filepath = ("C:\\Users\\AWAITXM\\Desktop\\rain.csv")# "C:\Users\AWAITXM\Desktop\rain.csv"dataFile = pd.read_csv(filepath)summary = dataFile.describe()print(summary)array = dataFile.iloc[:,:].values
boxplot(array)plot.xlabel("year")plot.ylabel("rain")show()以下是plot运行结果: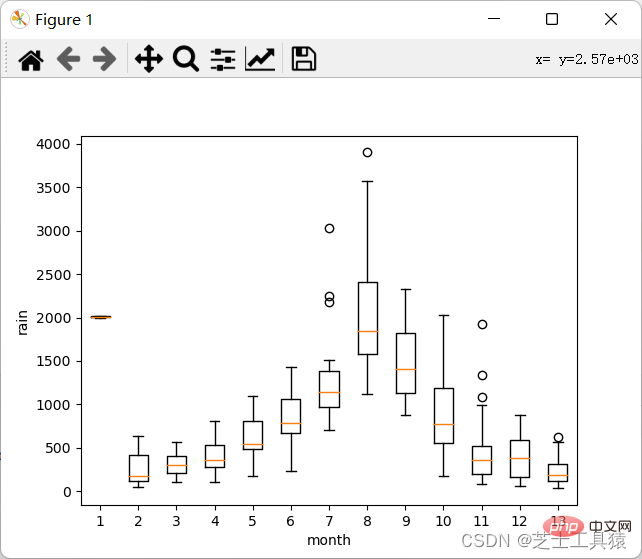
这个是pandas的运行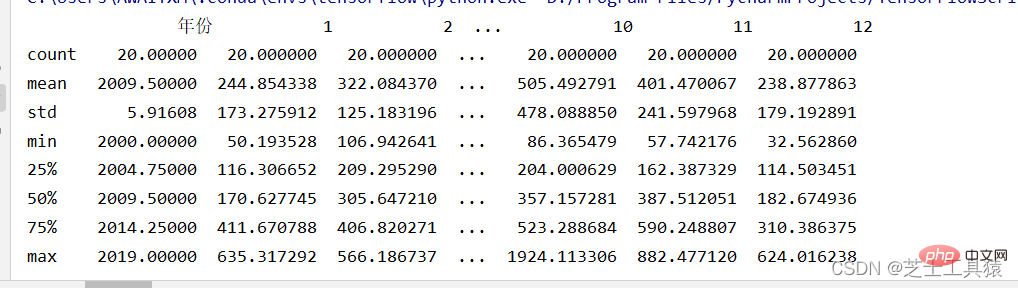
这里就可以很清晰的看出来数据的波动范围。
可以看出,不同月份的降水量有很大差距,8月最多,1-4月和10-12月最少。
那么每月的降水增减程度如何比较?
from pylab import *import pandas as pdimport matplotlib.pyplot as plot
filepath = ("C:\\Users\\AWAITXM\\Desktop\\rain.csv")# "C:\Users\AWAITXM\Desktop\rain.csv"dataFile = pd.read_csv(filepath)summary = dataFile.describe()minRings = -1maxRings = 99nrows = 11for i in range(nrows):
    dataRow = dataFile.iloc[i,1:13]
    labelColor = ( (dataFile.iloc[i,12] - minRings ) / (maxRings - minRings) )
dataRow.plot(color = plot.cm.RdYlBu(labelColor),alpha = 0.5)plot.xlabel("Attribute")plot.ylabel(("Score"))show()结果如图: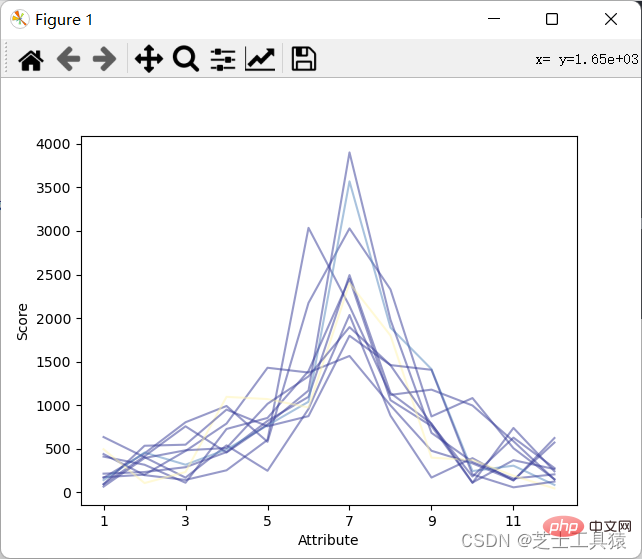
可以看出来降水月份并不规律的上涨或下跌。
那么每月降水是否相关?
from pylab import *import pandas as pdimport matplotlib.pyplot as plot
filepath = ("C:\\Users\\AWAITXM\\Desktop\\rain.csv")# "C:\Users\AWAITXM\Desktop\rain.csv"dataFile = pd.read_csv(filepath)summary = dataFile.describe()corMat = pd.DataFrame(dataFile.iloc[1:20,1:20].corr())plot.pcolor(corMat)plot.show()结果如图: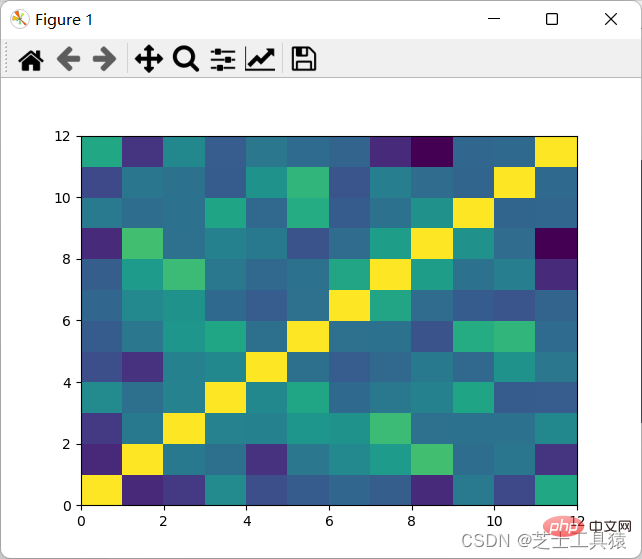
可以看出,颜色分布十分均匀,表示没有多大的相关性,因此可以认为每月的降水是独立行为。
今天就记录到这里了,我们下次再见!希望本文章对你也有所帮助。
推荐学习:python学习教程
The above is the detailed content of In-depth understanding of Python data processing and visualization. For more information, please follow other related articles on the PHP Chinese website!

Hot AI Tools

Undresser.AI Undress
AI-powered app for creating realistic nude photos

AI Clothes Remover
Online AI tool for removing clothes from photos.

Undress AI Tool
Undress images for free

Clothoff.io
AI clothes remover

AI Hentai Generator
Generate AI Hentai for free.

Hot Article
Hot Tools

Notepad++7.3.1
Easy-to-use and free code editor

SublimeText3 Chinese version
Chinese version, very easy to use

Zend Studio 13.0.1
Powerful PHP integrated development environment

Dreamweaver CS6
Visual web development tools

SublimeText3 Mac version
God-level code editing software (SublimeText3)
Hot Topics
 1385
1385
 52
52

 PHP and Python: Code Examples and Comparison
Apr 15, 2025 am 12:07 AM
PHP and Python: Code Examples and Comparison
Apr 15, 2025 am 12:07 AM
PHP and Python have their own advantages and disadvantages, and the choice depends on project needs and personal preferences. 1.PHP is suitable for rapid development and maintenance of large-scale web applications. 2. Python dominates the field of data science and machine learning.
 Python vs. JavaScript: Community, Libraries, and Resources
Apr 15, 2025 am 12:16 AM
Python vs. JavaScript: Community, Libraries, and Resources
Apr 15, 2025 am 12:16 AM
Python and JavaScript have their own advantages and disadvantages in terms of community, libraries and resources. 1) The Python community is friendly and suitable for beginners, but the front-end development resources are not as rich as JavaScript. 2) Python is powerful in data science and machine learning libraries, while JavaScript is better in front-end development libraries and frameworks. 3) Both have rich learning resources, but Python is suitable for starting with official documents, while JavaScript is better with MDNWebDocs. The choice should be based on project needs and personal interests.
 Detailed explanation of docker principle
Apr 14, 2025 pm 11:57 PM
Detailed explanation of docker principle
Apr 14, 2025 pm 11:57 PM
Docker uses Linux kernel features to provide an efficient and isolated application running environment. Its working principle is as follows: 1. The mirror is used as a read-only template, which contains everything you need to run the application; 2. The Union File System (UnionFS) stacks multiple file systems, only storing the differences, saving space and speeding up; 3. The daemon manages the mirrors and containers, and the client uses them for interaction; 4. Namespaces and cgroups implement container isolation and resource limitations; 5. Multiple network modes support container interconnection. Only by understanding these core concepts can you better utilize Docker.
 How to run programs in terminal vscode
Apr 15, 2025 pm 06:42 PM
How to run programs in terminal vscode
Apr 15, 2025 pm 06:42 PM
In VS Code, you can run the program in the terminal through the following steps: Prepare the code and open the integrated terminal to ensure that the code directory is consistent with the terminal working directory. Select the run command according to the programming language (such as Python's python your_file_name.py) to check whether it runs successfully and resolve errors. Use the debugger to improve debugging efficiency.
 Python: Automation, Scripting, and Task Management
Apr 16, 2025 am 12:14 AM
Python: Automation, Scripting, and Task Management
Apr 16, 2025 am 12:14 AM
Python excels in automation, scripting, and task management. 1) Automation: File backup is realized through standard libraries such as os and shutil. 2) Script writing: Use the psutil library to monitor system resources. 3) Task management: Use the schedule library to schedule tasks. Python's ease of use and rich library support makes it the preferred tool in these areas.
 Is the vscode extension malicious?
Apr 15, 2025 pm 07:57 PM
Is the vscode extension malicious?
Apr 15, 2025 pm 07:57 PM
VS Code extensions pose malicious risks, such as hiding malicious code, exploiting vulnerabilities, and masturbating as legitimate extensions. Methods to identify malicious extensions include: checking publishers, reading comments, checking code, and installing with caution. Security measures also include: security awareness, good habits, regular updates and antivirus software.
 How to install nginx in centos
Apr 14, 2025 pm 08:06 PM
How to install nginx in centos
Apr 14, 2025 pm 08:06 PM
CentOS Installing Nginx requires following the following steps: Installing dependencies such as development tools, pcre-devel, and openssl-devel. Download the Nginx source code package, unzip it and compile and install it, and specify the installation path as /usr/local/nginx. Create Nginx users and user groups and set permissions. Modify the configuration file nginx.conf, and configure the listening port and domain name/IP address. Start the Nginx service. Common errors need to be paid attention to, such as dependency issues, port conflicts, and configuration file errors. Performance optimization needs to be adjusted according to the specific situation, such as turning on cache and adjusting the number of worker processes.
 What is vscode What is vscode for?
Apr 15, 2025 pm 06:45 PM
What is vscode What is vscode for?
Apr 15, 2025 pm 06:45 PM
VS Code is the full name Visual Studio Code, which is a free and open source cross-platform code editor and development environment developed by Microsoft. It supports a wide range of programming languages and provides syntax highlighting, code automatic completion, code snippets and smart prompts to improve development efficiency. Through a rich extension ecosystem, users can add extensions to specific needs and languages, such as debuggers, code formatting tools, and Git integrations. VS Code also includes an intuitive debugger that helps quickly find and resolve bugs in your code.
