How to optimize performance in Vue.js? 9 tips to share
How to optimize performance in Vue.js? The following article will share with you nine tips for performance optimization in Vue.js. I hope it will be helpful to you!

(Learning video sharing: vuejs tutorial)
01 Functional components
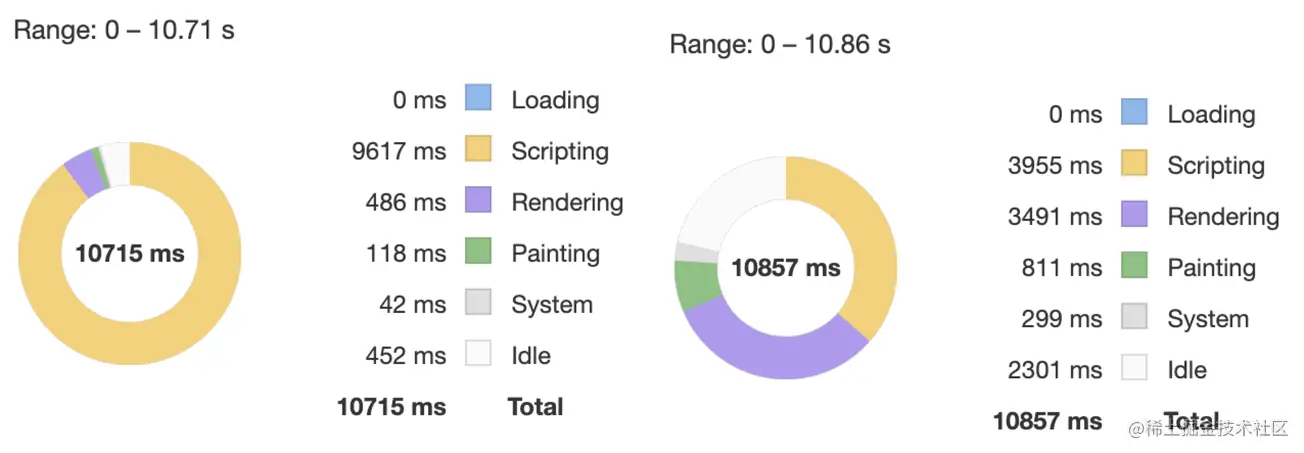
**Principle: ****Functional component**Compared with ordinary components, it has no state (no responsiveness data), no instance (no this context). We can think of a functional component as a function in the component. The input parameter is the render context and the return value is the rendered HTML. Precisely because functional components simplify a lot of processing such as responsiveness and hook functions, rendering performance will be improved to a certain extent.
Applicable scenarios:
Pure display components that do not require responsive data and processing logic
Higher-order components used to mark or provide basic functions
Elements in the loop (v-for)
02 Child component splitting


**Principle: **In the code before optimization, every time the number passed in props occurs It will be re-rendered when it changes, and the heavy function will be called again during the rendering process to perform performance-consuming operations. The optimized code logic is to encapsulate complex operations in sub-components. Since Vue updates are at component granularity, when the incoming number changes, the parent component will be re-rendered, and the sub-component does not depend on the number because it does not depend on the number. Will not re-render. The number of calculations performed is reduced, and the performance is naturally improved.
**Another: **You can actually use computed properties to optimize here (it will not be recalculated when the external dependencies have not changed, and the cost of additional rendering of subcomponents is saved)
03 Local variables


**Principle: **Comparing the before and after code, you can find that the difference is: before optimization The code directly references this.base every time it performs calculations, and the optimized code caches this.base using the local variable base, and calls the local variable for calculations in subsequent calculations. Why is there such an obvious performance difference? The reason is that every time this.base is accessed, since this.base is a calculated property, a piece of logic code will be executed to see if the existing dependencies have changed. If they have changed, they will be recalculated. If not, the last calculated value will be returned. The performance consumption of this type of calculation logic may not be obvious when it is called only a few times, but if it is executed too much (similar to the example where 300 components are updated per frame, and each component calls this.base multiple times within one update), then There will be a relatively large performance difference.
04 Reuse DOM with v-show


##Principle:
- Implementation method: v-if dynamically adds or deletes DOM elements to the DOM tree, v-show controls visibility by setting the display style attribute of the DOM element.
- Compilation process: v-if switching has a partial compilation and uninstallation process. During the switching process, internal event listeners and sub-components are properly destroyed and rebuilt. v-show is simply based on CSS. switch.
- Compilation conditions: v-if is lazy, if the initial condition is false, do nothing, and only start partial compilation when the condition becomes true for the first time, v -show is compiled under all conditions, then cached, and the DOM elements are preserved.
- Performance consumption: v-if has a higher switching cost, v-show has a higher initial rendering cost.
Сценарии использования: v-if подходит для ситуаций, когда условия вряд ли изменятся, v-show подходит для ситуаций, когда условия часто переключаются.
05 Keep-alive


06 Отложенные функции


07 Временное разделение


** Принцип : **Использование разделения времени позволяет избежать одновременной отправки слишком большого количества данных, что приведет к слишком длительному внутреннему времени выполнения JS, блокировке процесса пользовательского интерфейса и зависанию страницы.
**Еще: **При выполнении трудоемкой обработки задач мы обычно добавляем эффект загрузки, но путем сравнения до и после оптимизации можно обнаружить, что до оптимизации JS работал уже долгое время , блокируя процесс пользовательского интерфейса, поэтому он не Анимация загрузки не будет отображаться; после оптимизации, поскольку трудоемкая задача разделена на несколько временных интервалов для отправки, время выполнения одного JS сокращается, а анимация загрузки также имеет шанс быть оказанным.
08 Нереактивные данные


**configurable: false** используется для предотвращения изменения и удаления флагов атрибутов, но разрешает изменение значения объекта;
**Object.freeze(obj)** Добавление/удаление/изменение атрибутов запрещено. Установите configurable: false, writable: false для всех существующих свойств.
// configurable: false

let user = {
  name: "John"
};

Object.defineProperty(user, "name", {
  configurable: false
});

user.name = "Pete"; // 正常工作
delete user.name; // Error

// Object.freeze(obj)

let user = {
  name: "John"
};

Object.freeze(user);

user.name = "Pete";
console.log(user.name); // "John"复制代码09 Виртуальная прокрутка
Guillaume Chau. Заинтересованные студенты могут изучить его реализацию исходного кода. Основной принцип заключается в отслеживании событий прокрутки, динамическом обновлении элементов DOM, которые необходимо отображаются и вычисляют их смещение в пределах вида. Компонент виртуальной прокрутки требует затрат, поскольку его необходимо рассчитывать в реальном времени во время процесса прокрутки, поэтому потребуется определенная стоимость выполнения сценария. Поэтому, если объем данных в списке не очень велик, нам достаточно использовать обычную прокрутку
Эта статья воспроизведена по адресу: https://juejin.cn/post/7084809333740929061(Обучающее видеообмен:
разработка веб-интерфейса)
The above is the detailed content of How to optimize performance in Vue.js? 9 tips to share. For more information, please follow other related articles on the PHP Chinese website!

Hot AI Tools

Undresser.AI Undress
AI-powered app for creating realistic nude photos

AI Clothes Remover
Online AI tool for removing clothes from photos.

Undress AI Tool
Undress images for free

Clothoff.io
AI clothes remover

AI Hentai Generator
Generate AI Hentai for free.

Hot Article

Hot Tools

Notepad++7.3.1
Easy-to-use and free code editor

SublimeText3 Chinese version
Chinese version, very easy to use

Zend Studio 13.0.1
Powerful PHP integrated development environment

Dreamweaver CS6
Visual web development tools

SublimeText3 Mac version
God-level code editing software (SublimeText3)

Hot Topics
 1377
1377
 52
52
 Performance optimization and horizontal expansion technology of Go framework?
Jun 03, 2024 pm 07:27 PM
In order to improve the performance of Go applications, we can take the following optimization measures: Caching: Use caching to reduce the number of accesses to the underlying storage and improve performance. Concurrency: Use goroutines and channels to execute lengthy tasks in parallel. Memory Management: Manually manage memory (using the unsafe package) to further optimize performance. To scale out an application we can implement the following techniques: Horizontal Scaling (Horizontal Scaling): Deploying application instances on multiple servers or nodes. Load balancing: Use a load balancer to distribute requests to multiple application instances. Data sharding: Distribute large data sets across multiple databases or storage nodes to improve query performance and scalability.
 C++ Performance Optimization Guide: Discover the secrets to making your code more efficient
Jun 01, 2024 pm 05:13 PM
C++ performance optimization involves a variety of techniques, including: 1. Avoiding dynamic allocation; 2. Using compiler optimization flags; 3. Selecting optimized data structures; 4. Application caching; 5. Parallel programming. The optimization practical case shows how to apply these techniques when finding the longest ascending subsequence in an integer array, improving the algorithm efficiency from O(n^2) to O(nlogn).
 Optimizing rocket engine performance using C++
Jun 01, 2024 pm 04:14 PM
By building mathematical models, conducting simulations and optimizing parameters, C++ can significantly improve rocket engine performance: Build a mathematical model of a rocket engine and describe its behavior. Simulate engine performance and calculate key parameters such as thrust and specific impulse. Identify key parameters and search for optimal values using optimization algorithms such as genetic algorithms. Engine performance is recalculated based on optimized parameters to improve its overall efficiency.
 The Way to Optimization: Exploring the Performance Improvement Journey of Java Framework
Jun 01, 2024 pm 07:07 PM
The performance of Java frameworks can be improved by implementing caching mechanisms, parallel processing, database optimization, and reducing memory consumption. Caching mechanism: Reduce the number of database or API requests and improve performance. Parallel processing: Utilize multi-core CPUs to execute tasks simultaneously to improve throughput. Database optimization: optimize queries, use indexes, configure connection pools, and improve database performance. Reduce memory consumption: Use lightweight frameworks, avoid leaks, and use analysis tools to reduce memory consumption.
 How to use profiling in Java to optimize performance?
Jun 01, 2024 pm 02:08 PM
Profiling in Java is used to determine the time and resource consumption in application execution. Implement profiling using JavaVisualVM: Connect to the JVM to enable profiling, set the sampling interval, run the application, stop profiling, and the analysis results display a tree view of the execution time. Methods to optimize performance include: identifying hotspot reduction methods and calling optimization algorithms
 Performance optimization in Java microservice architecture
Jun 04, 2024 pm 12:43 PM
Performance optimization for Java microservices architecture includes the following techniques: Use JVM tuning tools to identify and adjust performance bottlenecks. Optimize the garbage collector and select and configure a GC strategy that matches your application's needs. Use a caching service such as Memcached or Redis to improve response times and reduce database load. Employ asynchronous programming to improve concurrency and responsiveness. Split microservices, breaking large monolithic applications into smaller services to improve scalability and performance.
 How to quickly diagnose PHP performance issues
Jun 03, 2024 am 10:56 AM
Effective techniques for quickly diagnosing PHP performance issues include using Xdebug to obtain performance data and then analyzing the Cachegrind output. Use Blackfire to view request traces and generate performance reports. Examine database queries to identify inefficient queries. Analyze memory usage, view memory allocations and peak usage.
 Nginx Performance Tuning: Optimizing for Speed and Low Latency
Apr 05, 2025 am 12:08 AM
Nginx performance tuning can be achieved by adjusting the number of worker processes, connection pool size, enabling Gzip compression and HTTP/2 protocols, and using cache and load balancing. 1. Adjust the number of worker processes and connection pool size: worker_processesauto; events{worker_connections1024;}. 2. Enable Gzip compression and HTTP/2 protocol: http{gzipon;server{listen443sslhttp2;}}. 3. Use cache optimization: http{proxy_cache_path/path/to/cachelevels=1:2k


