
 Development Tools
VSCode
Let's talk about how to debug the main process code of Electron application on VSCode!
Development Tools
VSCode
Let's talk about how to debug the main process code of Electron application on VSCode!
Let's talk about how to debug the main process code of Electron application on VSCode!

When developing Electron applications, in order to improve work efficiency, we need to use debugging tools to discover and solve problems in time.
VSCode is the most popular code editor at the moment. Most of my codes are developed on it, and Electron applications are no exception. Today, I will share how to debug the main process code of Electron application on VSCode.
The steps described in this article are based on those who are already familiar with or know the VSCode debugging method, please follow your needs!
Building environment
The project used in this article is electron-quick-start.
$ git clone https://github.com/electron/electron-quick-start
$ cd ./electron-quick-start
$ npm install
After the above steps, the basic Electron application development environment has been set up. View package.json:
{
  "name": "electron-quick-start",
  "version": "1.0.0",
  "description": "A minimal Electron application",
  "main": "main.js",
  "scripts": {
    "start": "electron ."
  },
  "repository": "https://github.com/electron/electron-quick-start",
  "keywords": [
    "Electron",
    "quick",
    "start",
    "tutorial",
    "demo"
  ],
  "author": "GitHub",
  "license": "CC0-1.0",
  "devDependencies": {
    "electron": "16.0.6"
  }
} We can run npm run start in the terminal to view the running results:

As you can see, the environment construction is complete! Next, enter the development and debugging phase.
Debug configuration
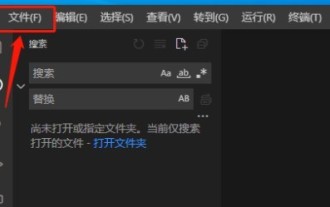
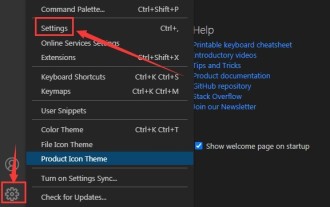
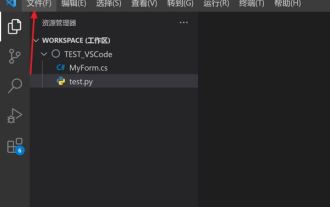
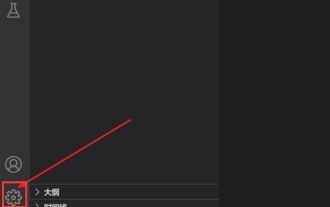
Open with VSCode and do the following:
Generate the following configuration lauch.json File:
{
    // 使用 IntelliSense 了解相关属性。
    // 悬停以查看现有属性的描述。
    // 欲了解更多信息,请访问: https://go.microsoft.com/fwlink/?linkid=830387
    "version": "0.2.0",
    "configurations": [
        {
            "type": "pwa-node",
            "request": "launch",
            "name": "Launch Program",
            "skipFiles": [
                "<node_internals>/**"
            ],
            "program": "${workspaceFolder}/main.js"
        }
    ]
}We modify its configuration as follows:
{
    "version": "0.2.0",
    "configurations": [
        {
            "name": "Debug Main Process",
            "type": "node",
            "request": "launch",
            "cwd": "${workspaceFolder}",
            "runtimeExecutable": "${workspaceFolder}/node_modules/.bin/electron",
            "windows": {
                "runtimeExecutable": "${workspaceFolder}/node_modules/.bin/electron.cmd"
            },
            "args": [
                "./main.js",  // 主文件路径
            ]
        }
    ]
}Start debugging
When we have completed the above environment setup After configuring the file, you can enjoy debugging (put breakpoints as needed):

Everyone should be familiar with the debugging method of VSCode, so I won’t go into details here. , I hope everyone has a happy debugging and happy fishing!
Conclusion
The method introduced in this article is just one of the ways to debug the Electron main process code. It can be regarded as an introduction. If you have a better debugging method, please leave a message in the comment area to communicate. Looking forward to it. Interaction with everyone!
~This article is over, thank you for reading!
For more knowledge about VSCode, please visit: vscode tutorial! !
The above is the detailed content of Let's talk about how to debug the main process code of Electron application on VSCode!. For more information, please follow other related articles on the PHP Chinese website!

Hot AI Tools

Undresser.AI Undress
AI-powered app for creating realistic nude photos

AI Clothes Remover
Online AI tool for removing clothes from photos.

Undress AI Tool
Undress images for free

Clothoff.io
AI clothes remover

AI Hentai Generator
Generate AI Hentai for free.

Hot Article
Hot Tools

Notepad++7.3.1
Easy-to-use and free code editor

SublimeText3 Chinese version
Chinese version, very easy to use

Zend Studio 13.0.1
Powerful PHP integrated development environment

Dreamweaver CS6
Visual web development tools

SublimeText3 Mac version
God-level code editing software (SublimeText3)
Hot Topics
 1376
1376
 52
52

 How to view word documents in vscode How to view word documents in vscode
May 09, 2024 am 09:37 AM
How to view word documents in vscode How to view word documents in vscode
May 09, 2024 am 09:37 AM
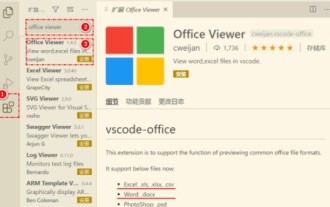
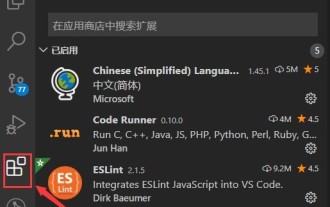
First, open the vscode software on the computer, click the [Extension] icon on the left, as shown in ① in the figure. Then, enter [officeviewer] in the search box of the extension interface, as shown in ② in the figure. Then, from the search Select [officeviewer] to install in the results, as shown in ③ in the figure. Finally, open the file, such as docx, pdf, etc., as shown below
 How to draw a flow chart with vscode_How to draw a flow chart with visual_studio code
Apr 23, 2024 pm 02:13 PM
How to draw a flow chart with vscode_How to draw a flow chart with visual_studio code
Apr 23, 2024 pm 02:13 PM
First, open visual studio code on the computer, click the four square buttons on the left, then enter draw.io in the search box to query the plug-in, click Install. After installation, create a new test.drawio file, then select the test.drawio file, enter the editing mode on the left There are various graphics on the side. You can draw the flow chart by selecting at will. After drawing, click File → Embed → svg and then select Embed. Copy the svg code. Paste the copied svg code into the html code. Open the html web page and you can see it. Click on the picture on the web page to jump to the flow chart. On this page, you can zoom in and out of the flow chart. Here, we choose to click on the pencil pattern in the lower right corner to jump to the web page.
 Caltech Chinese use AI to subvert mathematical proofs! Speed up 5 times shocked Tao Zhexuan, 80% of mathematical steps are fully automated
Apr 23, 2024 pm 03:01 PM
Caltech Chinese use AI to subvert mathematical proofs! Speed up 5 times shocked Tao Zhexuan, 80% of mathematical steps are fully automated
Apr 23, 2024 pm 03:01 PM
LeanCopilot, this formal mathematics tool that has been praised by many mathematicians such as Terence Tao, has evolved again? Just now, Caltech professor Anima Anandkumar announced that the team released an expanded version of the LeanCopilot paper and updated the code base. Image paper address: https://arxiv.org/pdf/2404.12534.pdf The latest experiments show that this Copilot tool can automate more than 80% of the mathematical proof steps! This record is 2.3 times better than the previous baseline aesop. And, as before, it's open source under the MIT license. In the picture, he is Song Peiyang, a Chinese boy. He is
 How to add files to vscode workspace How to add files to vscode workspace
May 09, 2024 am 09:43 AM
How to add files to vscode workspace How to add files to vscode workspace
May 09, 2024 am 09:43 AM
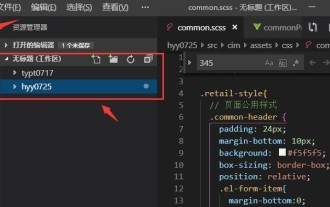
1. First, open the vscode software, click the explorer icon, and find the workspace window 2. Then, click the file menu in the upper left corner and find the add folder to workspace option 3. Finally, find the folder location in the local disk , click the add button
 How to enable background updates in vscode How to enable background updates in vscode
May 09, 2024 am 09:52 AM
How to enable background updates in vscode How to enable background updates in vscode
May 09, 2024 am 09:52 AM
1. First, after opening the interface, click the file menu in the upper left corner. 2. Then, click the settings button in the preferences column. 3. Then, in the settings page that jumps, find the update section. 4. Finally, click the mouse to check and enable it. Download and install the new VSCode version button in the background on Windows and restart the program.
 How to disable wsl configuration file in vscode How to disable wsl configuration file in vscode
May 09, 2024 am 10:30 AM
How to disable wsl configuration file in vscode How to disable wsl configuration file in vscode
May 09, 2024 am 10:30 AM
1. First, open the settings option in the settings menu. 2. Then, find the terminal column in the commonly used page. 3. Finally, uncheck the usewslprofiles button on the right side of the column.
 How to set animation smooth insertion in VScode VScode tutorial to set animation smooth insertion
May 09, 2024 am 09:49 AM
How to set animation smooth insertion in VScode VScode tutorial to set animation smooth insertion
May 09, 2024 am 09:49 AM
1. First, after opening the interface, click the workspace interface 2. Then, in the open editing panel, click the File menu 3. Then, click the Settings button under the Preferences column 4. Finally, click the mouse to check the CursorSmoothCaretAnimation button and save Just set it
 How to open workspace trust permissions in Vscode Vscode method to open workspace trust permissions
May 09, 2024 am 10:34 AM
How to open workspace trust permissions in Vscode Vscode method to open workspace trust permissions
May 09, 2024 am 10:34 AM
1. First, after opening the editing window, click the configuration icon in the lower left corner 2. Then, click the Manage Workspace Trust button in the submenu that opens 3. Then, find the page in the editing window 4. Finally, according to your office Just check the relevant instructions if required
