
Download xdebug extension
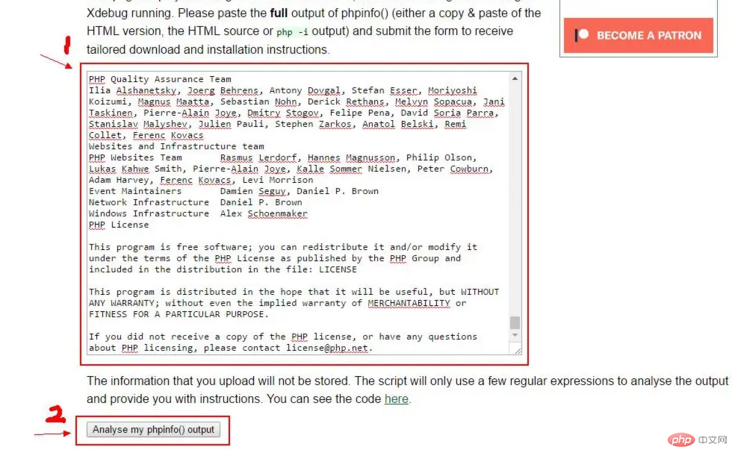
Copy all the information in phpinfo() to the text box in Xdebug, as shown in the figure below: Click the "Analyse my phpinfo() output" button.
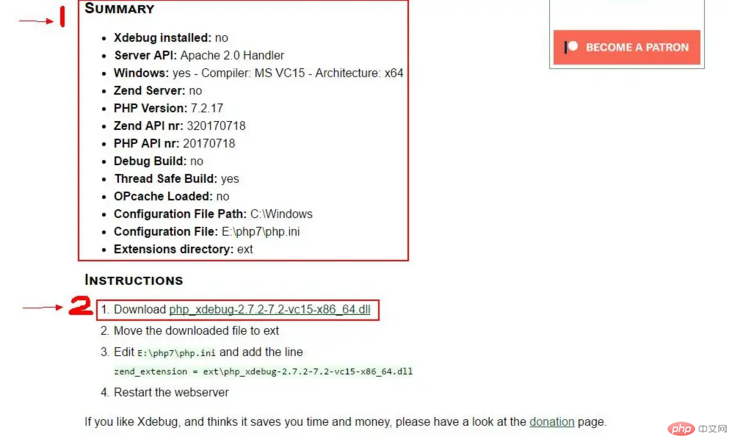
Jump to the page as shown below, the php in this machine will be analyzed, click "Download php_xdebug-2.7.2-7.2-vc15-x86_64.dll" button to download the Xdebug extension.
Configure Xdebug extension
Copy the downloaded Xdebug extension to the ext folder in the php directory, and add the following configuration information at the end of the php.ini configuration :
zend_extension=E:\php7\ext\php_xdebug-2.7.2-7.2-vc15-x86_64.dllxdebug.profiler_output_dir="E:\php\xdebug"xdebug.trace_output_dir="E:\php\xdebug"xdebug.remote_port=9000xdebug.idekey=PHPSTORMxdebug.remote_autostart=1xdebug.remote_host=localhostxdebug.remote_enable=1
Then restart the service and open phpinfo() again. The xdebug extension appears to indicate that the configuration is successful

Configure Xdebug in phpStorm
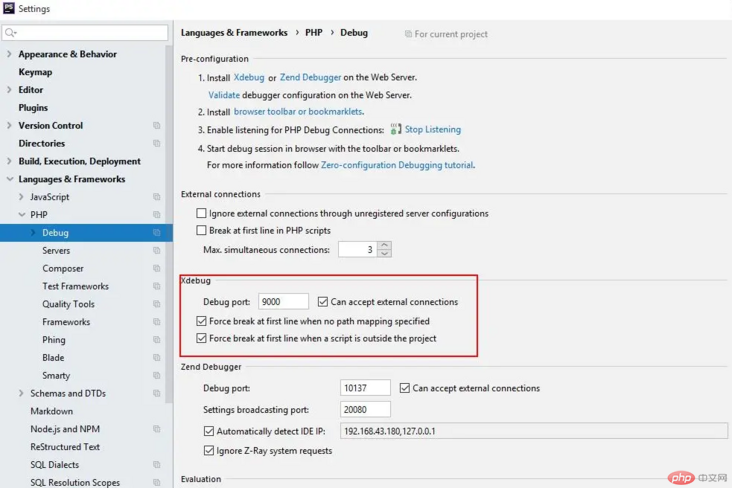
In commonly used editors Configure xdebug in the server, taking phpstorm as an example, open "File->Settings->Languages & Development->PHP->Debug" and configure the XDebug listening port number, which needs to be the same as that configured in the php.ini configuration file The port number remains consistent, as shown in the following figure:


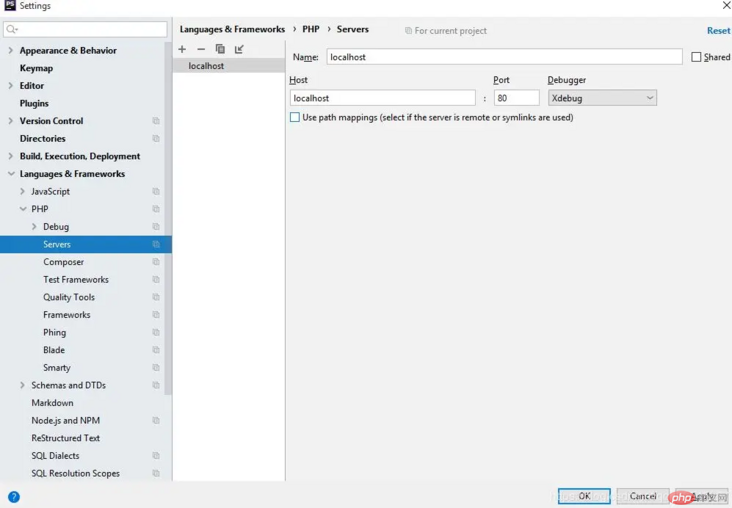
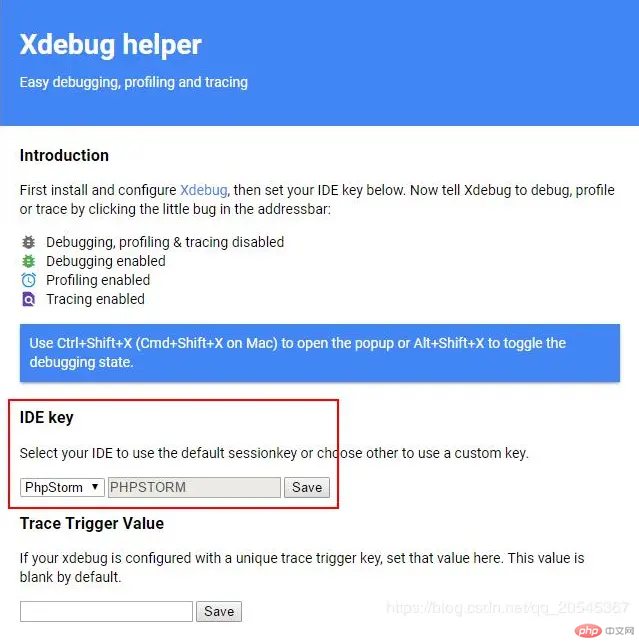
After Chrome adds the Xdebug helper extension, you need to configure the "IDE key", which needs to be configured with php.ini The configuration in the file remains consistent. The above configuration file is written as PHPSTORM
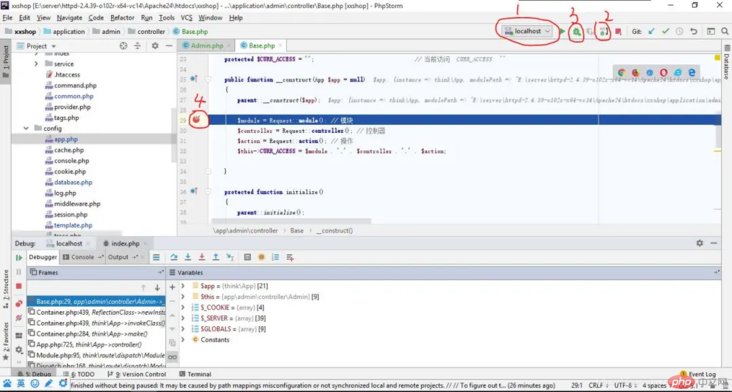
 ##Enable phpStorm debugging
 #The above is the entire content of this article, I hope it can be helpful to everyone.
The above is the detailed content of Detailed tutorial on using xdebug to debug php. For more information, please follow other related articles on the PHP Chinese website!


