

Super practical! Share a stress testing artifact: ab tool

Software stress testing is a basic quality assurance behavior that is part of every important software testing work. Therefore, stress testing is very important, so how to conduct stress testing? In this article, I will share with you a super practical stress testing tool - ab tool (apache bench). I hope it will be helpful to you!
Recommended related video tutorials: " tens of millions of data concurrency solutions (theoretical practice) "
Written in Previously
Before learning the ab tool, we need to understand several concepts about stress testing
Throughput rate (Requests per second)
Concept: A quantitative description of the server's concurrent processing capability, the unit is reqs/s, which refers to the number of requests processed per unit time for a certain number of concurrent users. The maximum number of requests that can be processed per unit time under a certain number of concurrent users is called the maximum throughput rate.
Calculation formula: total number of requests / time taken to process these requests, that is,
Request per second = Complete requests / Time taken for testsThe number of concurrent connections
Concept: The number of requests accepted by the server at a certain time, simply speaking, is a session.The number of concurrent users (Concurrency Level)
Concept: Pay attention to the difference between this concept and the number of concurrent connections. A user may have multiple sessions at the same time, that is, the number of connections.User average request waiting time (Time per request)
Calculation formula: time spent processing all requests / (total number of requests / concurrent Number of users), i.e.
Time per request = Time taken for tests / ( Complete requests / Concurrency Level)Server average request waiting time (Time per request: across all concurrent requests)
Calculation formula: The time it takes to complete all requests/the total number of requests, that is,
Time taken for / testsComplete requests
As you can see, it is the reciprocal of the throughput rate .
At the same time, it also = average user request waiting time/number of concurrent users, that is,
Time per request / Concurrency Level
Ab tool introduction
ab’s full name is: apache bench
- The explanation on the official website is as follows:
ab is a performance testing tool for Apache Hypertext Transfer Protocol (HTTP). Its design intention is to depict the execution performance of the currently installed Apache, mainly to show how many requests per second your installed Apache can handle.
- Explanation from other websites:
ab is apache’s own stress testing tool. ab is very practical. It can not only perform website access stress testing on the apache server, but also perform stress testing on other types of servers. Such as nginx, tomcat, IIS, etc.
Download ab tool
Go to the apache official website http://httpd.apache.org/ and download apache
Start the ab tool
Take the apache installation path as C:\apache\Apache24\ in the windows environment as an example
Open the terminal and enter the command cd C:\apache\Apache24\bin
to start ab
Start testing
Enter the command ab -n 100 -c 10 http://test.com/
where -n represents the number of requests, - c represents the number of concurrencies
For other commands, please refer to http://apache.jz123.cn/programs/ab.html
Test result analysis
After the above command is run, the test report will come out
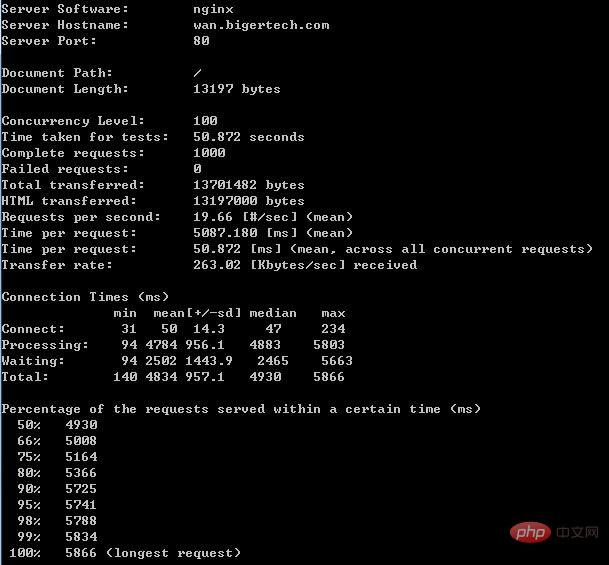
Complete test report
- This paragraph shows the web From the server information, you can see that the server uses nginx, the domain name is wan.bigertech.com, and the port is 80
Server information
- This paragraph is related information about the requested document. The location is "/" and the size of the document is 338436 bytes (this is the body length of the http response)

Document information
- This section shows severalimportant indicators of stress testing
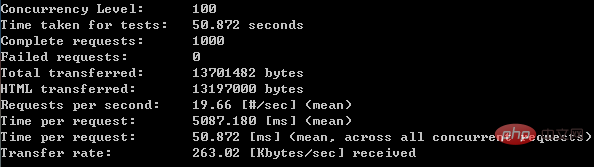
Important indicators
Concurrency Level: 100
//并发请求数
Time taken for tests: 50.872 seconds
//整个测试持续的时间
Complete requests: 1000
//完成的请求数
Failed requests: 0
//失败的请求数

Total transferred: 13701482 bytes
//整个场景中的网络传输量
HTML transferred: 13197000 bytes
//整个场景中的HTML内容传输量

Requests per second: 19.66 [#/sec] (mean)
//吞吐率,大家最关心的指标之一,相当于 LR 中的每秒事务数,后面括号中的 mean 表示这是一个平均值
Time per request: 5087.180 [ms] (mean)
//用户平均请求等待时间,大家最关心的指标之二,相当于 LR 中的平均事务响应时间,后面括号中的 mean 表示这是一个平均值
Time per request: 50.872 [ms] (mean, across all concurrent requests)
//服务器平均请求处理时间,大家最关心的指标之三

Transfer rate: 263.02 [Kbytes/sec] received
//平均每秒网络上的流量,可以帮助排除是否存在网络流量过大导致响应时间延长的问题
- This paragraph represents the breakdown of time spent on the network
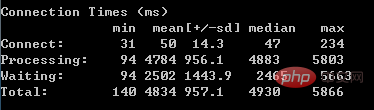
Network consumption time
- This section is the distribution of each request processing time. 50% of the processing time is within 4930ms, 66% of the processing time is within 5008ms..., the important thing is to see90% processing time.
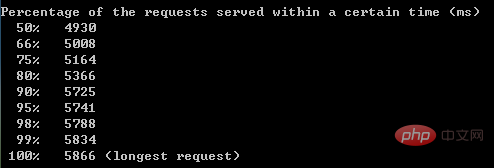
Response
Questions about login
Sometimes stress testing requires users to log in, what should I do?
Please refer to the following steps:
After logging in with your account and password, use the developer tools to find the cookie value (Session ID) that identifies this session and write it down
-
If only one Cookie is used, then just type the command:
ab -n 100 -C key=value http://test.com/If you need multiple cookies, just set the Header directly:
ab -n 100 -H "Cookie: Key1=Value1; Key2=Value2" http://test.com/
Summary
# Generally speaking, the ab tool ab is small and simple, you can get started and learn quickly, and it can provide the needed Basic performance indicators, but there are no graphical results and cannot be monitored. Therefore the ab tool can be used for temporary emergency tasks and simple testing.
Same type of stress testing tools include: webbench, siege, http_load, etc.
Recommended learning: nginx tutorial
The above is the detailed content of Super practical! Share a stress testing artifact: ab tool. For more information, please follow other related articles on the PHP Chinese website!

Hot AI Tools

Undresser.AI Undress
AI-powered app for creating realistic nude photos

AI Clothes Remover
Online AI tool for removing clothes from photos.

Undress AI Tool
Undress images for free

Clothoff.io
AI clothes remover

Video Face Swap
Swap faces in any video effortlessly with our completely free AI face swap tool!

Hot Article
Hot Tools

Notepad++7.3.1
Easy-to-use and free code editor

SublimeText3 Chinese version
Chinese version, very easy to use

Zend Studio 13.0.1
Powerful PHP integrated development environment

Dreamweaver CS6
Visual web development tools

SublimeText3 Mac version
God-level code editing software (SublimeText3)
Hot Topics
 1386
1386
 52
52

 How to set the cgi directory in apache
Apr 13, 2025 pm 01:18 PM
How to set the cgi directory in apache
Apr 13, 2025 pm 01:18 PM
To set up a CGI directory in Apache, you need to perform the following steps: Create a CGI directory such as "cgi-bin", and grant Apache write permissions. Add the "ScriptAlias" directive block in the Apache configuration file to map the CGI directory to the "/cgi-bin" URL. Restart Apache.
 How to start apache
Apr 13, 2025 pm 01:06 PM
How to start apache
Apr 13, 2025 pm 01:06 PM
The steps to start Apache are as follows: Install Apache (command: sudo apt-get install apache2 or download it from the official website) Start Apache (Linux: sudo systemctl start apache2; Windows: Right-click the "Apache2.4" service and select "Start") Check whether it has been started (Linux: sudo systemctl status apache2; Windows: Check the status of the "Apache2.4" service in the service manager) Enable boot automatically (optional, Linux: sudo systemctl
 How to delete more than server names of apache
Apr 13, 2025 pm 01:09 PM
How to delete more than server names of apache
Apr 13, 2025 pm 01:09 PM
To delete an extra ServerName directive from Apache, you can take the following steps: Identify and delete the extra ServerName directive. Restart Apache to make the changes take effect. Check the configuration file to verify changes. Test the server to make sure the problem is resolved.
 How to check Debian OpenSSL configuration
Apr 12, 2025 pm 11:57 PM
How to check Debian OpenSSL configuration
Apr 12, 2025 pm 11:57 PM
This article introduces several methods to check the OpenSSL configuration of the Debian system to help you quickly grasp the security status of the system. 1. Confirm the OpenSSL version First, verify whether OpenSSL has been installed and version information. Enter the following command in the terminal: If opensslversion is not installed, the system will prompt an error. 2. View the configuration file. The main configuration file of OpenSSL is usually located in /etc/ssl/openssl.cnf. You can use a text editor (such as nano) to view: sudonano/etc/ssl/openssl.cnf This file contains important configuration information such as key, certificate path, and encryption algorithm. 3. Utilize OPE
 How to use Debian Apache logs to improve website performance
Apr 12, 2025 pm 11:36 PM
How to use Debian Apache logs to improve website performance
Apr 12, 2025 pm 11:36 PM
This article will explain how to improve website performance by analyzing Apache logs under the Debian system. 1. Log Analysis Basics Apache log records the detailed information of all HTTP requests, including IP address, timestamp, request URL, HTTP method and response code. In Debian systems, these logs are usually located in the /var/log/apache2/access.log and /var/log/apache2/error.log directories. Understanding the log structure is the first step in effective analysis. 2. Log analysis tool You can use a variety of tools to analyze Apache logs: Command line tools: grep, awk, sed and other command line tools.
 How to view your apache version
Apr 13, 2025 pm 01:15 PM
How to view your apache version
Apr 13, 2025 pm 01:15 PM
There are 3 ways to view the version on the Apache server: via the command line (apachectl -v or apache2ctl -v), check the server status page (http://<server IP or domain name>/server-status), or view the Apache configuration file (ServerVersion: Apache/<version number>).
 How to connect to the database of apache
Apr 13, 2025 pm 01:03 PM
How to connect to the database of apache
Apr 13, 2025 pm 01:03 PM
Apache connects to a database requires the following steps: Install the database driver. Configure the web.xml file to create a connection pool. Create a JDBC data source and specify the connection settings. Use the JDBC API to access the database from Java code, including getting connections, creating statements, binding parameters, executing queries or updates, and processing results.
 What to do if the apache80 port is occupied
Apr 13, 2025 pm 01:24 PM
What to do if the apache80 port is occupied
Apr 13, 2025 pm 01:24 PM
When the Apache 80 port is occupied, the solution is as follows: find out the process that occupies the port and close it. Check the firewall settings to make sure Apache is not blocked. If the above method does not work, please reconfigure Apache to use a different port. Restart the Apache service.
