
 Backend Development
Python Tutorial
Teach you step by step how to use the plot() function to draw pictures in Python
Backend Development
Python Tutorial
Teach you step by step how to use the plot() function to draw pictures in Python
Teach you step by step how to use the plot() function to draw pictures in Python

This article brings you relevant knowledge about python, which mainly introduces related issues about using the plot() function to draw pictures, including the basic understanding and use of this function, as well as the Let’s take a look at the function data visualization drawings and basic parameter settings. I hope it will be helpful to everyone.

Recommended learning: python video tutorial
1. Understanding the plot() function
When using Python In data visualization programming, the matplotlib library is a commonly used third-party library that we use to draw data. It contains various functions, that is, different types of graphics. To use the functions in the matplotlib library, you need to understand the format of the data required by the function. This is also the focus of our study of the matplotlib library.
Directly use the plot() function to draw graphs, which is for general simple data. We can directly draw the list data by calling the plot() function directly. Directly using the plot() function in initial learning can help us lay the parameters and foundation of the function for subsequent graphics learning.
Matplotlib graph composition:
- Figure (canvas)
- Axes (coordinate system)
- Axis (coordinate axis)
- Graphics (plot(), scatter(), bar(),...)
- Title, Labels, ......
Use plot() directly ) The function drawing method is as follows:
plt.plot(x, y, fmt='xxx', linestyle=, marker=, color=, linewidth=, markersize=, label=, )
where x, y represent the horizontal and vertical coordinates, and fmt = '#color#linestyle#marker' represents various parameters.
(1) linestyle: This field is the style of the line, parameter form: string
| linestyle parameter | Line shape |
| solid line | |
| Dotted line | |
| Dotted line | |
| Dotted line | |
| wireless |
(3) marker: point style, string
marker (point style)| Marker point | |
| 店 | ## ',' |
| ##'^' 'v' '>' '<' | |
| '1' '2' '3' '4' | |
| 'o' | |
| 's' 'D' | |
| 'p' | |
| 'h' 'H' | |
| '*' | |
| ' ' 'x' | |
| '_' | |
| ' | |
| ##(4) markersize: the size of the point, parameter form: numerical value |
color (point, line color)
| 'r' | 红 |
| 'g' | Green |
| ##'b' | Blue |
| 'y' | Yellow |
| 'c' | 青 |
| 'm' | 品 |
| 'k' | 黑 |
| 'w' | 白 |
|
此处颜色参数还可以有二进制,十进制等表示方法,同时对于颜色,RGB是三原色 (6)label:图例,legend文字 二、plot()函数基本运用使用plot()函数时需要导入对应的库,导入库后我们在未有数据的情况下直接画图,直接画图会隐式创建Figure,Axes对象。 import matplotlib.pyplot as plt plt.plot() Copy after login
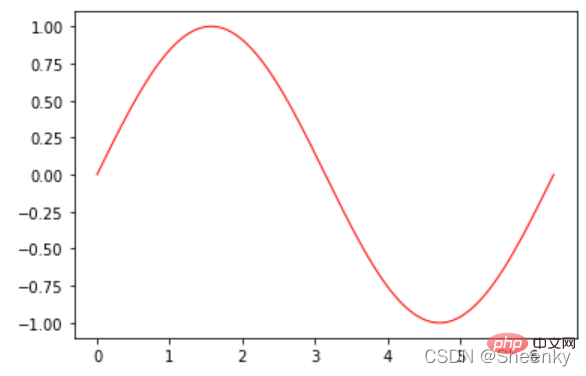
下面通过构造数据绘制简单图形 首先数据构造,设置参数,参数也可以在将数据填入plot()函数的时候设置。 # 导入包 import matplotlib.pyplot as plt import numpy as np # 构造数据 # 位置 (2维:x,y一一对应) x = np.linspace(0, 2 * np.pi, 200) # 从0到2pi的200个值 y = np.sin(x) # 从sin(0)到sin(2pi)的200个值 # 颜色(0维) c = 'red' c = 'r' c = '#FF0000' # 大小(0维): 线宽 lw = 1 Copy after login 画出图形 # 生成一个Figure画布和一个Axes坐标系 fig, ax = plt.subplots() # 在生成的坐标系下画折线图 ax.plot(x, y, c, linewidth=lw) # 显示图形 plt.show() Copy after login 图形展示:
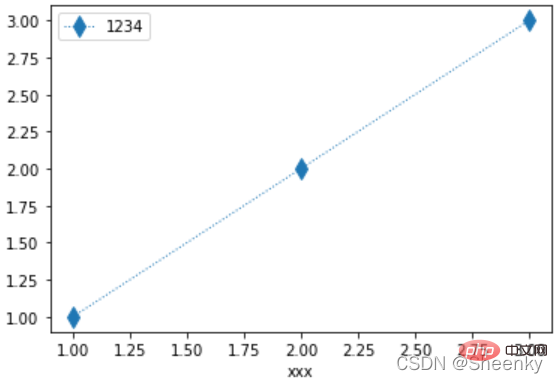
给定两组数据,建立y与x的关系试,使用plot函数进行画图,本次画图线条选用点虚线形式,粗细选用1,点选用方形,点大小选用值为10,图例为‘1234’ import matplotlib.pyplot as plt x = [1,2,3] y = [1,2,3] y = x plt.plot(x,y,linestyle=':', linewidth=1, marker='d', markersize=10, label='1234') plt.legend() Copy after login 作出图片如下;
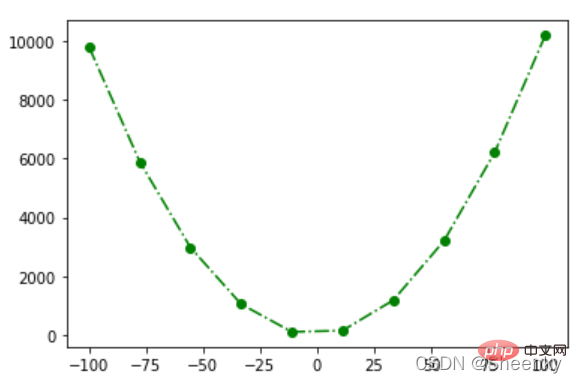
下面我们引用numpy的linspace函数生创建均匀分布序列,然后对x,y建立数值关系,由此来创建图画。 import matplotlib.pyplot as plt import numpy as np x = np.linspace(-100,100,10) y = x**2 + 2*x +1 plt.plot(x,y,'g-.o') Copy after login 作出如下图案,由此可见,我们对于图形的设置方面,在我们熟练以后如果没有粗细的设置可以直接缩减再一个字符串里面
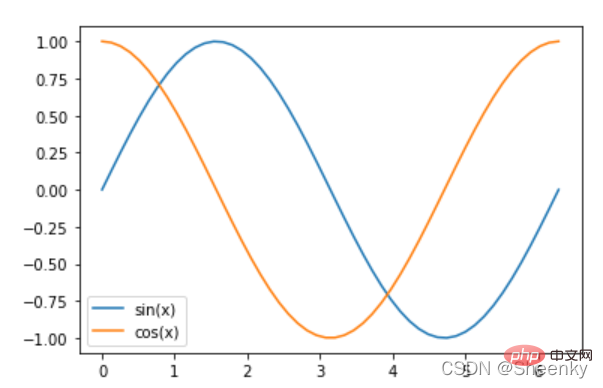
以上都是简单图形的讲解,我们现在通过一个简单的对数据DataFrame进行作图,在往后的数据可视化中我们需要对数据进行处理后再进行可视化。下面我们通过正、余弦函数进行作图。 #导入包 import matplotlib.pyplot as plt import numpy as np import pandas as pd #使用linspace()方法构成数据 x = np.linspace(0, 2 * np.pi, 50) # y1 = np.sin(x) y2 = np.cos(x) #转化数据形式 df = pd.DataFrame([x,y1,y2]).T #对列重新命名 df.columns = ['x','sin(x)','cos(x)'] #数据写入图像,命名图例 plt.plot(df['x'],df['sin(x)'],label='sin(x)') plt.plot(df['x'],df['cos(x)'],label='cos(x)') plt.legend() Copy after login 我们通过numpy的linspace方法生成数据再通过pandas对数据进行DataFrame化再带入plot()函数,此处需要讲的就是图例的命名方法,通过在函数中写入label参数,确定图例的标签,再通过legend()函数生成图例,在后续的学习中也会讲到图例的位置、形式等的运用。
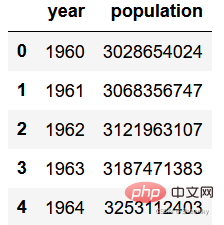
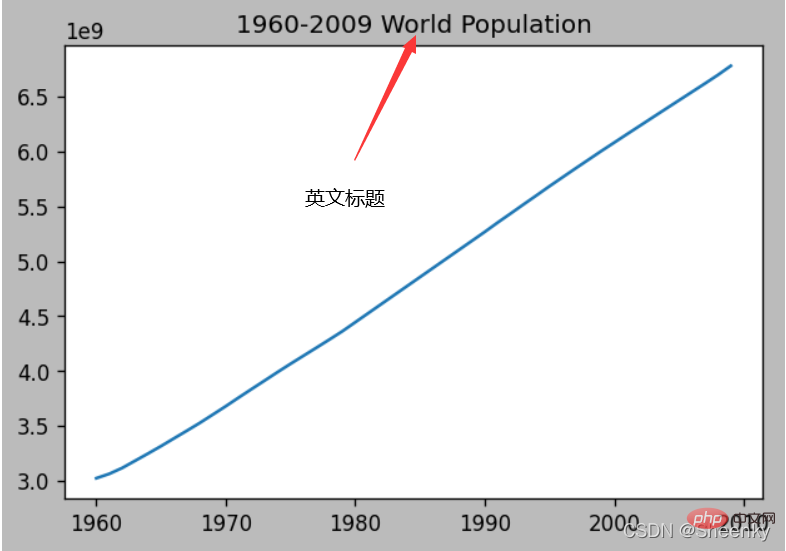
三、plot()函数数据可视化画图以及图元基本参数设置通过绘制世界人口变化曲线图了解基本图元参数设置,本次绘图过程主要是先通过对人口数据导入,了解数据构造,再进配置画图参数最后完成图形的制作,其中基本的图元参数用于别的图形也适用,在这儿学会了我们只需要了解数据结构,构造成图形所要的数据结构就可以就行画出自己想要的图形。 首先进行数据导入,了解数据结构形式。为了学习方便,选用jupyter notebook进行可视化图形讲解。 import pandas as pd datafile = r'world_population.txt' # 打开文件 df = pd.read_csv(datafile) #读取数据 df.head()#展示前面部分数据 Copy after login 以下就是基本的数据样式,由年份和人口数量组成
这里做了基本的图元设计,也就是对于画布的设置,前面我们所学函数参数都是对于图形中间的设置,我们构成一个可视化界面是通过画布+画中图形样式组成一个完整的可视化界面。 画布界面有画布大小,画布像素,画布界面,画布边框等设置。 import matplotlib.pyplot as plt
# 画布
fig = plt.figure(figsize=(6,4), # inches
dpi=120, # dot-per-inch
facecolor='#BBBBBB',
frameon=True, # 画布边框
)
plt.plot(df['year'],df['population'])
# 标题
plt.title("1960-2009 World Population")Copy after login 构成一个完整的可视化图像除了图例还有图像的标题,我们可以通过title()方法设置英文标题,中文标题要通过以下代码才能实现,因此我们如果是做中文项目在导入包以后就可以写上设置中文代码的代码串。 # 设置中文字体 plt.rcParams['font.sans-serif'] = 'SimHei' # 设置字体为简黑(SimHei) plt.rcParams['font.sans-serif'] = 'FangSong' # 设置字体为仿宋(FangSong) Copy after login
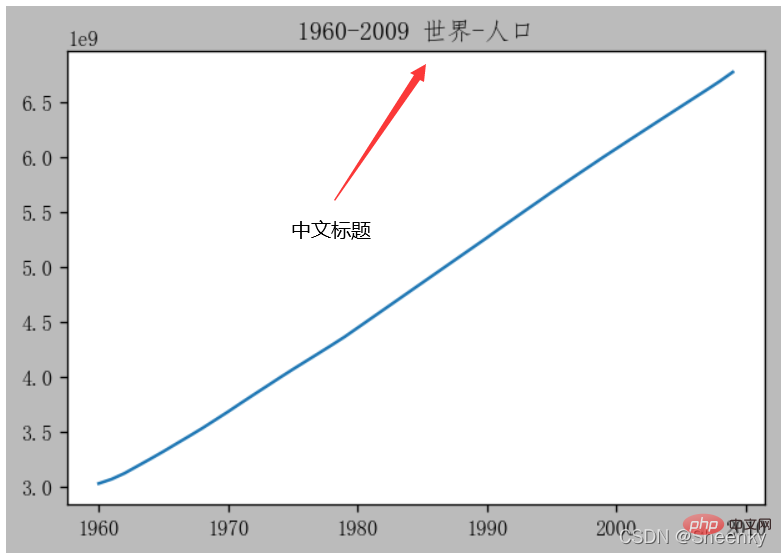
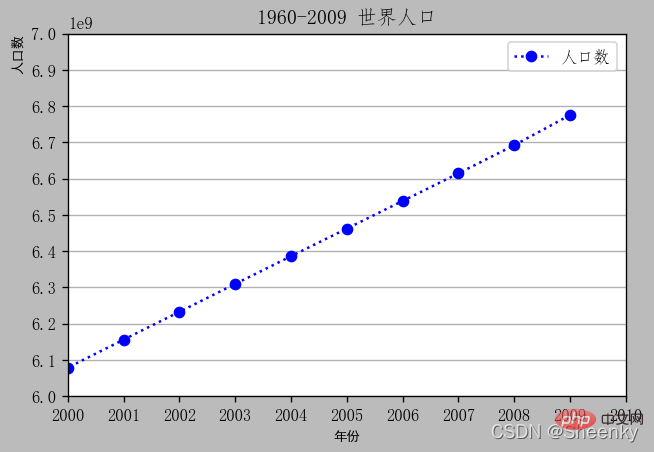
当然,除了这种比较简单的图形之外我们还能对图形进行优化设置,将数据显示的更加的精美和美观,对图形优化便于实际报告中的演示也是我们现在必不可少的的一环。 import matplotlib.pyplot as plt
# 设置中文字体
plt.rcParams['axes.unicode_minus'] = False # 不使用中文减号
plt.rcParams['font.sans-serif'] = 'FangSong' # 设置字体为仿宋(FangSong)
# 画布
fig = plt.figure(figsize=(6,4), # inches
dpi=120, # dot-per-inch
facecolor='#BBBBBB',
frameon=True, # 画布边框
)
plt.plot(df['year'],df['population'],'b:o',label='人口数')
# 中文标题
plt.title("1960-2009 世界人口")
# 字体字典
font_dict=dict(fontsize=8,
color='k',
family='SimHei',
weight='light',
style='italic',
)
# X轴标签
plt.xlabel("年份", loc='center', fontdict=font_dict) # loc: 左中右 left center right
# Y轴标签
plt.ylabel("人口数",loc='top', fontdict=font_dict) # loc: 上中下 top center bottom
# X轴范围
plt.xlim((2000,2010)) # X轴的起点和终点
# Y轴范围
plt.ylim(6e9,7e9) # Y轴的起点和终点
# X轴刻度
plt.xticks(np.arange(2000,2011))
# X轴刻度
plt.yticks(np.arange(6e9,7e9+1e8,1e8))
# 图例
plt.legend()
# plt.legend(labels=['人口'])
# 网格线
plt.grid(axis='y') # axis: 'both','x','y'Copy after login 上述代码,对x轴,y轴的刻度、标签、字体进行定义,对图例、网格线等也做出了参数的设置,最后做出的图形如下图:
推荐学习:python视频教程 |
The above is the detailed content of Teach you step by step how to use the plot() function to draw pictures in Python. For more information, please follow other related articles on the PHP Chinese website!

Hot AI Tools

Undresser.AI Undress
AI-powered app for creating realistic nude photos

AI Clothes Remover
Online AI tool for removing clothes from photos.

Undress AI Tool
Undress images for free

Clothoff.io
AI clothes remover

Video Face Swap
Swap faces in any video effortlessly with our completely free AI face swap tool!

Hot Article
Hot Tools

Notepad++7.3.1
Easy-to-use and free code editor

SublimeText3 Chinese version
Chinese version, very easy to use

Zend Studio 13.0.1
Powerful PHP integrated development environment

Dreamweaver CS6
Visual web development tools

SublimeText3 Mac version
God-level code editing software (SublimeText3)
Hot Topics
 1386
1386
 52
52

 Can visual studio code be used in python
Apr 15, 2025 pm 08:18 PM
Can visual studio code be used in python
Apr 15, 2025 pm 08:18 PM
VS Code can be used to write Python and provides many features that make it an ideal tool for developing Python applications. It allows users to: install Python extensions to get functions such as code completion, syntax highlighting, and debugging. Use the debugger to track code step by step, find and fix errors. Integrate Git for version control. Use code formatting tools to maintain code consistency. Use the Linting tool to spot potential problems ahead of time.
 How to run programs in terminal vscode
Apr 15, 2025 pm 06:42 PM
How to run programs in terminal vscode
Apr 15, 2025 pm 06:42 PM
In VS Code, you can run the program in the terminal through the following steps: Prepare the code and open the integrated terminal to ensure that the code directory is consistent with the terminal working directory. Select the run command according to the programming language (such as Python's python your_file_name.py) to check whether it runs successfully and resolve errors. Use the debugger to improve debugging efficiency.
 Can vs code run in Windows 8
Apr 15, 2025 pm 07:24 PM
Can vs code run in Windows 8
Apr 15, 2025 pm 07:24 PM
VS Code can run on Windows 8, but the experience may not be great. First make sure the system has been updated to the latest patch, then download the VS Code installation package that matches the system architecture and install it as prompted. After installation, be aware that some extensions may be incompatible with Windows 8 and need to look for alternative extensions or use newer Windows systems in a virtual machine. Install the necessary extensions to check whether they work properly. Although VS Code is feasible on Windows 8, it is recommended to upgrade to a newer Windows system for a better development experience and security.
 Is the vscode extension malicious?
Apr 15, 2025 pm 07:57 PM
Is the vscode extension malicious?
Apr 15, 2025 pm 07:57 PM
VS Code extensions pose malicious risks, such as hiding malicious code, exploiting vulnerabilities, and masturbating as legitimate extensions. Methods to identify malicious extensions include: checking publishers, reading comments, checking code, and installing with caution. Security measures also include: security awareness, good habits, regular updates and antivirus software.
 What is vscode What is vscode for?
Apr 15, 2025 pm 06:45 PM
What is vscode What is vscode for?
Apr 15, 2025 pm 06:45 PM
VS Code is the full name Visual Studio Code, which is a free and open source cross-platform code editor and development environment developed by Microsoft. It supports a wide range of programming languages and provides syntax highlighting, code automatic completion, code snippets and smart prompts to improve development efficiency. Through a rich extension ecosystem, users can add extensions to specific needs and languages, such as debuggers, code formatting tools, and Git integrations. VS Code also includes an intuitive debugger that helps quickly find and resolve bugs in your code.
 Python: Automation, Scripting, and Task Management
Apr 16, 2025 am 12:14 AM
Python: Automation, Scripting, and Task Management
Apr 16, 2025 am 12:14 AM
Python excels in automation, scripting, and task management. 1) Automation: File backup is realized through standard libraries such as os and shutil. 2) Script writing: Use the psutil library to monitor system resources. 3) Task management: Use the schedule library to schedule tasks. Python's ease of use and rich library support makes it the preferred tool in these areas.
 Can visual studio code run python
Apr 15, 2025 pm 08:00 PM
Can visual studio code run python
Apr 15, 2025 pm 08:00 PM
VS Code not only can run Python, but also provides powerful functions, including: automatically identifying Python files after installing Python extensions, providing functions such as code completion, syntax highlighting, and debugging. Relying on the installed Python environment, extensions act as bridge connection editing and Python environment. The debugging functions include setting breakpoints, step-by-step debugging, viewing variable values, and improving debugging efficiency. The integrated terminal supports running complex commands such as unit testing and package management. Supports extended configuration and enhances features such as code formatting, analysis and version control.
 Can vs code run python
Apr 15, 2025 pm 08:21 PM
Can vs code run python
Apr 15, 2025 pm 08:21 PM
Yes, VS Code can run Python code. To run Python efficiently in VS Code, complete the following steps: Install the Python interpreter and configure environment variables. Install the Python extension in VS Code. Run Python code in VS Code's terminal via the command line. Use VS Code's debugging capabilities and code formatting to improve development efficiency. Adopt good programming habits and use performance analysis tools to optimize code performance.
