

python data visualization pie chart drawing

This article brings you relevant knowledge about python, which mainly organizes issues related to the drawing of pie charts. Pyplot contains a series of related functions of drawing functions, among which the pie() function You can draw a pie chart. Let’s take a look at it. I hope it will be helpful to everyone.

Recommended learning: python
Pyplot is a sublibrary of Matplotlib, providing a drawing API similar to MATLAB.
Pyplot contains a series of related drawing functions, among which the pie() function can draw pie charts.
When used, we can use import to import the pyplot library and set an alias plt.
Also used the numpy mathematical function library
1. We first draw a simple pie chart
import matplotlib.pyplot as pltimport numpy as np

x = np.array([10, 20, 30, 40])#用一维数组存入各个饼块的尺寸。plt.pie(x)#绘制饼状图,默认是从x轴正方向逆时针开始绘图plt.show()#显示饼状图

Among them, the parameters in the pie() function:
x: the size of each pie piece. A 1-dimensional array-like structure.
2. Then we add a label to each piece of the pie chart, add a title to the pie chart, and count the proportion of people using each operating system.
import matplotlib.pyplot as pltimport numpy as np
plt.rcParams['font.sans-serif'] = ['Microsoft YaHei']
 #指定字体为雅黑,解决文字乱码问题x = np.array([30, 24, 16, 30])plt.pie(x,
        labels=['Windows', 'Linux', 'ios', 'Android'],
        # 设置饼图标签,以列表形式传入
        )plt.title("各操作系统使用占比")plt.show()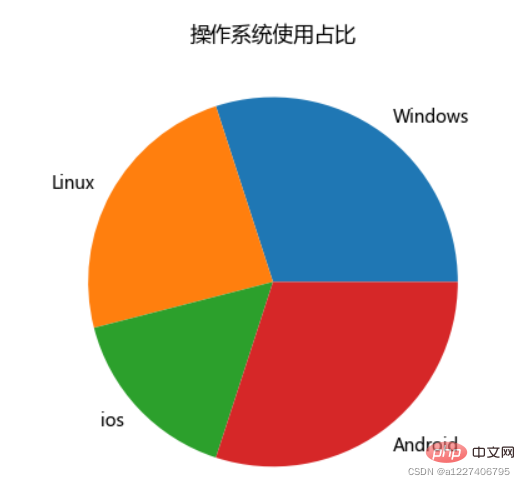
The parameters in the pie() function:
x: the size of each pie piece. A 1-dimensional array-like structure.
label: The label of each pie piece. is a list of strings. The default value is None.
The plt.title() function is used to set the image title.
Note: Using plt.title() directly will display English by default.
3. Finally, clearly display the proportion of each operating system, change the color of each pie piece, and highlight the ios module
import matplotlib.pyplot as pltimport numpy as np

y = np.array([30, 24, 16, 30])plt.rcParams['font.sans-serif'] = ['Microsoft YaHei'] #指定字体为雅黑,解决文字乱码问题plt.pie(y,
        labels=['Windows', 'Linux', 'ios', 'Android'],  # 设置饼图标签
        autopct="(%1.1f%%)" #饼块内标签。
        colors=("r", "blue", "#88c999", (1, 1, 0)),        #设置各饼块的颜色,r表示red,blue代表蓝色
        #88c998十六进制表示绿色 (1,1,0)以元组形式表示黄色
        explode=[0, 0, 0.1, 0] #
        )plt.title("操作系统使用占比")plt.show()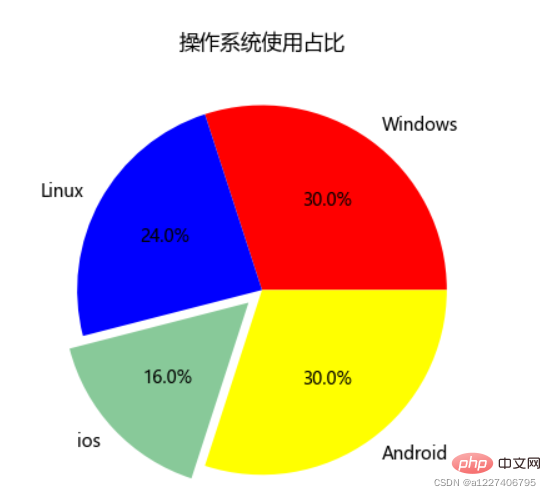
Among them Parameters in the pie() function:
-
autopct: label within the pie block, format the label within the pie block, and display the percentage value in string format. autopct="%1.1f%%" indicates that floating point numbers are displayed, with one integer occupancy and one decimal point occupancy.
- colors: Set the color of each section
-[Note]: The color list can be composed of the following:
Represents the color English words: such as red "red"
The abbreviation of color words such as: red "r", yellow "y"
RGB format: Hexadecimal format such as "#88c999";(r,g,b ) Tuple format- explode: The offset distance of each pie piece relative to the radius of the pie circle, the value is a decimal. The form is a 1-dimensional array-like structure. The larger the value, the farther the offset distance.
Recommended learning: python
The above is the detailed content of python data visualization pie chart drawing. For more information, please follow other related articles on the PHP Chinese website!

Hot AI Tools

Undresser.AI Undress
AI-powered app for creating realistic nude photos

AI Clothes Remover
Online AI tool for removing clothes from photos.

Undress AI Tool
Undress images for free

Clothoff.io
AI clothes remover

AI Hentai Generator
Generate AI Hentai for free.

Hot Article
Hot Tools

Notepad++7.3.1
Easy-to-use and free code editor

SublimeText3 Chinese version
Chinese version, very easy to use

Zend Studio 13.0.1
Powerful PHP integrated development environment

Dreamweaver CS6
Visual web development tools

SublimeText3 Mac version
God-level code editing software (SublimeText3)
Hot Topics
 1378
1378
 52
52

 HadiDB: A lightweight, horizontally scalable database in Python
Apr 08, 2025 pm 06:12 PM
HadiDB: A lightweight, horizontally scalable database in Python
Apr 08, 2025 pm 06:12 PM
HadiDB: A lightweight, high-level scalable Python database HadiDB (hadidb) is a lightweight database written in Python, with a high level of scalability. Install HadiDB using pip installation: pipinstallhadidb User Management Create user: createuser() method to create a new user. The authentication() method authenticates the user's identity. fromhadidb.operationimportuseruser_obj=user("admin","admin")user_obj.
 The 2-Hour Python Plan: A Realistic Approach
Apr 11, 2025 am 12:04 AM
The 2-Hour Python Plan: A Realistic Approach
Apr 11, 2025 am 12:04 AM
You can learn basic programming concepts and skills of Python within 2 hours. 1. Learn variables and data types, 2. Master control flow (conditional statements and loops), 3. Understand the definition and use of functions, 4. Quickly get started with Python programming through simple examples and code snippets.
 Navicat's method to view MongoDB database password
Apr 08, 2025 pm 09:39 PM
Navicat's method to view MongoDB database password
Apr 08, 2025 pm 09:39 PM
It is impossible to view MongoDB password directly through Navicat because it is stored as hash values. How to retrieve lost passwords: 1. Reset passwords; 2. Check configuration files (may contain hash values); 3. Check codes (may hardcode passwords).
 Python: Exploring Its Primary Applications
Apr 10, 2025 am 09:41 AM
Python: Exploring Its Primary Applications
Apr 10, 2025 am 09:41 AM
Python is widely used in the fields of web development, data science, machine learning, automation and scripting. 1) In web development, Django and Flask frameworks simplify the development process. 2) In the fields of data science and machine learning, NumPy, Pandas, Scikit-learn and TensorFlow libraries provide strong support. 3) In terms of automation and scripting, Python is suitable for tasks such as automated testing and system management.
 How to optimize MySQL performance for high-load applications?
Apr 08, 2025 pm 06:03 PM
How to optimize MySQL performance for high-load applications?
Apr 08, 2025 pm 06:03 PM
MySQL database performance optimization guide In resource-intensive applications, MySQL database plays a crucial role and is responsible for managing massive transactions. However, as the scale of application expands, database performance bottlenecks often become a constraint. This article will explore a series of effective MySQL performance optimization strategies to ensure that your application remains efficient and responsive under high loads. We will combine actual cases to explain in-depth key technologies such as indexing, query optimization, database design and caching. 1. Database architecture design and optimized database architecture is the cornerstone of MySQL performance optimization. Here are some core principles: Selecting the right data type and selecting the smallest data type that meets the needs can not only save storage space, but also improve data processing speed.
 How to use AWS Glue crawler with Amazon Athena
Apr 09, 2025 pm 03:09 PM
How to use AWS Glue crawler with Amazon Athena
Apr 09, 2025 pm 03:09 PM
As a data professional, you need to process large amounts of data from various sources. This can pose challenges to data management and analysis. Fortunately, two AWS services can help: AWS Glue and Amazon Athena.
 How to start the server with redis
Apr 10, 2025 pm 08:12 PM
How to start the server with redis
Apr 10, 2025 pm 08:12 PM
The steps to start a Redis server include: Install Redis according to the operating system. Start the Redis service via redis-server (Linux/macOS) or redis-server.exe (Windows). Use the redis-cli ping (Linux/macOS) or redis-cli.exe ping (Windows) command to check the service status. Use a Redis client, such as redis-cli, Python, or Node.js, to access the server.
 How to read redis queue
Apr 10, 2025 pm 10:12 PM
How to read redis queue
Apr 10, 2025 pm 10:12 PM
To read a queue from Redis, you need to get the queue name, read the elements using the LPOP command, and process the empty queue. The specific steps are as follows: Get the queue name: name it with the prefix of "queue:" such as "queue:my-queue". Use the LPOP command: Eject the element from the head of the queue and return its value, such as LPOP queue:my-queue. Processing empty queues: If the queue is empty, LPOP returns nil, and you can check whether the queue exists before reading the element.
