This article brings you relevant knowledge about excel, which mainly organizes related issues on how to use conditional formatting to create project progress charts, including building a framework, setting cell formats, etc. Let’s take a look at the content below. I hope it will be helpful to everyone.

Related learning recommendations: excel tutorial
Today we share a simple and practical method of making a project progress chart. Let’s take a look at the effect first. :
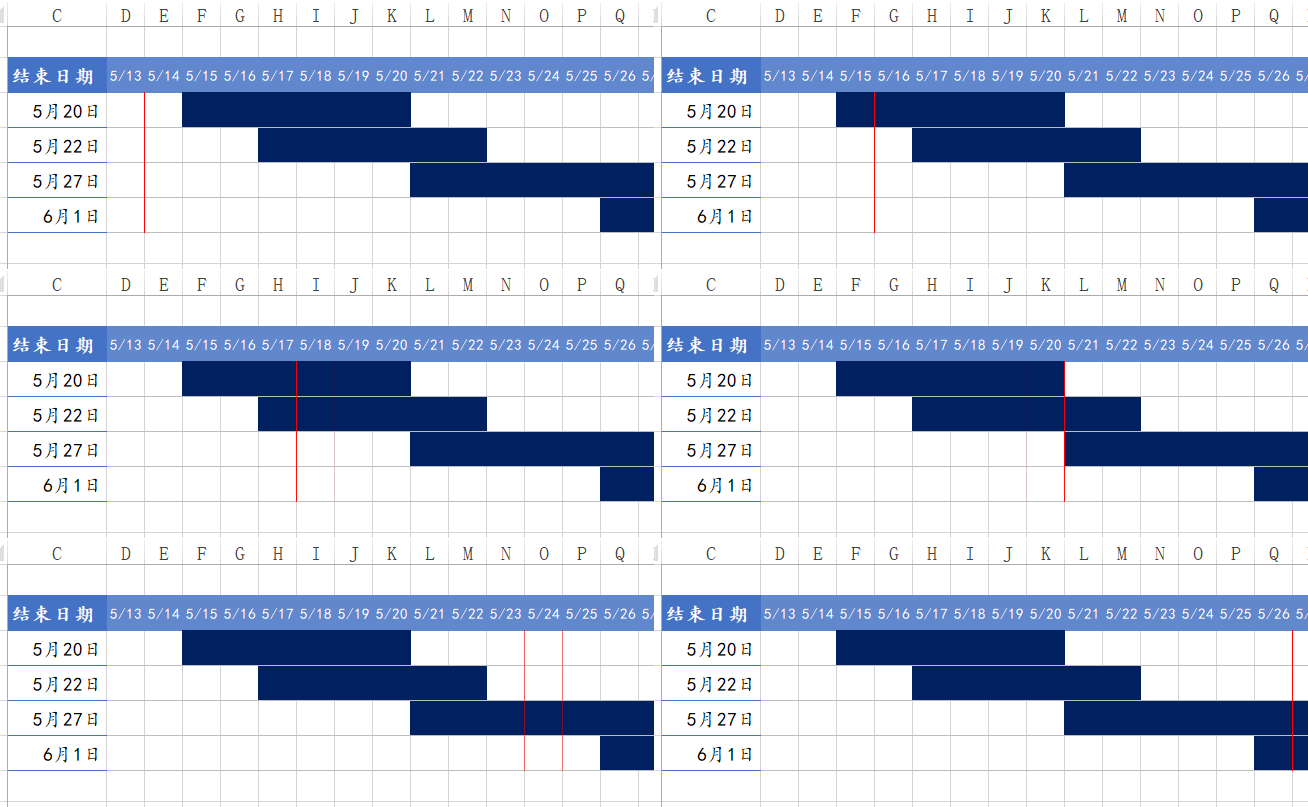
Next let’s take a look at the specific steps.
Enter the subproject name and start and end dates in columns A, B, and C respectively.
Enter the project construction date at D2:X2.

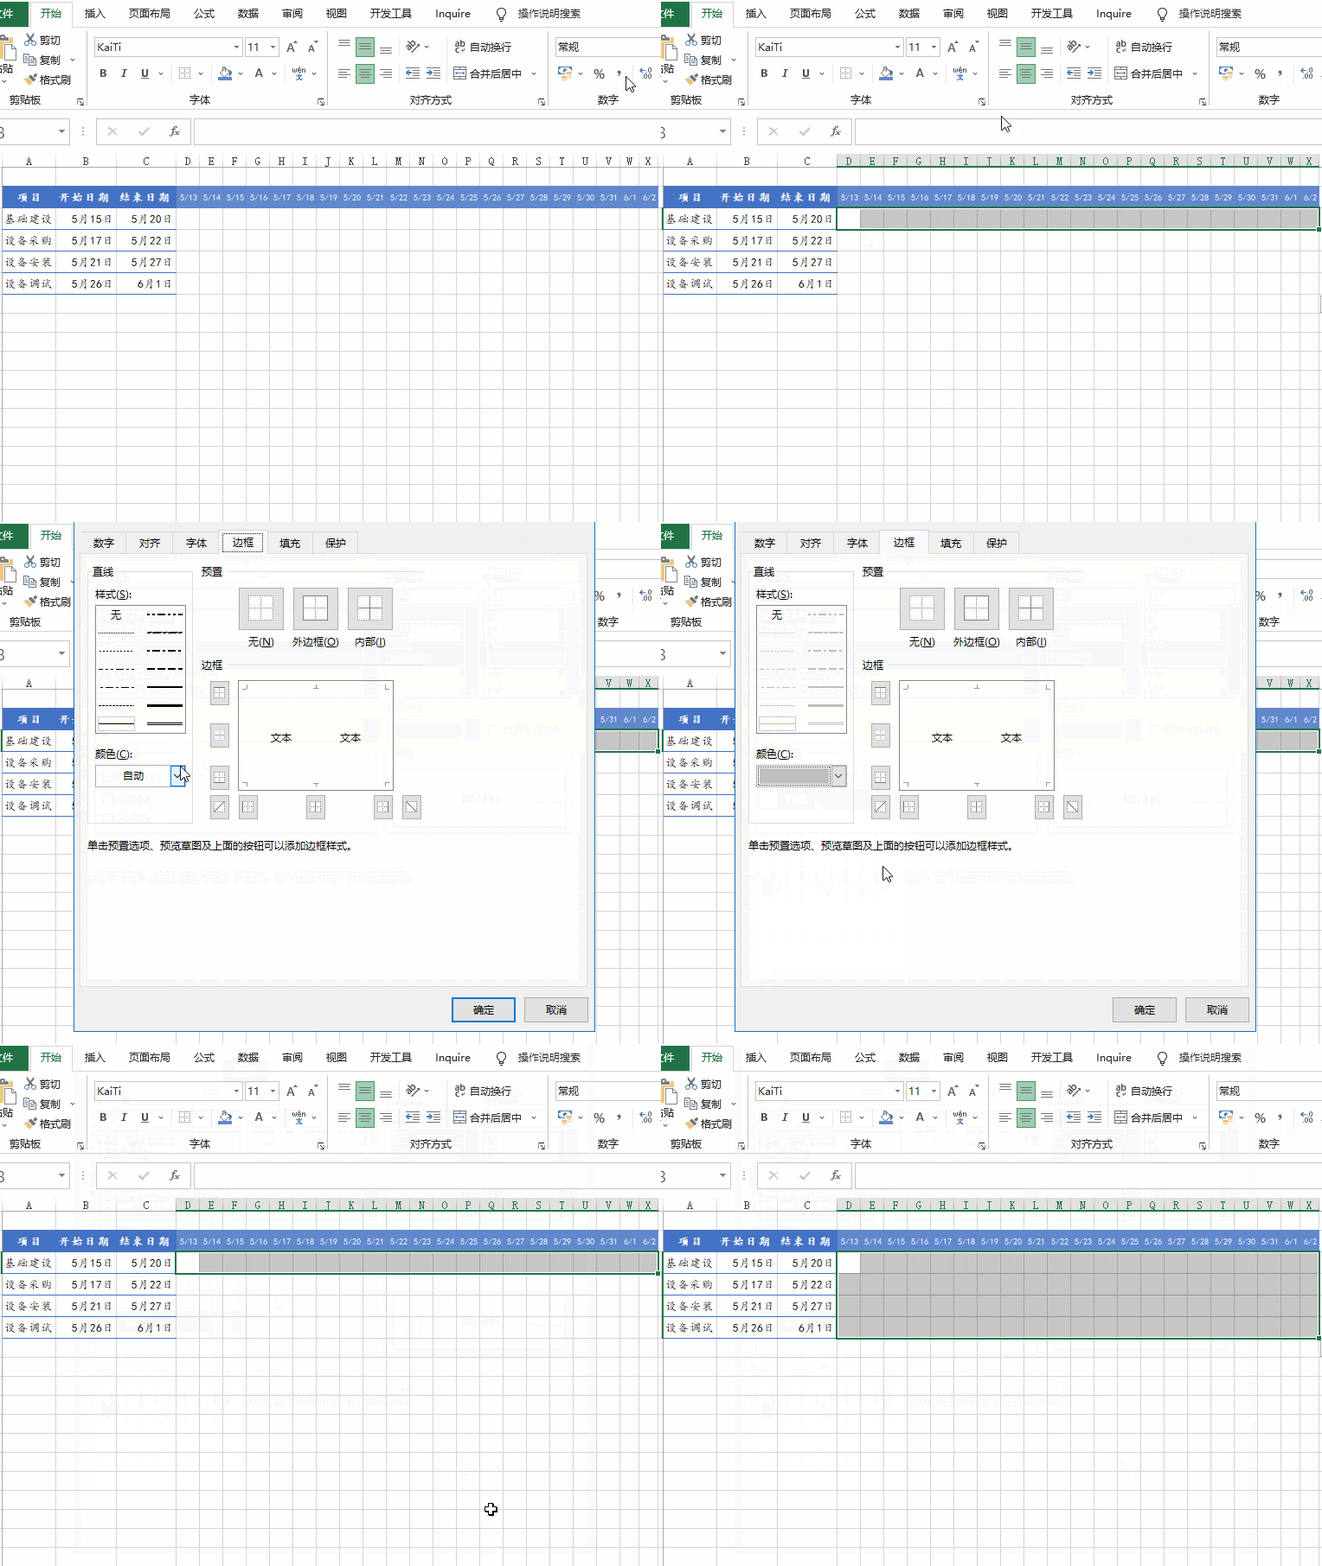
Select D3:X3 and set the cell to a light gray lower border.
The cursor is close to the lower right corner of cell X3 and drag the fill handle downward.
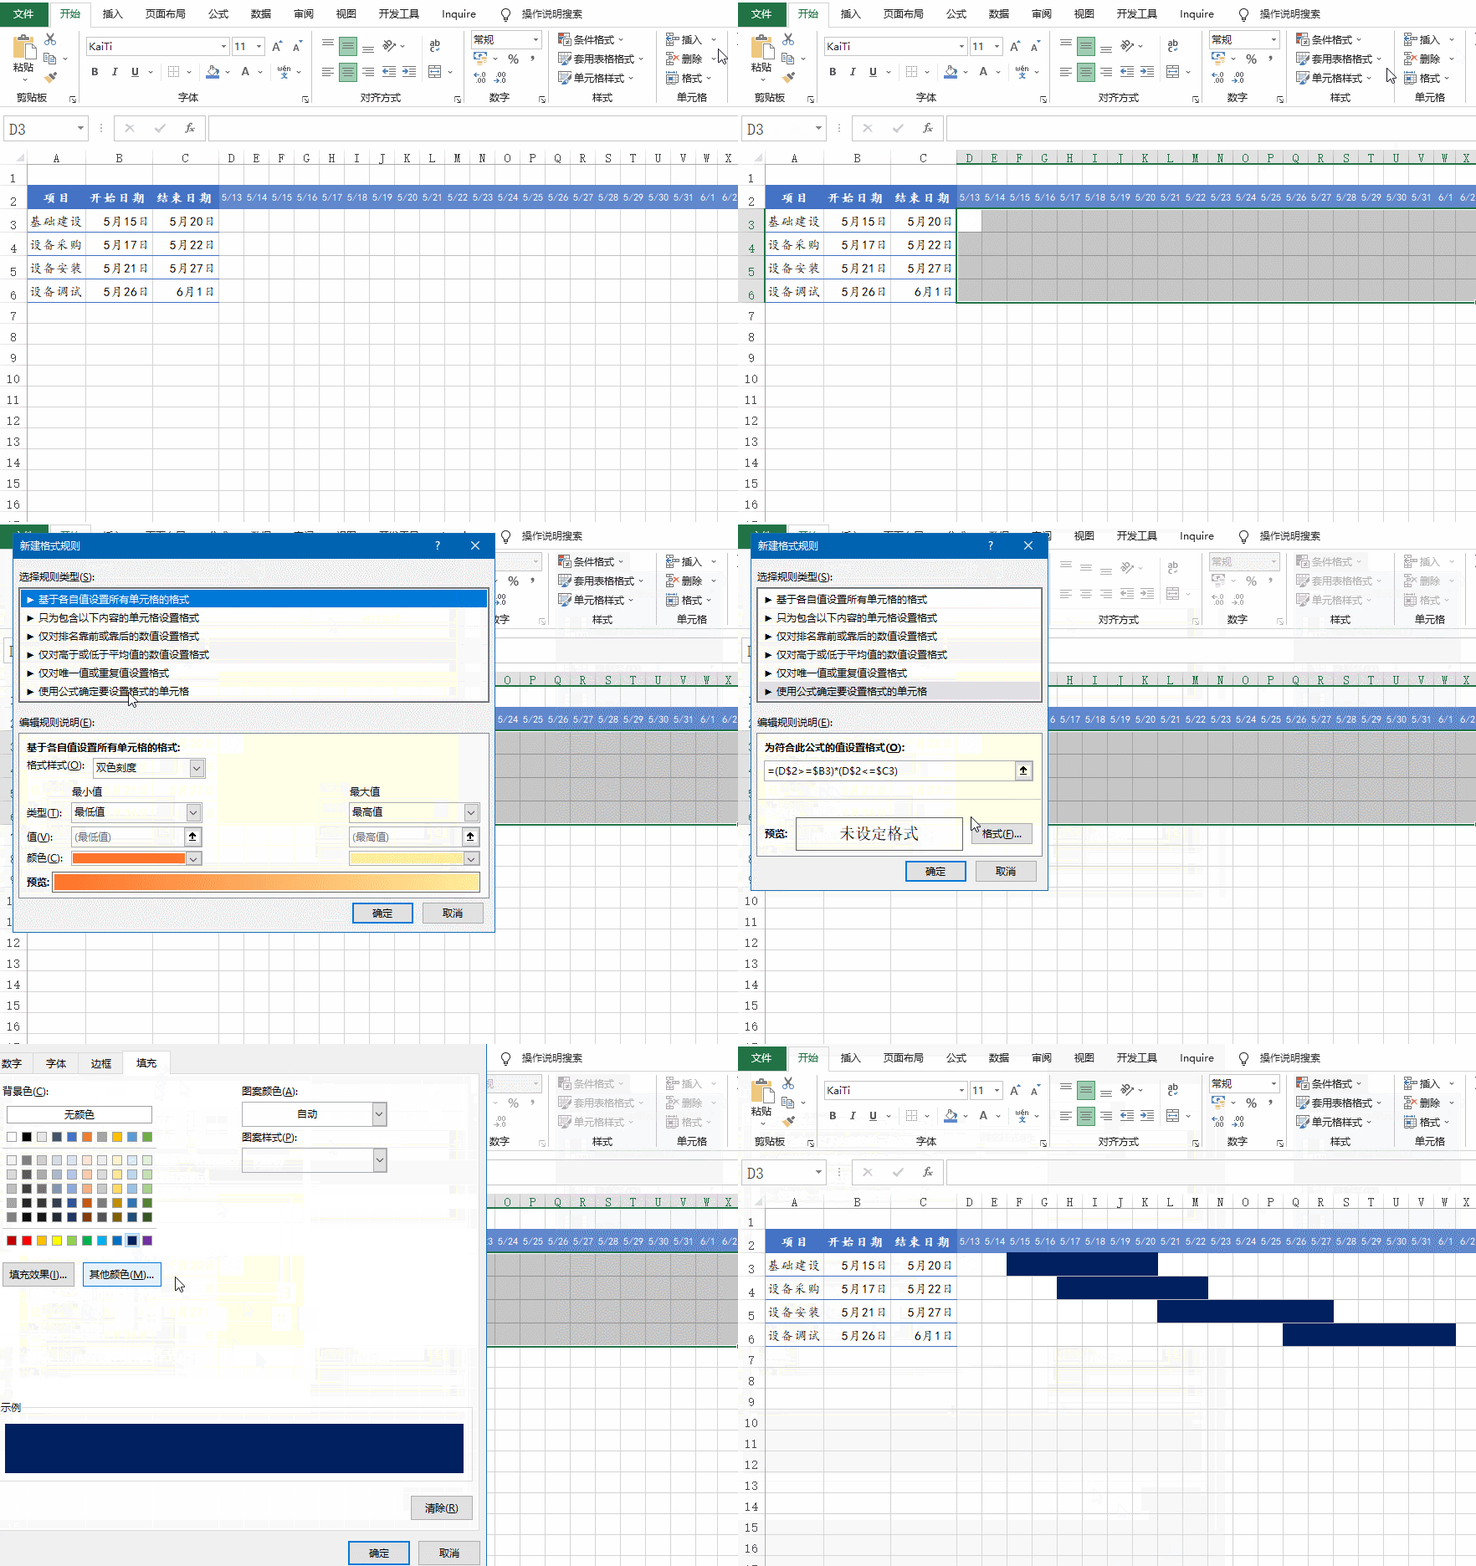
Select D3:X6, [Start] → [Conditional Formatting] → [New Rule] → Use the formula:
=(D$2>=$B3)*(D$2< ;=$C3)
Click the [Format] button to set the fill color.
Pay attention to the changes in the reference method in the formula.
Select D3:X6, [Start]→[Conditional Formatting]→[New Rule]→Use the formula as :
=D$2=TODAY()
Click the [Format] button and set the right border to red.
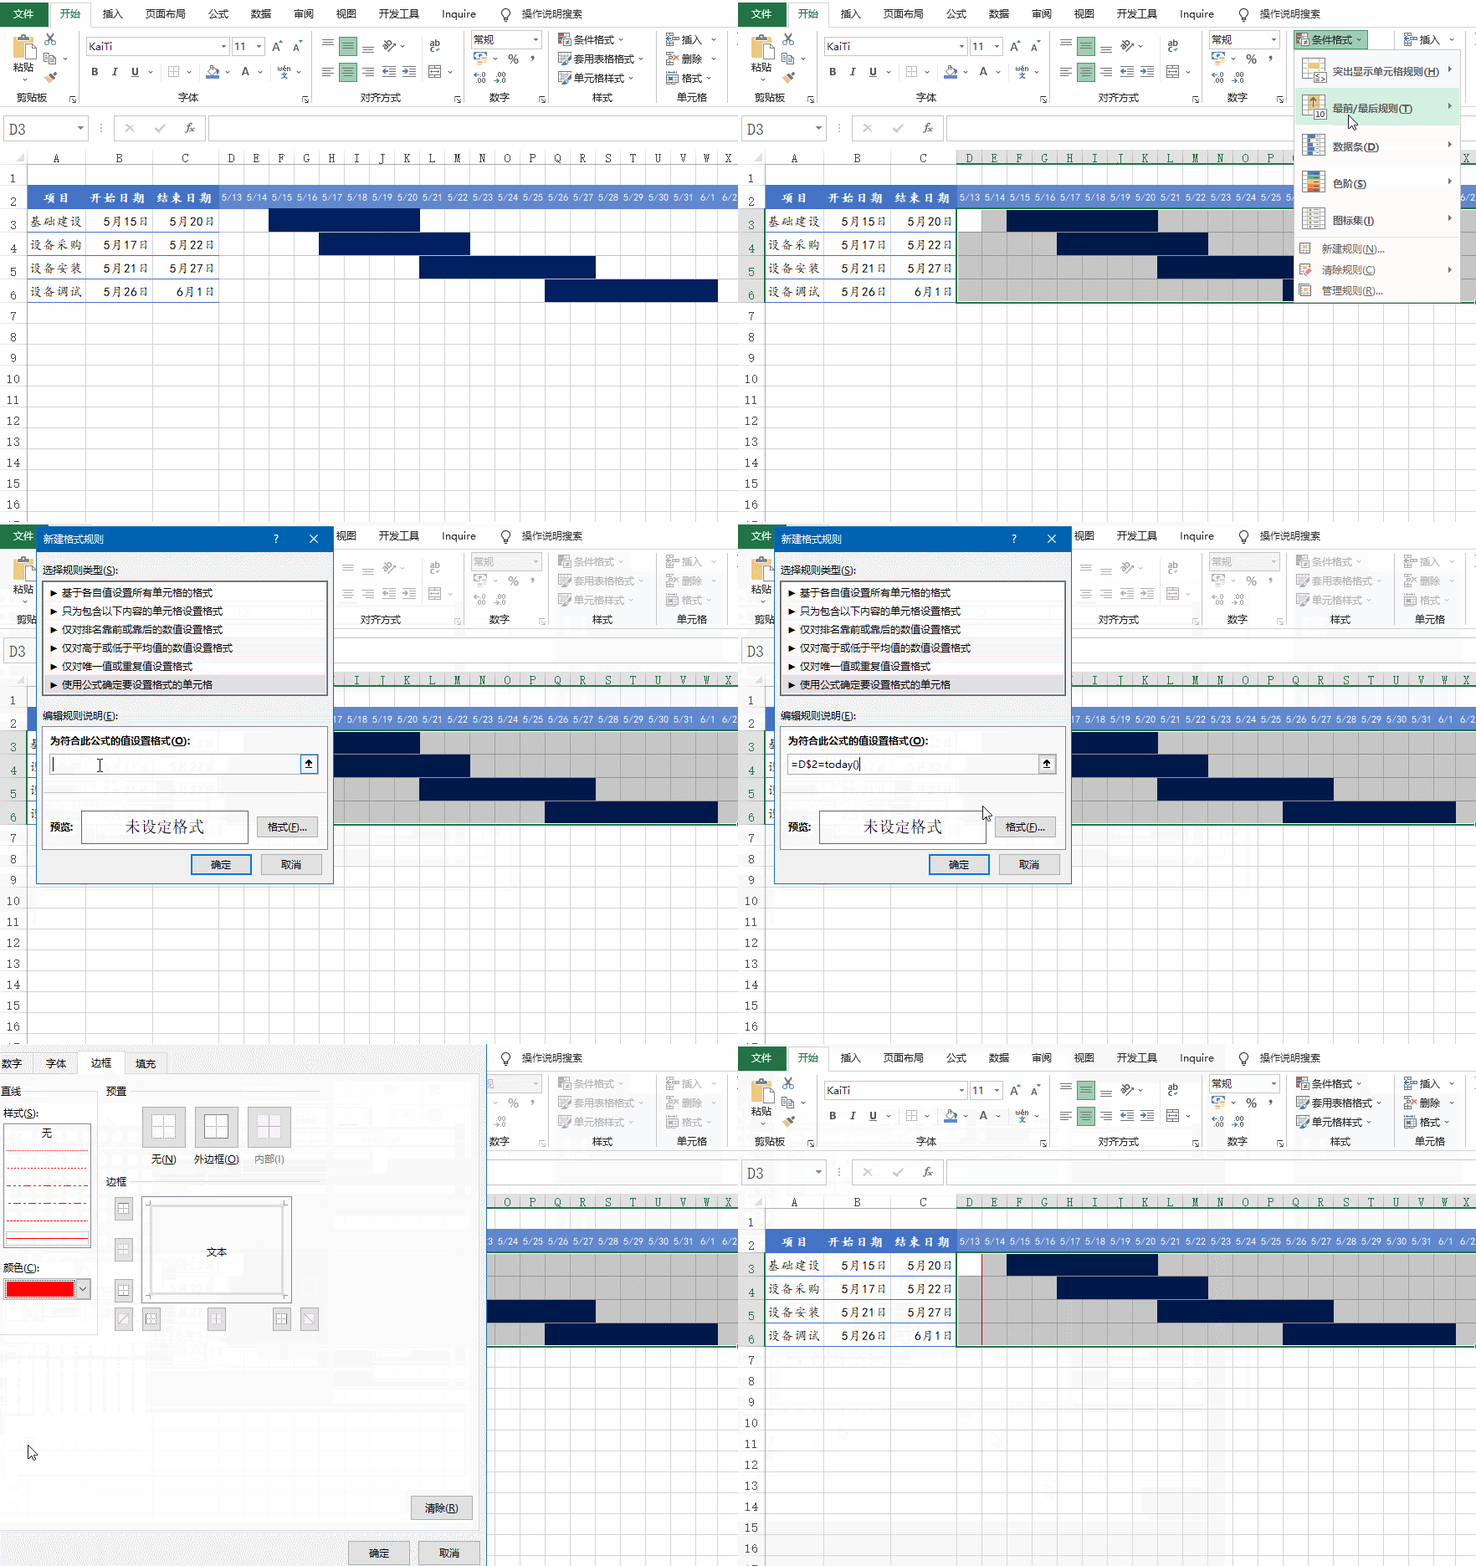
OK, let’s take a look at the effect:
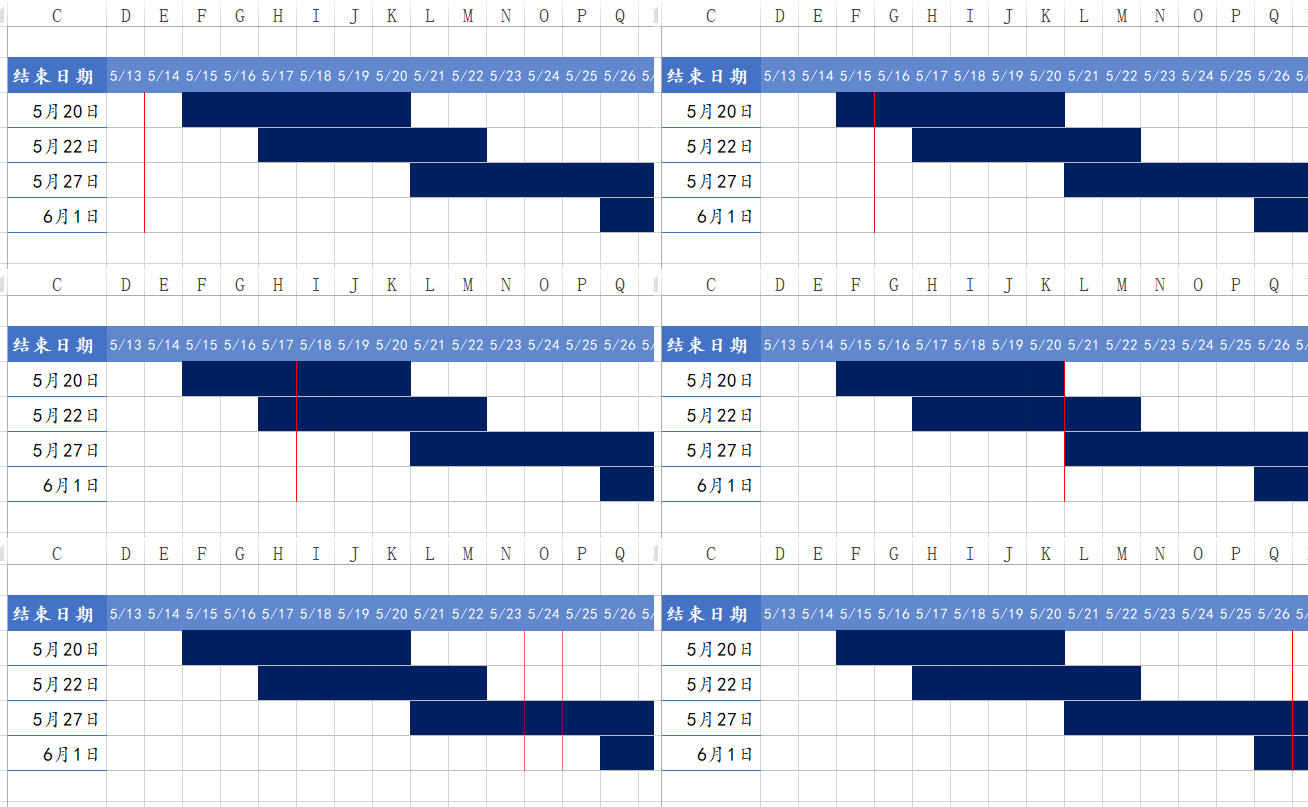
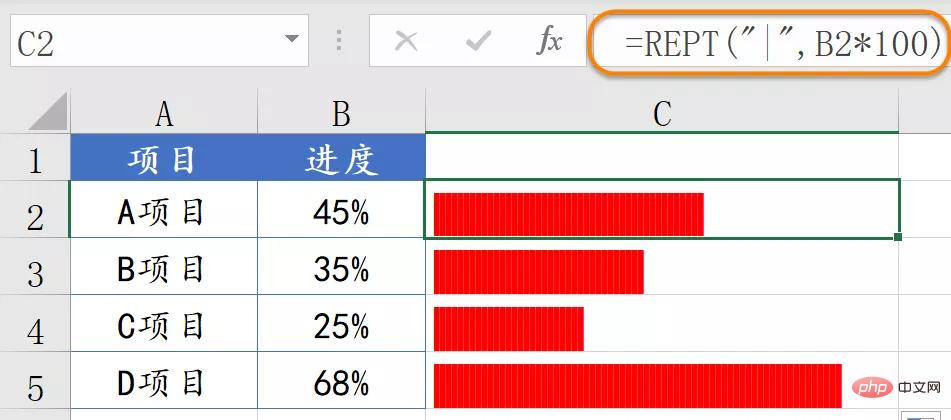
If you want to show the progress percentage, the following effect is also good:
The above is the detailed content of Example Analysis: How to use conditional formatting to create a project progress chart in Excel. For more information, please follow other related articles on the PHP Chinese website!
 Compare the similarities and differences between two columns of data in excel
 excel duplicate item filter color
 How to copy an Excel table to make it the same size as the original
 Excel table slash divided into two
 Excel diagonal header is divided into two
 Absolute reference input method
 java export excel
 Excel input value is illegal


