
 Backend Development
Python Tutorial
Detailed explanation of the basic parameters of matplotlib.pyplot in Python visualization summary
Backend Development
Python Tutorial
Detailed explanation of the basic parameters of matplotlib.pyplot in Python visualization summary
Detailed explanation of the basic parameters of matplotlib.pyplot in Python visualization summary

This article brings you relevant knowledge about Python, which mainly organizes issues related to the basic parameters of matplotlib.pyplot drawing, including figure, xlabel, grid, etc., as follows Let's take a look, I hope it will be helpful to everyone.

[Related recommendations: Python3 video tutorial ]
1. Introduction to matplotlib
The matplotlib library is a Python library Data visualization tool for drawing two-dimensional and three-dimensional charts
Features:
Use simple drawing statements to achieve complex drawing effects
Use interactive operations to achieve increasingly sophisticated graphic effects
Use embedded LaTex Output printing-level charts, scientific expressions and symbolic text
Achieve fine control over the components of the chart
Three drawing interfaces
pyplot: oriented to the current chart
axes: object-oriented
Pylab: following the matlab style
This article uses plot drawing (Displays the trend change of variables) to display the basic parameters of the drawing, using numpy The library obtains the drawing data (randomly), and the final graphics are not carefully thought out. Everything is mainly about displaying graphics parameters! ! !
Library used:
1 2 |
|
2. Function usage of graphic elements
plot(): Display trend changes of variables
Usage: plt.plot(x, y, c, ls, lw, label, alpha, **kwargs)
x, Y: x, y axis value
C: Set color
LS: Line style of the folding diagram
# LW: The line width of the folding map
## Label: The label text of the markup content
## Alpha: Transparency
**kwargs: Specify the line2D attribute to be used
2.1. figure(): Background color
Usage: figure(num=None, figsize=None, dpi=None, facecolor=None,
edgecolor=None, frameon=True, FigureClass=Figure, clear=False, **kwargs)
num :
If this parameter is not provided, a new figure object will be created and the figure count will be increased. A numerical value that is stored in a numeric property of the figure object. If this parameter is present and a figure object corresponding to id exists, the figure object for id is activated. If the figur object corresponding to id does not exist, create it and return it. If the value of num is a string, the window title is set to this string
figsize: width and height in inches, the default value is rc figure.figsize (1 inch Equal to 2.54 cm)
dpi: figure resolution, the default value is rc figure.dpi
facecolor: Background color
1 2 3 4 5 6 7 8 9 10 |
|
2.2  xlim() and ylim():Set the numerical display range of x and y axes
 xlim() and ylim():Set the numerical display range of x and y axes
How to use :plt.xlim(xmin,xmax)
xmin:x 轴上的最小值
xmax:x 轴上的最大值
2.3 xlabel()和 ylabel():设置 x,y 轴的标签文本
使用方法:plt.xlabel(fontsize, verticalalignment, horizontalalignment, rotation, bbox)
fontsize:数字或者(small,large,medium)
verticalalignment:距离坐标轴的位置(top,bottom,center,baseline)
hoizontalalignment:位置(center,right,left)
ratation:位置(vertical,horizontal,vertical)
bbox:添加边框
2.4 grid():绘制刻度线的网格线
使用方法:plt.grid(linestyle, color)
2.5 axhline():绘制平行于 x 轴额度水平参考线
使用方法:plt.axhline(y, c, ls, lw, label)
y:水平参考线的出发点
1 2 3 4 5 6 7 8 9 10 11 12 13 14 15 16 17 |
|

(上图中绿色的线即为axjline()添加的参考线)
2.6 axvspan():绘制垂直于 x 轴的参考区域
使用方法:plt.axvspan( xmin, xmax ,facecolor, alpha)
xmin:参考区域的起始位置
xmax:参考区域的终止位置
facecolor:参考区域的填充颜色
alpha:参考区域填充颜色的透明度,[0~1]
注:其使用方法也可以用在 axhspan()上
在上一段代码添加
1 2 3 4 |
|
即得到(注意:此段是区域)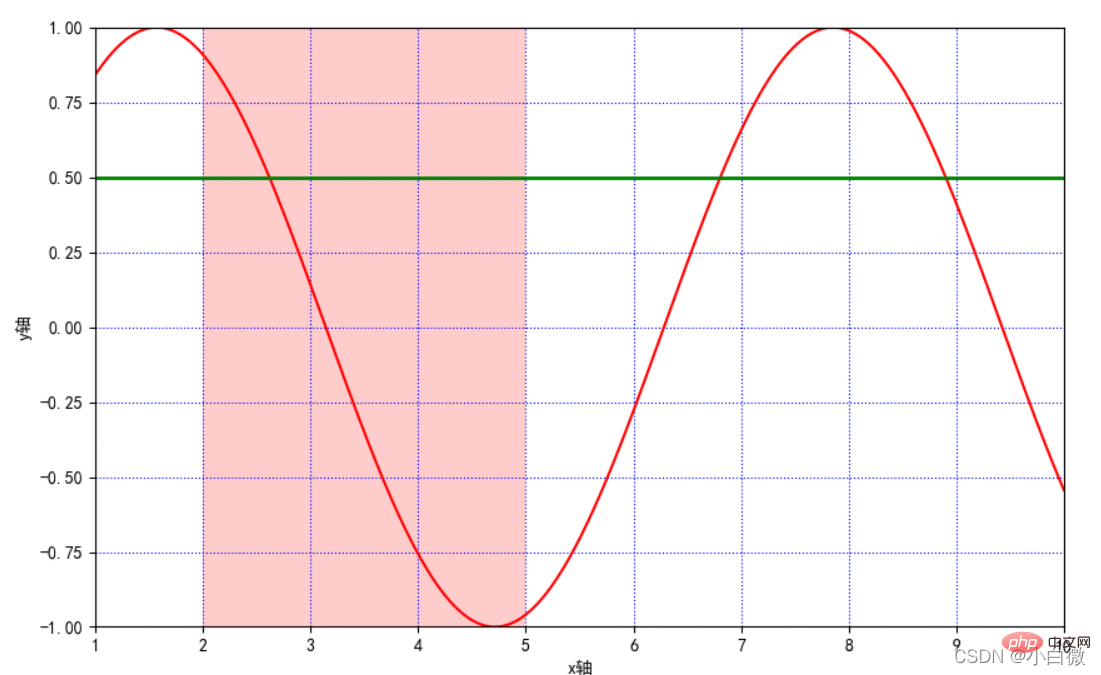
2.7 xticks(),yticks()
获取或设置当前 x 轴或 y 轴刻度位置和标签(即设置 x 或 y 轴的标 签)
可以理解为设置xilim和ylim一样的效果,但可以指定范围和距离
1 |
|
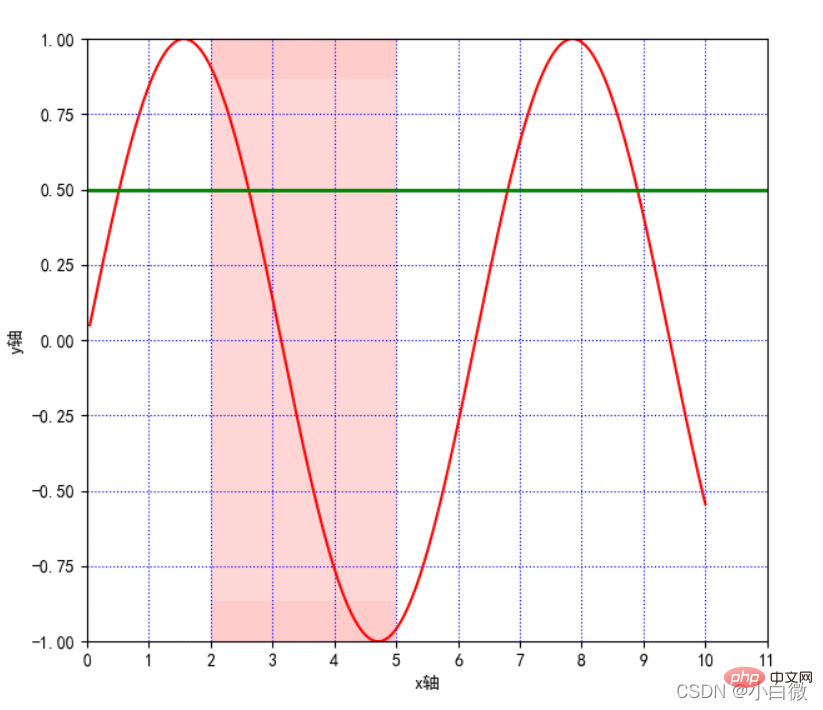
注意看x轴,从原来的0~10到现在的0~11,可以通过设置第三个参数设置步长,这里设置为1
2.8 annotate():添加图形内容细节的指向型注释文本
函数方法:plt.annotate()
s:注释文本内容
xy:被注释的坐标点
xytext:注释文字的坐标位置
weight: Set the font line style (Ultralight, light, normal, regular, book, medium, roman, semibold, demibold, demi, bold, heavy, extrabold, black)
color: Set the font color; you can also set the RGB or RGBA type color; but it must be a floating point number between [0,1]
xycoords= The parameters are as follows
figure points: The points in the lower left corner of the figure
figure pixels: the pixels in the lower left corner of the figure
figure fraction: the lower left part of the figure
axes points: points at the lower left of the coordinate axis
axes pixels: the pixels at the lower left of the coordinate axis
data: Use the coordinate system of the annotated object
Arrow props: arrow parameters, parameter type is dictionary dict
width: the width of the arrow
headwidth: The width in points at the bottom of the arrow
headlength: the length of the arrow
shrink: part of the total length, "shrunk" from both ends
facecolor: arrow color (if the arrowstyle keyword is set, none of the above parameters can be used, but
To use these:
## because ##
##
##
####
####
####
1 2 3 4 5 6 7 8 9 10 11 12 13 14 15 16 |
|

这里的黄色箭头和蓝色细长线即为参数方法添加的参数,实际使用过程中根据自己的实际所需使用,可以认为添加对图像的一些解释
2.9 bbox:给标题增加外框
(boxstyle:方框外形;circle:椭圆;darrow:双向箭头;larrow:箭头向左;rarrow:箭
头向右;round:圆角矩形;round4:椭长方形;roundtooth:波浪形边框 1;sawtooth:
波浪形边框 2;square:长方形)
2.10 . text():添加图形内容细节的无指向型注释文本(水印)
函数方法:plt.text()
x,y:表示坐标轴上的值
weight:
ultralightlight
normal
regular
book
medium
roman
semibold
demibold
demi
bold
heavy
extrabold
black
xycoodrds:
figure points:图左下角的点
figure pixels:图左下角的像素
figure fraction:图的左下部分
axes points:坐标轴左下的点
data:使用被注释对象的坐标系统
arrowprops:箭头参数,参数类型为字典 dict
width:箭头的宽度
headwidth:箭头底部以点为单位的宽度
headlength:箭头的长度
shrink:总长度的一部分,从两端“收缩”
facecolor:箭头颜色
bbox:给标题增加外框
boxstyle:方框外形
circle:椭圆
darrow:双向箭头
larrow:箭头向左
rarrow:箭头向右
round:圆角矩形
round4:椭长方形
roundtooth:波浪形边框 1
sawtooth:波浪形边框 2
square:长方形
1 2 3 4 |
|
这里设置在坐标(1,1)上,即文字下面y=sinx的蓝色字段
2.11. title():添加图形内容的标题
1 |
|

2.12. legend():标示不同图形的文本标签图例
使用方法:plt.legeng()
图例在图中的地理位置:
best
upper right
upper left
lower left
lower right
right
center left
center right
lower center
upper center
center
1 |
|

2.13 table():向子图中添加表格
plt.table(cellText=None, cellColours=None, cellloc='right' ,colWidths=None,
rowLabels=None, rowColours=None, collLabels=None, colColours=None,
collloc='center', loc='bpttpm', bbox=None, edges='closed', **kwargs)
cellText:表格单元格文本。类型为二维字符串列表
cellColours:表格单元格背景色。类型为二位颜色值列表
cellloc:表格单元格文本的对齐方式。默认值为right
colWidths:表格单元格宽度。类型为浮点数列表
rowLabels:表格行表头文本。类型为字符串列表
rowColours:表格行表头背景色。类型为颜色列表
colLabels:表格列表头文本。类型为字符串列表
colLoc:表格行表头文本对齐方式。默认 right
colColours:表格列表头背景色。类型为颜色列表
loc:单元格相对于子图的位置
bbox:绘制表格的边界框,如果此参数不为 None,将会覆盖 loc 参数
edges:单元格边线,该属性会影响各类单元格背景色
3. 完整代码显示
1 2 3 4 5 6 7 8 9 10 11 12 13 14 15 16 17 18 19 20 21 22 23 24 25 26 27 28 29 30 31 32 33 34 35 36 37 38 39 40 41 42 43 44 45 46 47 48 49 50 51 52 |
|
这串代码用于显示中文字符
1 2 |
|
无论画什么图,最后都得使用plt.show()用于展示图片,否则输出为空
4.折线图的线条风格
1 2 3 4 5 6 7 8 9 10 11 12 13 14 15 16 17 18 19 20 21 22 23 |
|
5. 常用颜色缩写
1 2 3 4 5 6 7 8 |
|
【相关推荐:Python3视频教程 】
The above is the detailed content of Detailed explanation of the basic parameters of matplotlib.pyplot in Python visualization summary. For more information, please follow other related articles on the PHP Chinese website!
Hot AI Tools

Undresser.AI Undress
AI-powered app for creating realistic nude photos

AI Clothes Remover
Online AI tool for removing clothes from photos.

Undress AI Tool
Undress images for free

Clothoff.io
AI clothes remover

Video Face Swap
Swap faces in any video effortlessly with our completely free AI face swap tool!
Hot Article
Hot Tools

Notepad++7.3.1
Easy-to-use and free code editor

SublimeText3 Chinese version
Chinese version, very easy to use

Zend Studio 13.0.1
Powerful PHP integrated development environment

Dreamweaver CS6
Visual web development tools

SublimeText3 Mac version
God-level code editing software (SublimeText3)
Hot Topics
 1393
1393
 52
52

 PHP and Python: Different Paradigms Explained
Apr 18, 2025 am 12:26 AM
PHP and Python: Different Paradigms Explained
Apr 18, 2025 am 12:26 AM
PHP is mainly procedural programming, but also supports object-oriented programming (OOP); Python supports a variety of paradigms, including OOP, functional and procedural programming. PHP is suitable for web development, and Python is suitable for a variety of applications such as data analysis and machine learning.
 Choosing Between PHP and Python: A Guide
Apr 18, 2025 am 12:24 AM
Choosing Between PHP and Python: A Guide
Apr 18, 2025 am 12:24 AM
PHP is suitable for web development and rapid prototyping, and Python is suitable for data science and machine learning. 1.PHP is used for dynamic web development, with simple syntax and suitable for rapid development. 2. Python has concise syntax, is suitable for multiple fields, and has a strong library ecosystem.
 Can visual studio code be used in python
Apr 15, 2025 pm 08:18 PM
Can visual studio code be used in python
Apr 15, 2025 pm 08:18 PM
VS Code can be used to write Python and provides many features that make it an ideal tool for developing Python applications. It allows users to: install Python extensions to get functions such as code completion, syntax highlighting, and debugging. Use the debugger to track code step by step, find and fix errors. Integrate Git for version control. Use code formatting tools to maintain code consistency. Use the Linting tool to spot potential problems ahead of time.
 Can vs code run in Windows 8
Apr 15, 2025 pm 07:24 PM
Can vs code run in Windows 8
Apr 15, 2025 pm 07:24 PM
VS Code can run on Windows 8, but the experience may not be great. First make sure the system has been updated to the latest patch, then download the VS Code installation package that matches the system architecture and install it as prompted. After installation, be aware that some extensions may be incompatible with Windows 8 and need to look for alternative extensions or use newer Windows systems in a virtual machine. Install the necessary extensions to check whether they work properly. Although VS Code is feasible on Windows 8, it is recommended to upgrade to a newer Windows system for a better development experience and security.
 Is the vscode extension malicious?
Apr 15, 2025 pm 07:57 PM
Is the vscode extension malicious?
Apr 15, 2025 pm 07:57 PM
VS Code extensions pose malicious risks, such as hiding malicious code, exploiting vulnerabilities, and masturbating as legitimate extensions. Methods to identify malicious extensions include: checking publishers, reading comments, checking code, and installing with caution. Security measures also include: security awareness, good habits, regular updates and antivirus software.
 Python vs. JavaScript: The Learning Curve and Ease of Use
Apr 16, 2025 am 12:12 AM
Python vs. JavaScript: The Learning Curve and Ease of Use
Apr 16, 2025 am 12:12 AM
Python is more suitable for beginners, with a smooth learning curve and concise syntax; JavaScript is suitable for front-end development, with a steep learning curve and flexible syntax. 1. Python syntax is intuitive and suitable for data science and back-end development. 2. JavaScript is flexible and widely used in front-end and server-side programming.
 PHP and Python: A Deep Dive into Their History
Apr 18, 2025 am 12:25 AM
PHP and Python: A Deep Dive into Their History
Apr 18, 2025 am 12:25 AM
PHP originated in 1994 and was developed by RasmusLerdorf. It was originally used to track website visitors and gradually evolved into a server-side scripting language and was widely used in web development. Python was developed by Guidovan Rossum in the late 1980s and was first released in 1991. It emphasizes code readability and simplicity, and is suitable for scientific computing, data analysis and other fields.
 How to run programs in terminal vscode
Apr 15, 2025 pm 06:42 PM
How to run programs in terminal vscode
Apr 15, 2025 pm 06:42 PM
In VS Code, you can run the program in the terminal through the following steps: Prepare the code and open the integrated terminal to ensure that the code directory is consistent with the terminal working directory. Select the run command according to the programming language (such as Python's python your_file_name.py) to check whether it runs successfully and resolve errors. Use the debugger to improve debugging efficiency.
