Recommended learning: mysql video tutorial
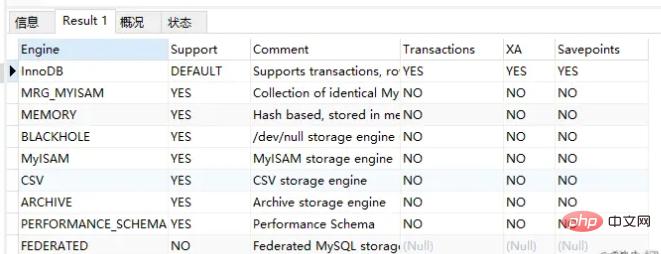
View execution engine and default engine.

SHOW PROCESSLIST is very useful to view the usage of the current database connection and various status information. SHOW PROCESSLIST; Only the first 100 items are listed. If you want to list all, please use SHOW FULL PROCESSLIST;

Attribute columns and meanings:
| id | An identifier, very useful when you want to kill a statement. |
|---|---|
| user | Display the current user. If you are not root, this command will only display the sql statements within your authority. |
| host | Shows which IP and which port this statement is sent from. Can be used to track the user who posted the problematic statement. |
| db | Displays which database this process is currently connected to. |
| command | Displays the executed command of the current connection, usually sleep, query, and connect. |
state column and its meaning, the status listed by mysql:
| Checking table | is Check the datasheet (this is automatic). |
|---|---|
| Closing tables | The modified data in the table is being flushed to disk, and the exhausted table is being closed. This is a quick operation, but if this is not the case, you should verify that the disk space is full or that the disk is under heavy load. |
| Connect Out | The replication slave server is connecting to the master server. |
| Copying to tmp table on disk | Since the temporary result set is larger than tmp_table_size (default 16M), the temporary table is being converted from memory storage to disk storage to save memory. . |
| Creating tmp table | A temporary table is being created to store part of the query results. |
| deleting from main table | The server is performing the first part of a multi-table delete and has just deleted the first table. |
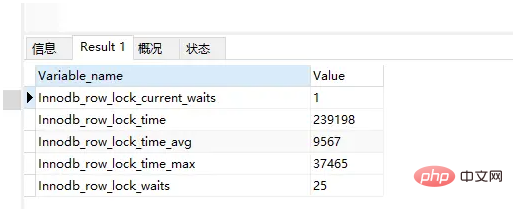
InnoDB's row-level lock status variable.

InnoDB's row-level lock status variable not only records the number of lock waits, but also records the total lock duration, the average duration each time, and the maximum duration. In addition, there is a non- The cumulative status amount shows the number of waits currently waiting for a lock. The description of each status quantity is as follows:
For these five status variables, the more important ones are InnoDB_row_lock_time_avg (average waiting time), InnoDB_row_lock_waits (total number of waiting times) and InnoDB_row_lock_time (total waiting time). Especially when the number of waits is high and the length of each wait is not small, we need to analyze why there are so many waits in the system, and then start specifying an optimization plan based on the analysis results.
If you find that the lock contention is serious, such as the values of InnoDB_row_lock_waits and InnoDB_row_lock_time_avg are relatively high, you can also set InnoDB Monitors to further observe the tables and data rows where lock conflicts occur, and analyze the reasons for the lock contention.
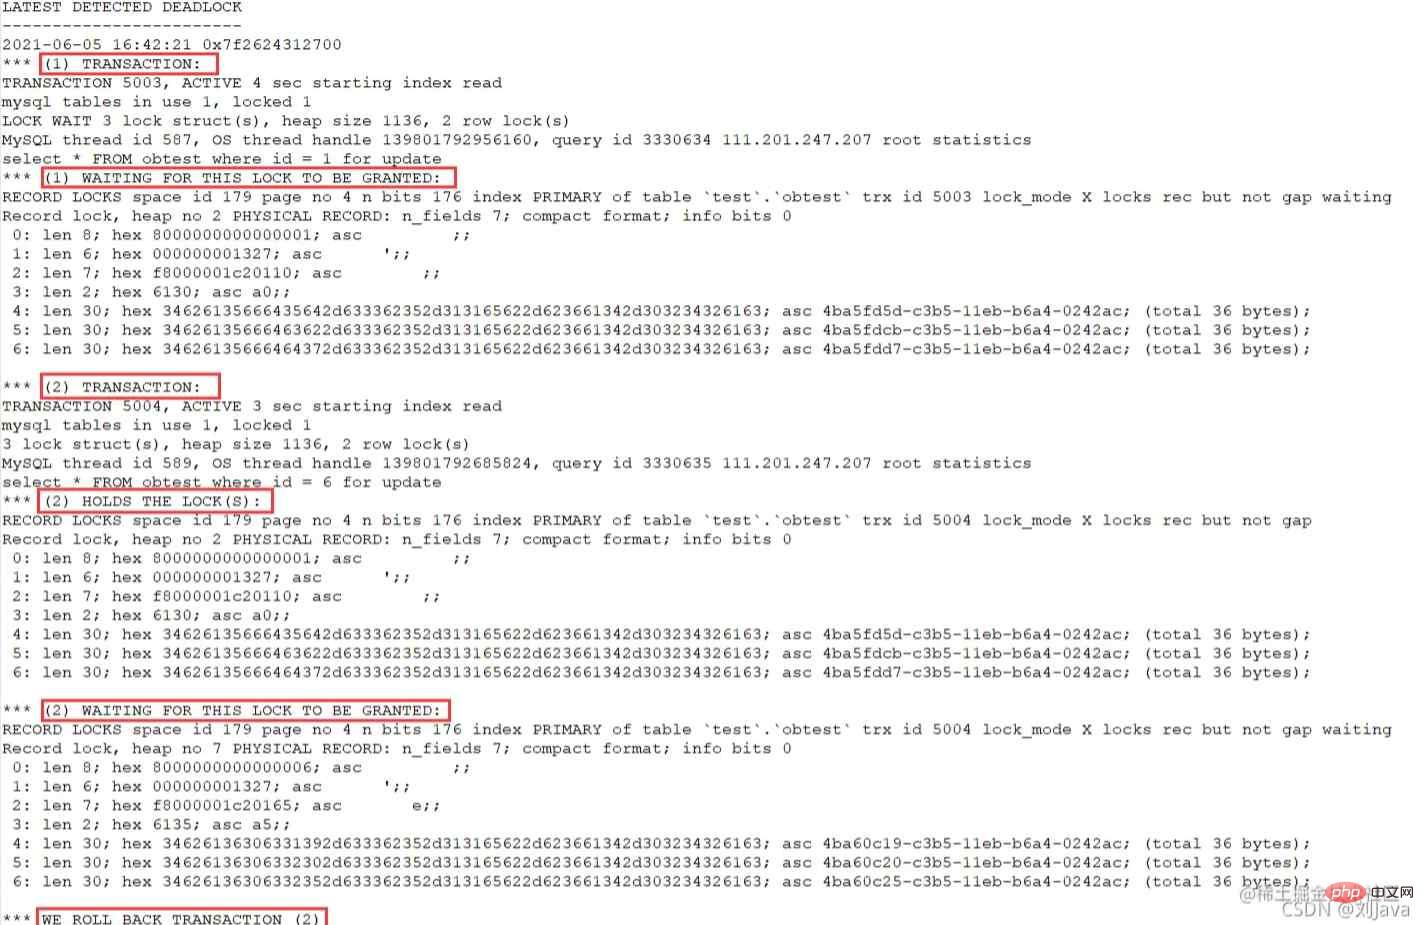
SHOW ENGINE INNODB STATUS command will output a lot of information currently monitored by the InnoDB monitor. Its output is a single string, without rows and columns, and the content It is divided into many small sections, each section corresponding to information about different parts of the innodb storage engine. Some of the information is very useful for innodb developers.
There is a section LATEST DETECTED DEADLOCK, which is the last recorded deadlock information, as shown in the following case:

CREATE TABLE contacts(
    contact_id INT AUTO_INCREMENT,
    first_name VARCHAR(100) NOT NULL comment 'first name',
    last_name VARCHAR(100) NOT NULL,
    email VARCHAR(100),
    phone VARCHAR(20),
    PRIMARY KEY(contact_id),
    UNIQUE(email),
    INDEX phone(phone) ,
    INDEX names(first_name, last_name) comment 'By first name and/or last name'
);CREATE PROCEDURE zqtest ( ) BEGIN DECLARE i INT DEFAULT 0; DECLARE j VARCHAR ( 100 ) DEFAULT 'first_name'; DECLARE k VARCHAR ( 100 ) DEFAULT 'last_name'; DECLARE l VARCHAR ( 100 ) DEFAULT 'email'; DECLARE m VARCHAR ( 20 ) DEFAULT '11111111111'; SET i = 0; START TRANSACTION; WHILE i < 50000 DO IF MOD ( i, 100 ) = 0 THEN SET j = CONCAT( 'first_name', i ); END IF; IF MOD ( i, 200 ) = 0 THEN SET k = CONCAT( 'last_name', i ); END IF; IF MOD ( i, 50 ) = 0 THEN SET m = CONCAT( '', CAST( m as UNSIGNED) + i ); END IF; INSERT INTO contacts ( first_name, last_name, email, phone ) VALUES ( j, k, CONCAT(l,i), m ); SET i = i + 1; END WHILE; COMMIT; END;

| Table name | |
|---|---|
| The unique index is 0, and other indexes are 1. The primary key index is also the only index. | |
| Index name. If the names are the same, it means it is the same index and it is a joint index. Each row represents a column in the joint index. | |
| The column sequence number in the index, starting from 1. It can also indicate the order of the column in the joint index. | |
| Index column name, if it is a joint index, it is the name of a certain column | |
| How the column is stored in the index, It probably means character order. | |
| The number of different values on an index is called "cardinality", also known as distinction degree, the larger the base, the better the index distinction. The statistics of this value are not necessarily accurate and can be corrected using ANALYZE TABLE. | |
| prefix index. If the column is only partially indexed, the number of characters indexed. NULL if the entire column's values are indexed. | |
| How keywords are compressed. NULL if not compressed. Compression generally includes compression transport protocols, compressed column solutions and compressed table solutions. | |
| If the column value can contain null, YES | |
| Index structure Types, common ones include FULLTEXT, HASH, BTREE, RTREE | |
| Comments |
The above is the detailed content of Common SQL statements for database optimization in MySQL (summary sharing). For more information, please follow other related articles on the PHP Chinese website!