nodeWhat should I do if the service CPU is too high? How to check? The following article will sort out and share with you the troubleshooting ideas for node service CPU being too high. I hope it will be helpful to you!

Help a colleague look at a problem of excessive CPU
Finally, we summarized the troubleshooting ideas, as follows , welcome to add
Some problems can be solved by restarting the instance.
Restart the instance first. This is a necessary step to make the service available first. If the subsequent CPU still surges too fast, you may have to consider rolling back the code first. If the surge is not fast, you don’t need to roll back and troubleshoot the problem as soon as possible
Command 1: top
[root@*** ~]# top

PID USER      PR  NI    VIRT    RES    SHR S  %CPU %MEM     TIME+ COMMAND
680 root      20   0 2290976 168176  34976 S  30.3  2.0 103:42.59 node
687 root      20   0 2290544 166920  34984 R  26.3  2.0  96:26.42 node
 52 root      20   0 1057412  23972  15188 S   1.7  0.3  11:25.97 ****
185 root      20   0  130216  41432  25436 S   0.3  0.5   1:03.44 ****
...
Command 2: vmstat
[root@*** ~]# vmstat 2
procs -----------memory---------------- ---swap-- -----io---- --system-- -----cpu-----
 r  b      swpd  free   buff   cache      si   so    bi    bo   in cs   us sy id wa st
 0  0      0 233481328 758304 20795516    0    0     0     1    0    0  0  0 100  0  0
 0  0      0 233480800 758304 20795520    0    0     0     0  951 1519  0  0 100  0  0
 0  0      0 233481056 758304 20795520    0    0     0     0  867 1460  0  0 100  0  0
 0  0      0 233481408 758304 20795520    0    0     0    20  910 1520  0  0 100  0  0
 0  0      0 233481680 758304 20795520    0    0     0     0  911 1491  0  0 100  0  0
 0  0      0 233481920 758304 20795520    0    0     0     0  889 1530  0  0 100  0  0
procs
r #Represents the running queue (that is, how many processes are actually allocated to the CPU), When this value exceeds the number of CPUs, a CPU bottleneck will occur. This is also related to the load of top. Generally, if the load exceeds 3, it is relatively high, if it exceeds 5, it is high, if it exceeds 10, it is abnormal, and the status of the server is very dangerous. The load of top is similar to the run queue per second. If the run queue is too large, it means that your CPU is very busy, which generally results in high CPU usage.
b #Indicates a blocked process, a process waiting for resources. I won’t say much about this, but everyone knows that the process is blocked.
memory
swpd #The size of virtual memory used. If it is greater than 0, it means that your machine's physical memory is insufficient. If it is not the cause of program memory leak, then You should upgrade the memory or migrate memory-consuming tasks to other machines.
free # The size of free physical memory
buff #Linux/Unix system is used to store the contents, permissions, etc. of the directory
cache #cache It is directly used to remember the files we open, buffer the files, and use part of the free physical memory to cache files and directories in order to improve the performance of program execution. When the program uses memory, buffer/cached will be very fast. land is used.
swap
si #The size of the virtual memory read from the disk per second. If this value is greater than 0, it means that the physical memory is not enough or the memory is leaked. You need to find it. Solve the memory-consuming process. My machine has plenty of memory and everything works fine.
so #The size of virtual memory written to disk per second, if this value is greater than 0, same as above.
io
bi #The number of blocks received by the block device per second. The block device here refers to all disks and other block devices on the system. The default block size is 1024byte
bo #The number of blocks sent by the block device per second. For example, when we read a file, bo must be greater than 0. Bi and bo are generally close to 0, otherwise the IO is too frequent and needs to be adjusted.
system
in #The number of CPU interrupts per second, including time interrupts
cs #The number of context switches per second, for example, when we call system functions , it is necessary to perform context switching, thread switching, and process context switching. The smaller the value, the better. If it is too large, consider lowering the number of threads or processes
cpu
us #User CPU time. I was on a server that frequently encrypted and decrypted. I could see that us was close to 100 and the r run queue reached 80 (the machine was doing stress testing and its performance was poor) .
sy #System CPU time, if it is too high, it means that the system call time is long, such as frequent IO operations.
id #Idle CPU time, generally speaking, id us sy = 100, generally I think id is the idle CPU usage, us is the user CPU usage, and sy is the system CPU usage.
wt #Waiting for IO CPU time.
practice
procs r: There are many processes running and the system is very busy.
bi/bo: The amount of data written to the disk is slightly larger. If it is a large file, it should be within 10M. There is basically no need to worry. If it is a small file, it should be within 2M. Basically normal
cpu us: It is continuously greater than 50%, which is acceptable during service peak periods. If it is greater than 50 for a long time, you can consider optimization
cpu sy: The percentage of actual kernel processes, the reference value of us sy here is 80% , if us sy is greater than 80%, it means there may be insufficient CPU.
cpu wa: column shows the percentage of CPU time occupied by IO waiting. The reference value of wa here is 30%. If wa exceeds 30%, it means that the IO wait is serious. This may be caused by a large number of random accesses to the disk, or it may be caused by the bandwidth bottleneck of the disk or disk access controller (mainly block operations)
Reference link: https://www.cnblogs.com/zsql/p/11643750.html
If restarting the instance still does not solve the problem, and it is determined that the problem is the node process,
Check the online commit, check the code diff, and see if the problem can be found. Click
This operation method is the same as my other articleHow to quickly locate SSR server memory leaks Question is similar to
Use node --inspect to start the service
Local simulation of the online environment, use build After the code, direct build may not be usable. Environment variables must be controlled well, and ugly compression must be turned off.
Generate CPU profiler

For example, if the downstream RPC is isolated from the local, then you can only add code to create a profilenodejs.org/docs/latest…

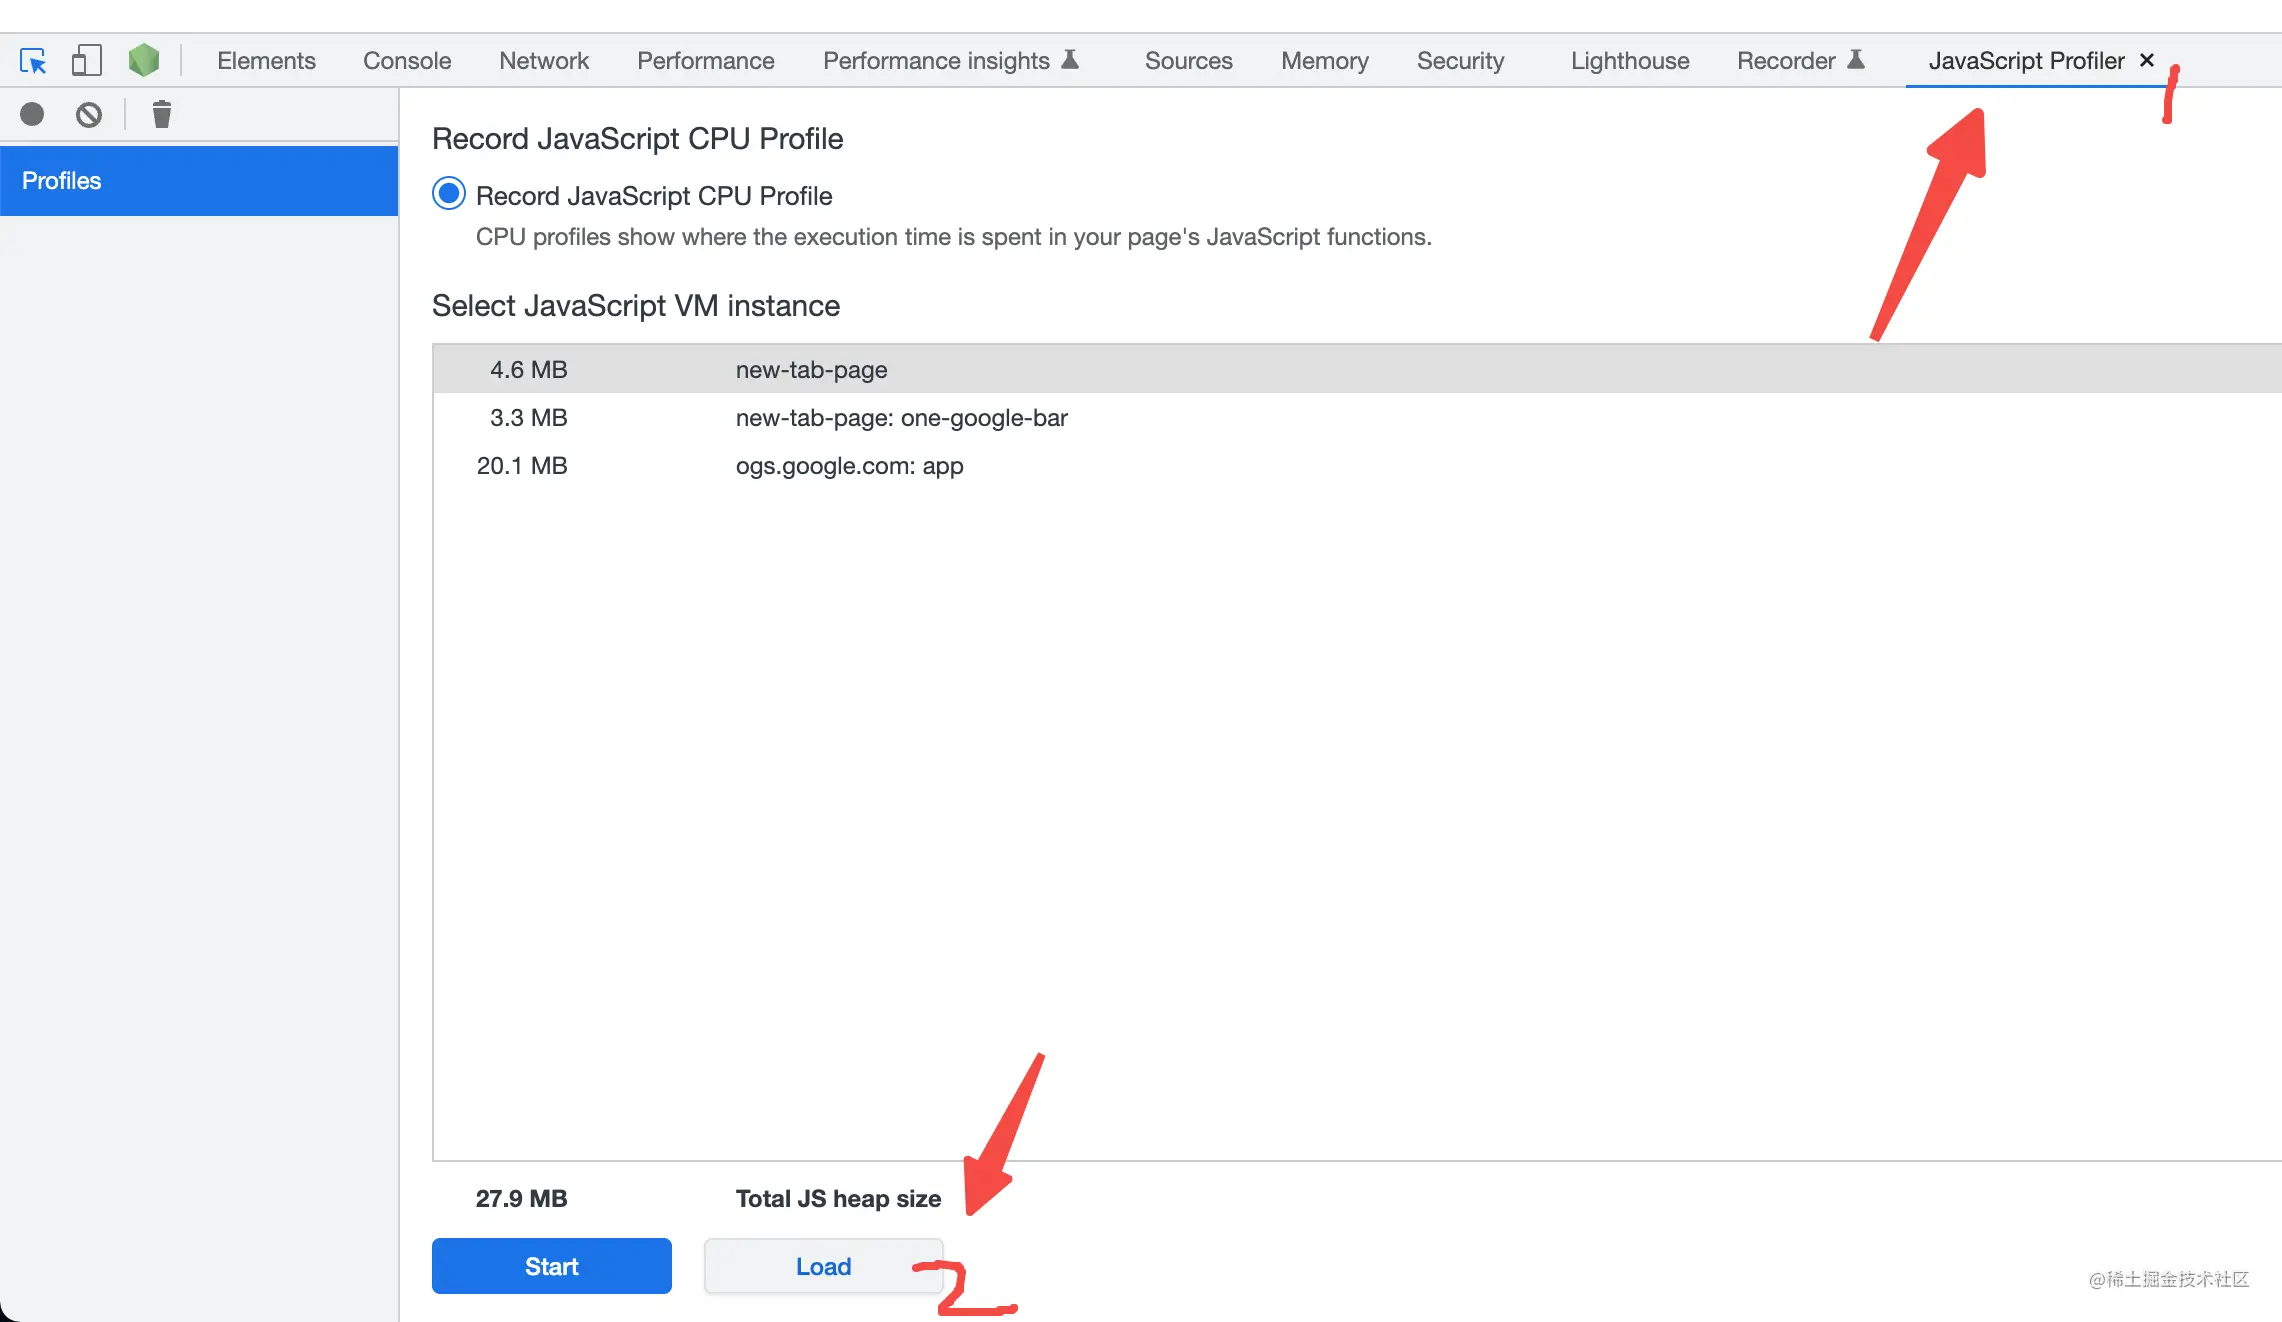
After getting the profile file, open it with chrome devtool

Combine profiler and code diff to find the cause
You can also upload the profile file to www.speedscope.app/ (File upload), you can get the cpu profile flame graph (more detailed introduction: www.npmjs.com/package/spe…

You can use ab, or other stress test tools
Restart the instance
Make sure it is caused by the node process
Look at the code diff
Generate runtime CPU profiler
Combined profiler and code diff to find the cause
Stress test verification
For more node-related knowledge, please visit: nodejs tutorial!
The above is the detailed content of What should I do if the node service CPU is too high? Let's talk about troubleshooting ideas. For more information, please follow other related articles on the PHP Chinese website!
 node.js debugging
 What is the difference between guid and mbr formats
 How to open apk file
 Commonly used database software
 How to use the article tag
 What to do if there is no sound from the computer microphone
 What skills are needed to work in the PHP industry?
 How to run code html in vscode
 The main function of the arithmetic unit in a microcomputer is to perform