

Every front-end project has npm scripts. We will use npm scripts to organize compilation, packaging, lint and other tasks. [Related tutorial recommendations: nodejs video tutorial]
You may often run npm scripts, but you don’t know how these command line tools are implemented.
So if you want to understand the implementation principles of these tools, what should you do?
That’s today’s topic: debugging npm scripts.
There will be a bin field in the package.json of these command line tools to declare which commands:
After npm installs this package, it will Place it in the node_modules/.bin directory:

#So that we can run different tools through node ./node_modules/.bin/xx.
We can also use npx to run, such as npx xx. Its function is to execute the local command under node_modules/.bin. If not, it will be downloaded from npm and then executed.
Of course, the most commonly used one is to put it in npm scripts:

In this way, just run npm run xxx directly.
npm scripts essentially uses node to run these script codes, so debugging them is no different from debugging other node codes.
That is, you can run it like this:
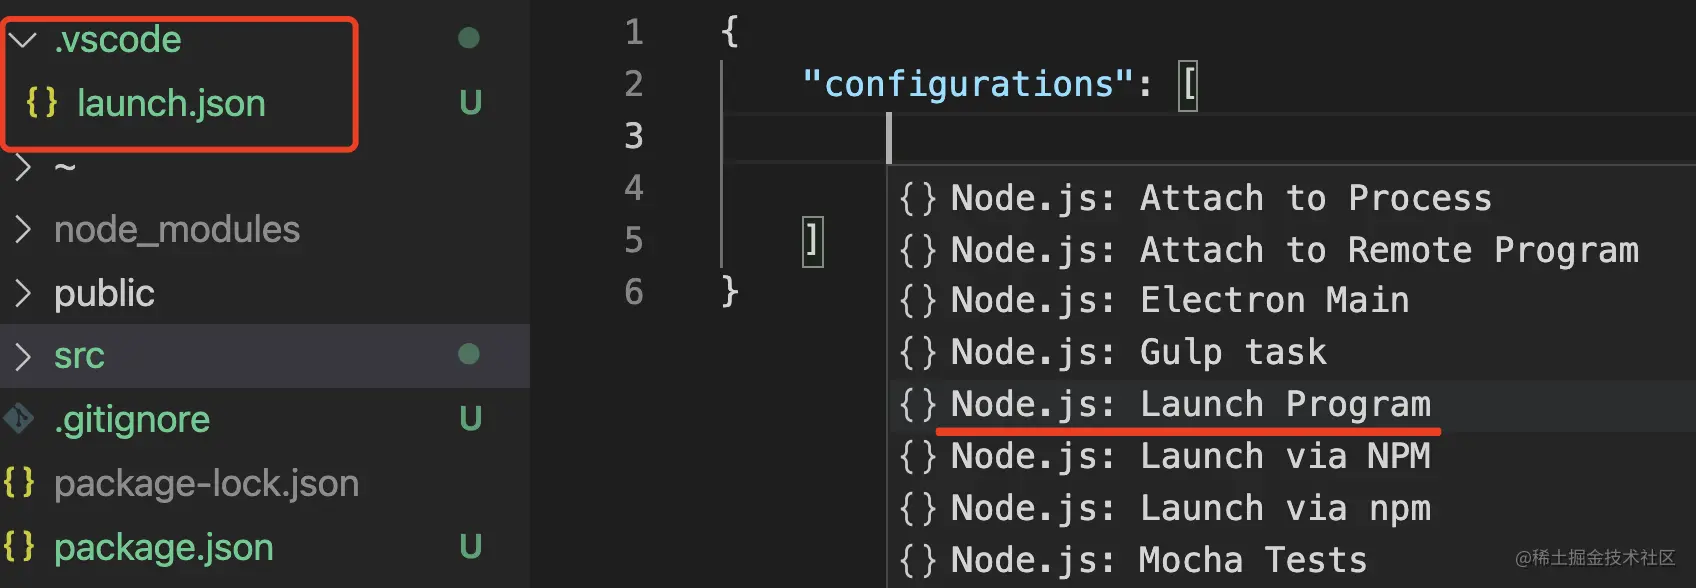
In the debugging file of .vscode/launch.json, select the launch program of node:

Use node to execute the file under node_modules/.bin and pass in the parameters:
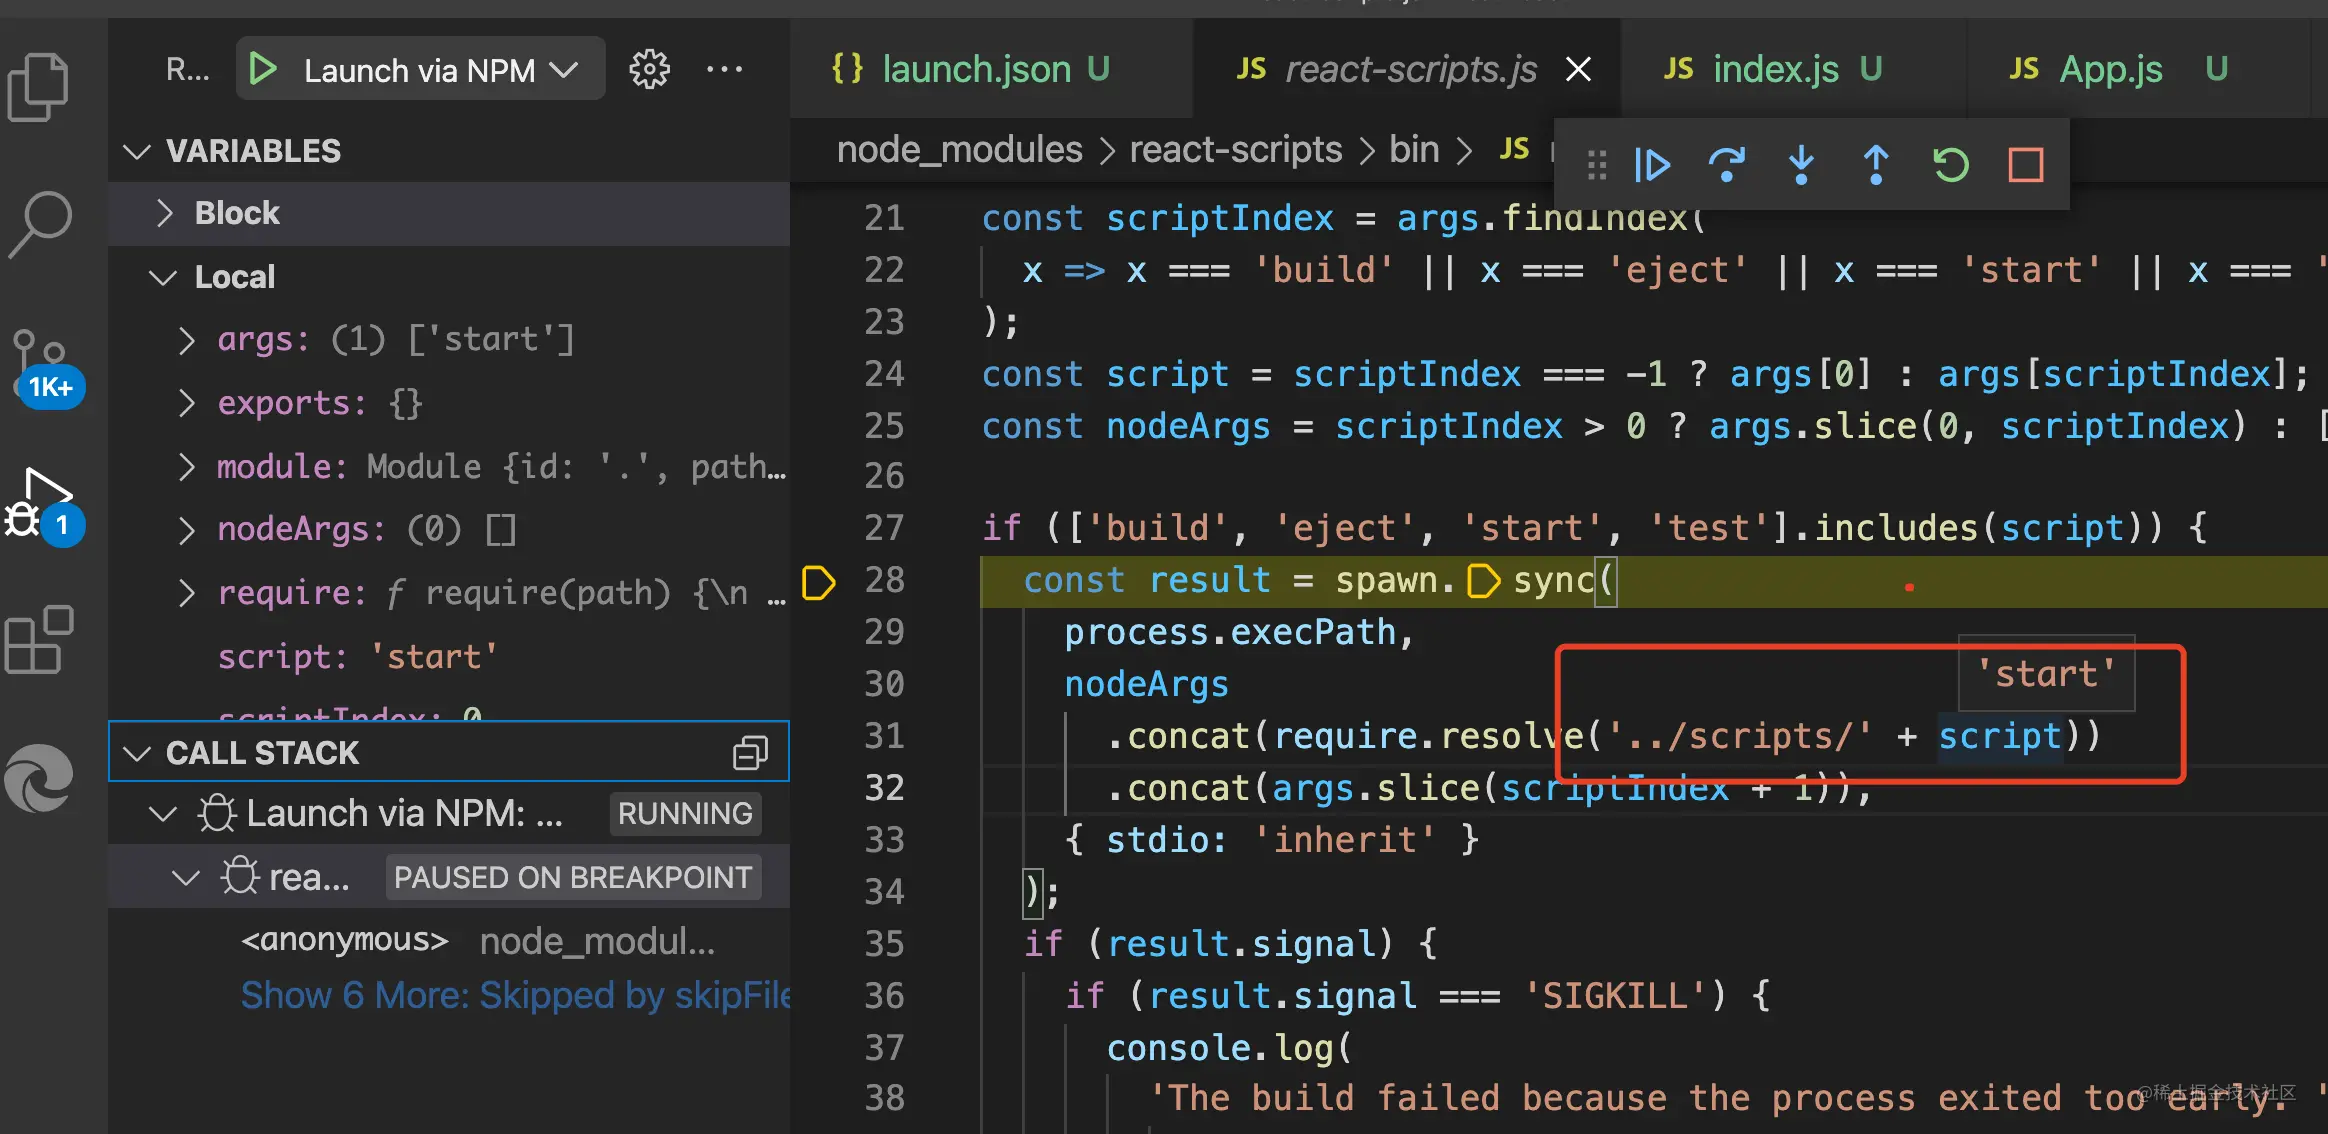
In fact, there is a simpler way. VSCode Debugger does this for npm scripts debugging scenarios. Without encapsulation, you can directly select the npm type debugging configuration:

Just specify the command to run:

For example, we will use the react project created by create-react-app to try to debug npm scripts:
First go to node_modules/.bin and put a breakpoint in this file:

Then click debug to start:

You will find that the start module under scripts will be executed:

Let’s go to start and set a breakpoint:
The code execution stops here:
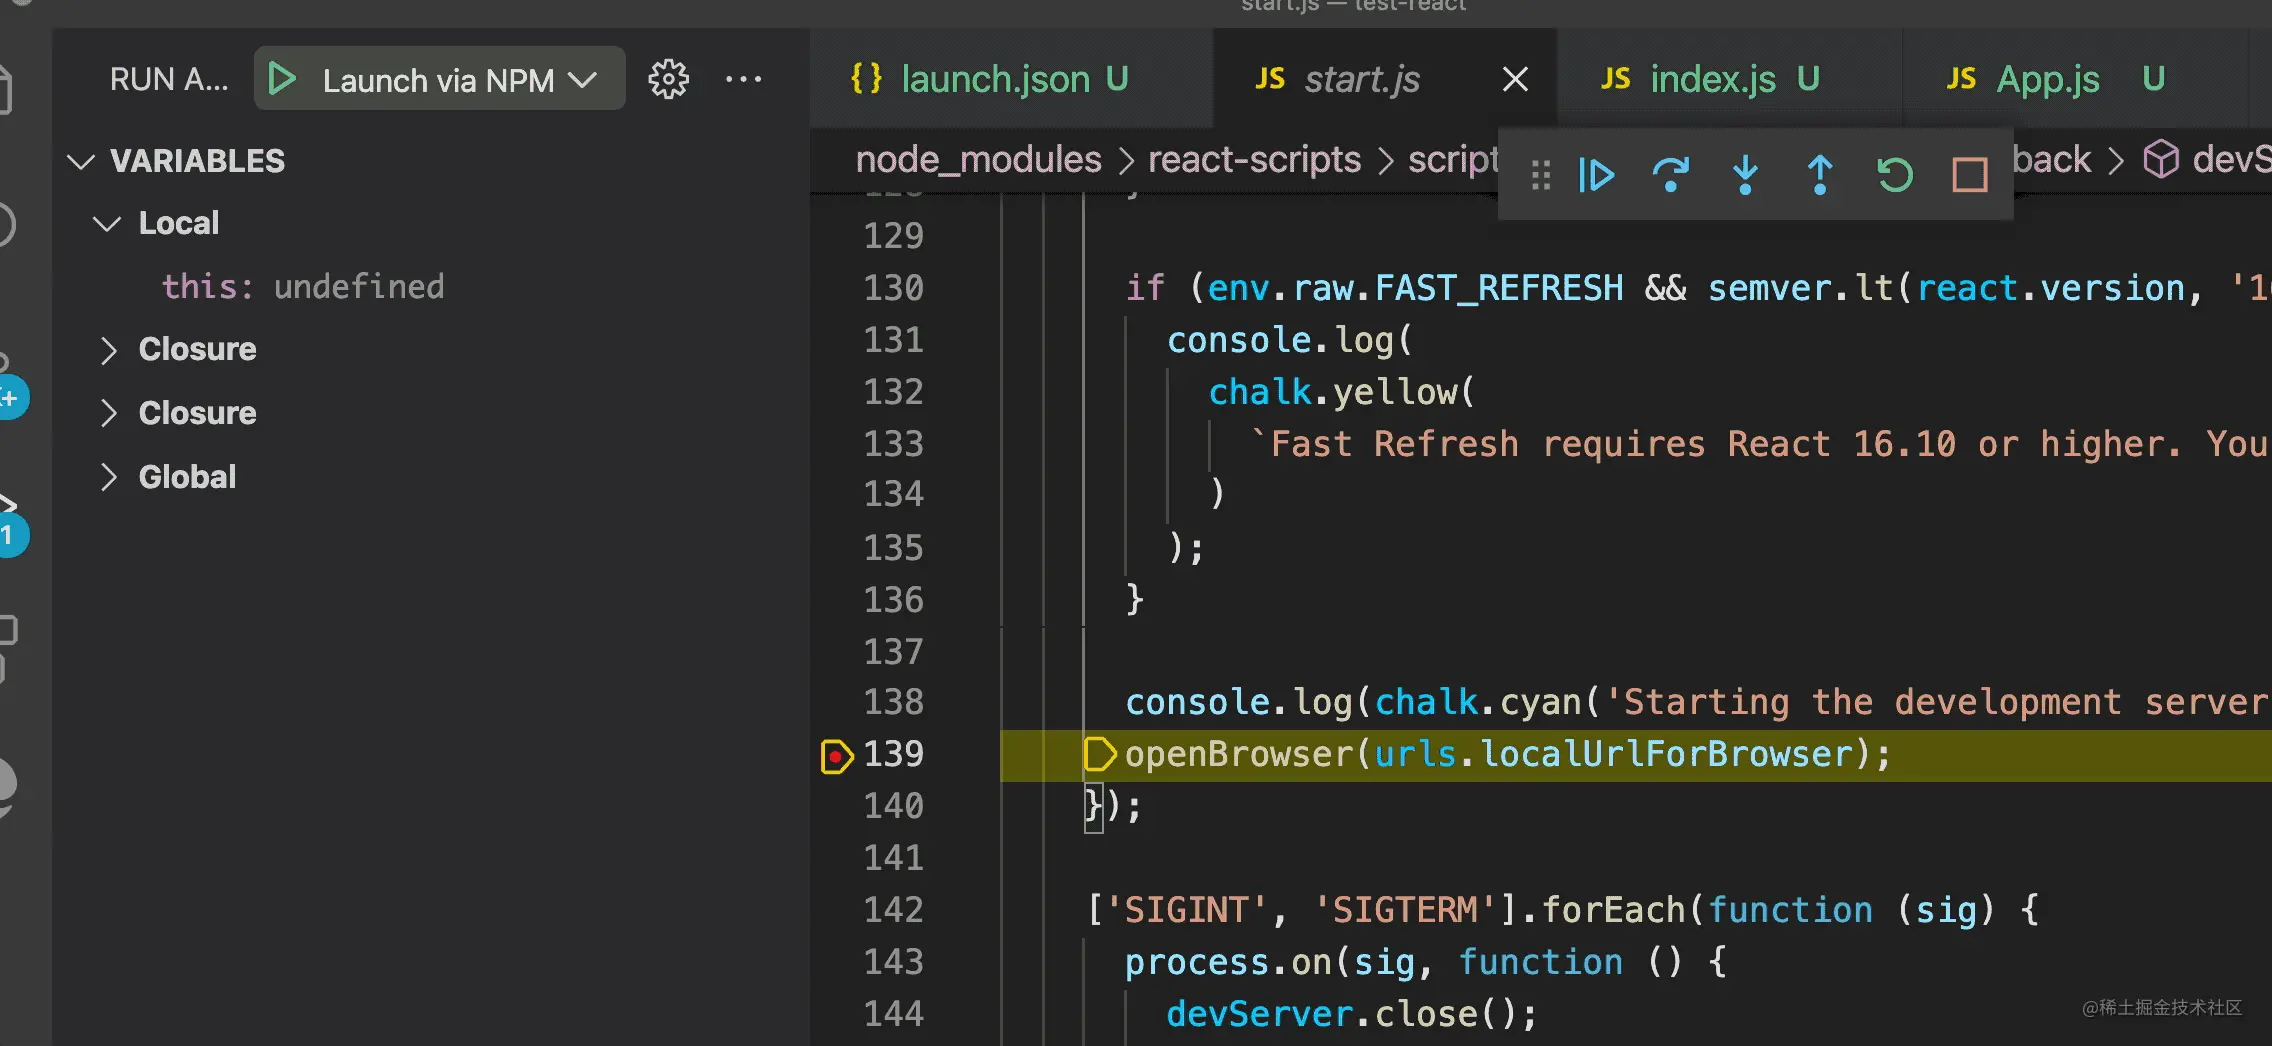
This config is the configuration of webpack:

Go further down and you will find that a server has been started:

We enter the callback function in the server startup callback function. A breakpoint to see how the browser opens:

Click step into to enter this breakpoint:

Then single-step execution will lead to code like this:
Start these browsers through osascript in turn. If the startup fails, it will be ignored directly in the try catch:
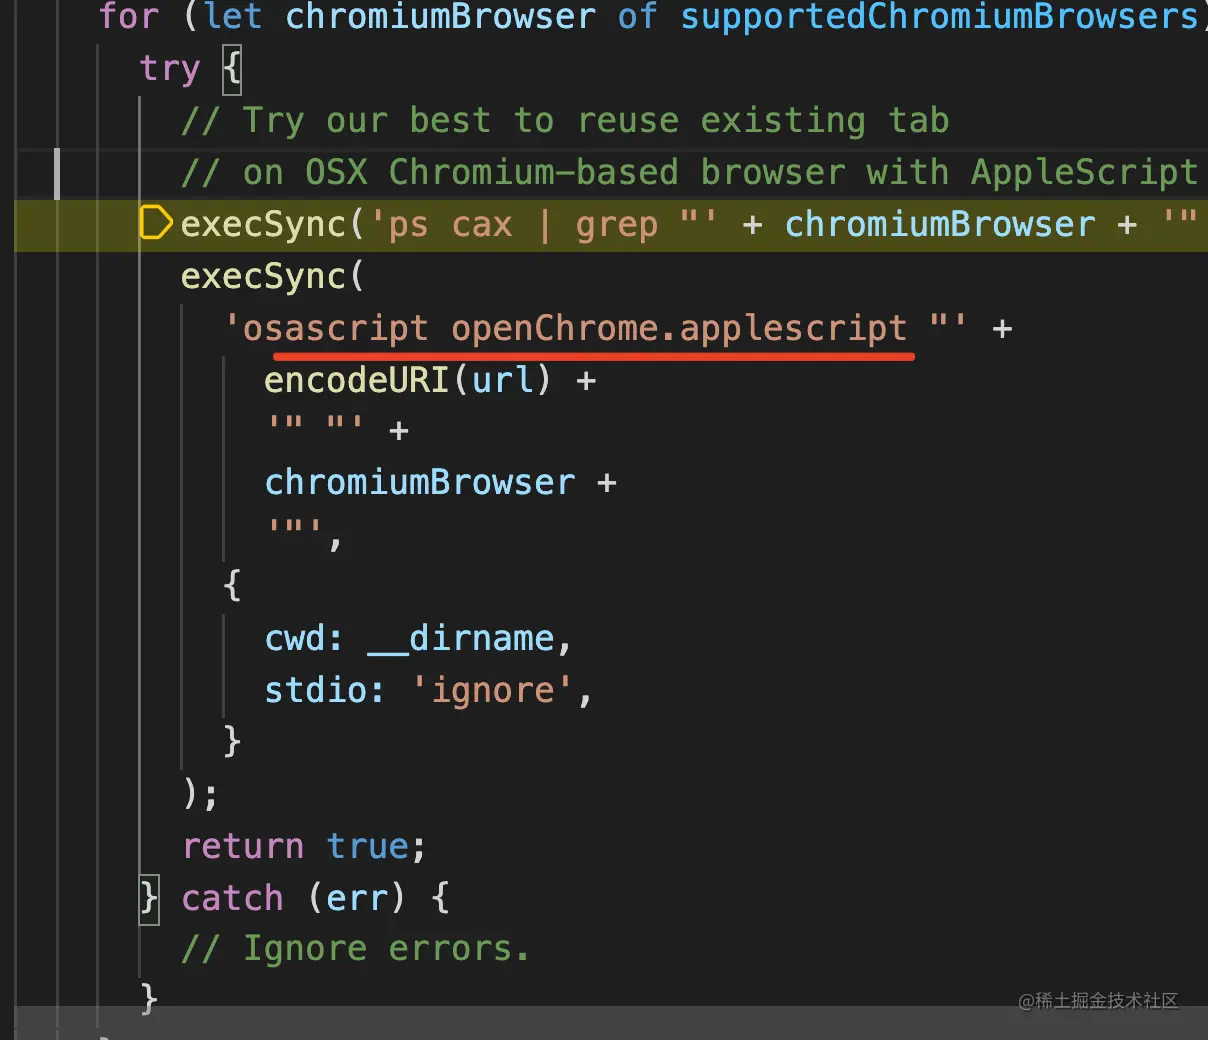
You can see these by hovering the browser:
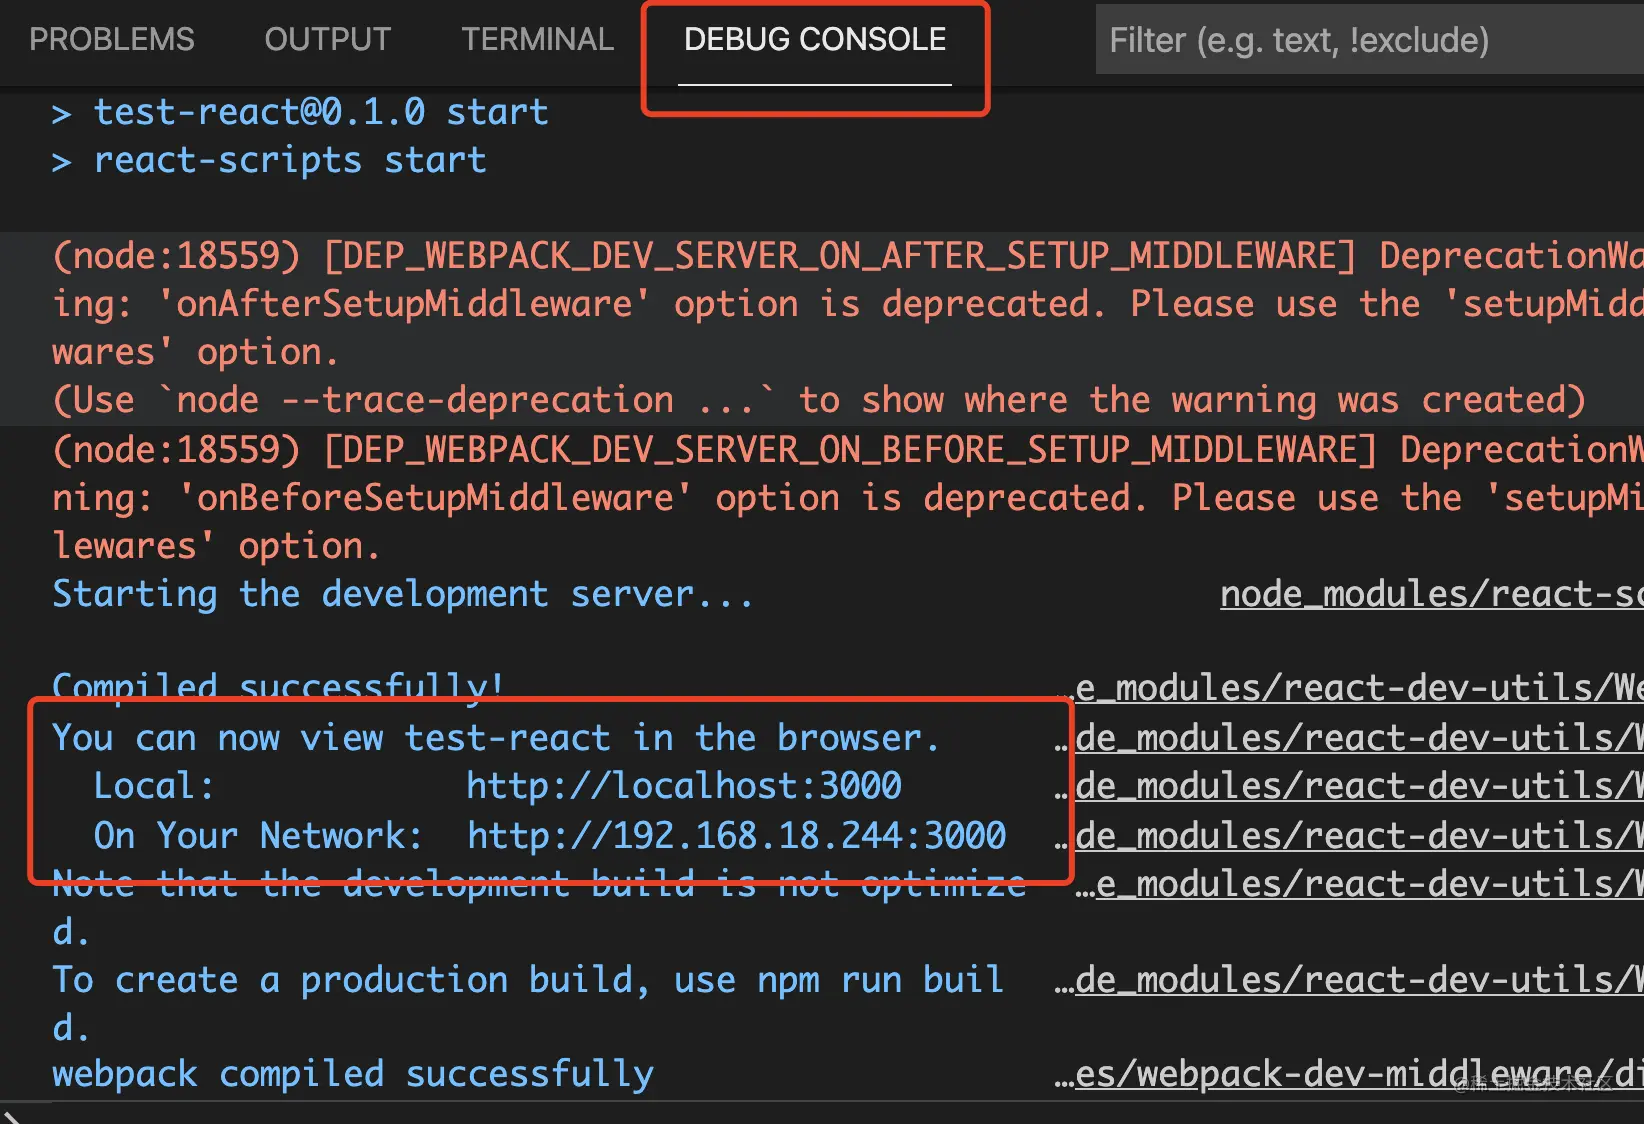
Release the breakpoint, and you will find that the browser is open:

In this way, haven’t we sorted out the process of react-scripts start?
The summary is this:
After debugging it once, we will have a deeper understanding of npm run start.
Moreover, there is no difference between running script in debugging mode and npm run start directly from the command line.
To talk about the difference, the only difference may be this:
In the default debugging mode, the output content will be displayed in the Debug Console panel:

But this can also be changed:
You can switch to integratedTerminal, then it will be output in the terminal:
In this way, there is no difference from the usual npm run start execution, and you can also breakpoint for debugging. Isn't it great?
Let’s look at an example again, such as the vue project created by vue cli. You can change the webpack configuration in vue.config.js:
But if you Want to know what the default configuration is? console.log?
console.log It is not a good idea to print large objects. It looks like this:
Some students said to use JSON.stringify, which is more ugly. A very long string.
What if you know how to debug npm scripts?
You can add an npm type debugging configuration:
Then set a breakpoint and run debug:
You can see all configurations, isn’t that great?
The example I gave is only for webpack, but other npm scripts, such as babel, tsc, eslint, vite, etc., all use the same debugging method.
Every project has npm scripts. Most people just use them without debugging them, so they don’t know the principles of these tools even if they are used every day. .
These command line tools declare a bin field in package.json, and then put it under node_modules/.bin after installation.
You can run it with node node_modules/.bin/xx, or you can run it with npx xx. The most commonly used one is npm scripts, which is run by npm run xx.
The debugging of npm scripts is the debugging of node, but VSCode Debugger has simplified it and can directly create npm type debugging configuration.
After configuring the console as integratedTerminal, the log will be output to the terminal, which is no different from running npm run xx directly. You can also breakpoint to see the execution logic.
In addition to running npm scripts, you can also sort out its implementation logic and stop where you are interested. Isn't this better than running it directly?
For more node-related knowledge, please visit: nodejs tutorial!
The above is the detailed content of There is actually a better way to run npm scripts. For more information, please follow other related articles on the PHP Chinese website!
 node.js debugging
 What is the difference between guid and mbr formats
 How to open apk file
 Commonly used database software
 How to use the article tag
 What to do if there is no sound from the computer microphone
 What skills are needed to work in the PHP industry?
 How to run code html in vscode
 The main function of the arithmetic unit in a microcomputer is to perform