
 Backend Development
Python Tutorial
Summary of usage of python debugging tool pdb (Python Debugger)
Backend Development
Python Tutorial
Summary of usage of python debugging tool pdb (Python Debugger)
Summary of usage of python debugging tool pdb (Python Debugger)

This article brings you relevant knowledge about Python, which mainly introduces the relevant content about the pdb debugging tool, including basic pdb commands, setting breakpoints with break, etc., Let’s take a look at it together, I hope it will be helpful to everyone.

[Related recommendations: Python3 video tutorial ]
1. There are two ways to use pdb
pdb: python debugger
1. Non-intrusive method (No need to modify the source code, you can debug it by running it directly from the command line)
python3 -m pdb filename.py
2. Intrusive method (You need to add the following code to the code being debugged and then run the code normally)
import pdb pdb.set_trace()
When you see the following prompt on the command line, it means that pdb has been opened correctly
(Pdb)
2. pdb basic commands
##In actual use, we found that when running a python file with a shell script, it may not be possible to debug using pdb and will exit. At this time, you can only run the py file directly for debugging.
3. Use the break command to set a breakpoint at the specified location in the specified file
3.1 Set a breakpoint at the specified location in this file
For example, in the following example, if you want to enter the forward() method of the model to view the data processing process during forward propagation, you can only set a break in the first line of forward() (line 26). Point, pdb.set_trace()
But sometimes the model is very complex, and using this method will cause the program to report an error and exit directly (I don’t know the reason), then we can consider using the break command here Insert a breakpoint in one line so that the program will stop when it reaches forward().
1 2 3 4 5 6 7 8 9 10 11 12 |
|
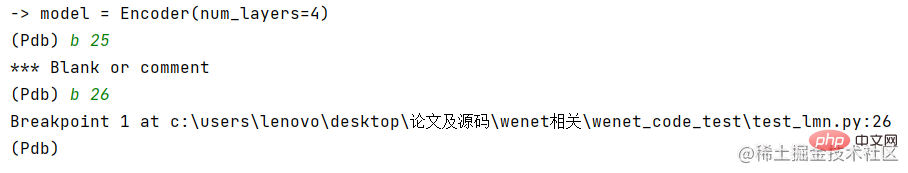
Specific method: (1) First set pdb.set_trace() on any previous line to stop the program. (2) Just enter break 26. As shown in the picture:
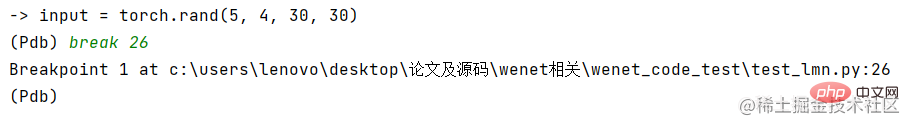 In this way, the breakpoint is set successfully, and the program will stop when it reaches forward().
The 26 here is the number of lines. It should be noted that the breakpoint position cannot be a comment . For example, if we set a breakpoint on line 25 (comment line), it will fail:
 To summarize, the command to set a breakpoint in the same file is:
break line
3.2 In others Set a breakpoint at a specified location in the file
If the breakpoint you want to set is not in the initial run file, how can you use the break command to set a breakpoint in other files? Let’s look at this example:
Divide the 3.1 code into three py files and put them under the same path:
1 |
|
Take a look at the contents of each file:
run.py:
The initial pdb.set_trace() setting is in run.py.
1 2 3 4 |
|
encoder.py:
1 2 3 4 |
|
encoder_layer.py:
1 2 3 4 5 |
|
Now we run run.py and then Set a breakpoint on line 12 of encoder.py, that is,
for layer in self.ModelList:
The command is:
break encoder.py:12
That is, break filename: line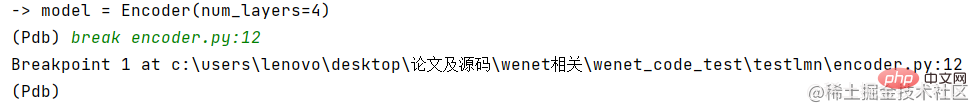 We can see that the program can enter forward() from output = model(input):
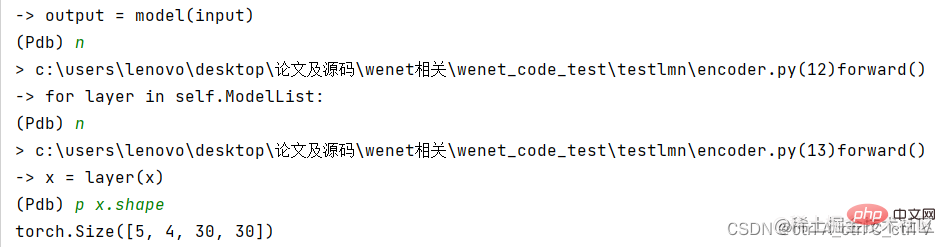 This is very convenient to debug.
If the initial breakpoint and the target breakpoint are not in the file in the same directory, you can also set the breakpoint through the file name under the relative path, such as:
1 |
|
4. When using pdb Problems discovered
4.1 When using soft links, the file path displayed by pdb is inconsistent with the actual path
As shown in the figure, pdb It consists of three lines. The first line is the file path, the second line is the currently executed code line, and the third line is the input command line.
When there is a soft link, the path displayed by pdb is the path pointed by the soft link, but the actual code path is the path that copies the content of the soft link. These two paths are different, so you must pay attention. 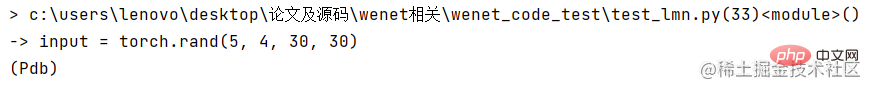
4.2 pdb sometimes cannot add breakpoints in the forward() method of the model
pdbSometimes pdb cannot be used. set_trace() adds a breakpoint to the forward() method of the model. The error message is:
Compiled functions can't take variable number of arguments or use keyword-only arguments with defaul
Probably means "The compiled function cannot accept a variable number of parameters, nor can it use keyword-only parameters in default."
I don't understand what it means, and this problem has not been solved.
5. Post-debugging after the program crashes: pdb.pm()
As mentioned above, breakpoints are inserted when the program starts running, and pdb is used for debugging, that is, Predebug. In fact, pdb can also be used for post-mortem debugging, that is, after the program has a bug and crashes, use the python debugger to view it.
For example, test.py is obviously buggy:
1 |
|
Run directly:
python test.py
The program runs Collapse:
1 2 3 4 5 6 7 |
|
In this way we cannot use pdb for debugging. So when the program crashes, how should we debug it?
We can use the following command for simple debugging:
python -i test.py
-i option allows you to open a Interactive shell, as follows:
1 2 3 4 5 6 7 8 |
|
现在我们发现程序结束后出现了 >>> 符号,这就是python调试器。
输入命令:
import pdb pdb.pm()
其中 pdb.pm() 用于程序发生异常导致奔溃后的事后调试,可以跟踪异常程序最后的堆在信息。
执行命令后得到:
1 2 3 4 5 6 |
|
可以发现,pdb.pm() 已经追踪到了导致程序奔溃的语句:return n+1
此时可以打印 n 的值进行检查:
1 2 3 |
|
q 表示退出pdb调试,quit() 表示退出 python 调试器。
【相关推荐:Python3视频教程 】
| Command | Explanation |
|---|---|
| break or b | Set breakpoint |
| continue or c | Continue executing the program |
| list or l | View the code segment of the current line |
| step or s | Enter the function (use next instead of step to enter the for loop) |
| return or r | Execute code until returning from the current function |
| next or n | Execute the next line |
| up or u | Return to the previous call point (not the previous line) |
| p x | Print variables The value of |
The above is the detailed content of Summary of usage of python debugging tool pdb (Python Debugger). For more information, please follow other related articles on the PHP Chinese website!

Hot AI Tools

Undresser.AI Undress
AI-powered app for creating realistic nude photos

AI Clothes Remover
Online AI tool for removing clothes from photos.

Undress AI Tool
Undress images for free

Clothoff.io
AI clothes remover

Video Face Swap
Swap faces in any video effortlessly with our completely free AI face swap tool!
Hot Article
Hot Tools

Notepad++7.3.1
Easy-to-use and free code editor

SublimeText3 Chinese version
Chinese version, very easy to use

Zend Studio 13.0.1
Powerful PHP integrated development environment

Dreamweaver CS6
Visual web development tools

SublimeText3 Mac version
God-level code editing software (SublimeText3)
Hot Topics
 1389
1389
 52
52

 Can vs code run in Windows 8
Apr 15, 2025 pm 07:24 PM
Can vs code run in Windows 8
Apr 15, 2025 pm 07:24 PM
VS Code can run on Windows 8, but the experience may not be great. First make sure the system has been updated to the latest patch, then download the VS Code installation package that matches the system architecture and install it as prompted. After installation, be aware that some extensions may be incompatible with Windows 8 and need to look for alternative extensions or use newer Windows systems in a virtual machine. Install the necessary extensions to check whether they work properly. Although VS Code is feasible on Windows 8, it is recommended to upgrade to a newer Windows system for a better development experience and security.
 Is the vscode extension malicious?
Apr 15, 2025 pm 07:57 PM
Is the vscode extension malicious?
Apr 15, 2025 pm 07:57 PM
VS Code extensions pose malicious risks, such as hiding malicious code, exploiting vulnerabilities, and masturbating as legitimate extensions. Methods to identify malicious extensions include: checking publishers, reading comments, checking code, and installing with caution. Security measures also include: security awareness, good habits, regular updates and antivirus software.
 How to run programs in terminal vscode
Apr 15, 2025 pm 06:42 PM
How to run programs in terminal vscode
Apr 15, 2025 pm 06:42 PM
In VS Code, you can run the program in the terminal through the following steps: Prepare the code and open the integrated terminal to ensure that the code directory is consistent with the terminal working directory. Select the run command according to the programming language (such as Python's python your_file_name.py) to check whether it runs successfully and resolve errors. Use the debugger to improve debugging efficiency.
 Choosing Between PHP and Python: A Guide
Apr 18, 2025 am 12:24 AM
Choosing Between PHP and Python: A Guide
Apr 18, 2025 am 12:24 AM
PHP is suitable for web development and rapid prototyping, and Python is suitable for data science and machine learning. 1.PHP is used for dynamic web development, with simple syntax and suitable for rapid development. 2. Python has concise syntax, is suitable for multiple fields, and has a strong library ecosystem.
 Can visual studio code be used in python
Apr 15, 2025 pm 08:18 PM
Can visual studio code be used in python
Apr 15, 2025 pm 08:18 PM
VS Code can be used to write Python and provides many features that make it an ideal tool for developing Python applications. It allows users to: install Python extensions to get functions such as code completion, syntax highlighting, and debugging. Use the debugger to track code step by step, find and fix errors. Integrate Git for version control. Use code formatting tools to maintain code consistency. Use the Linting tool to spot potential problems ahead of time.
 PHP and Python: Different Paradigms Explained
Apr 18, 2025 am 12:26 AM
PHP and Python: Different Paradigms Explained
Apr 18, 2025 am 12:26 AM
PHP is mainly procedural programming, but also supports object-oriented programming (OOP); Python supports a variety of paradigms, including OOP, functional and procedural programming. PHP is suitable for web development, and Python is suitable for a variety of applications such as data analysis and machine learning.
 Can vscode be used for mac
Apr 15, 2025 pm 07:36 PM
Can vscode be used for mac
Apr 15, 2025 pm 07:36 PM
VS Code is available on Mac. It has powerful extensions, Git integration, terminal and debugger, and also offers a wealth of setup options. However, for particularly large projects or highly professional development, VS Code may have performance or functional limitations.
 Can vscode run ipynb
Apr 15, 2025 pm 07:30 PM
Can vscode run ipynb
Apr 15, 2025 pm 07:30 PM
The key to running Jupyter Notebook in VS Code is to ensure that the Python environment is properly configured, understand that the code execution order is consistent with the cell order, and be aware of large files or external libraries that may affect performance. The code completion and debugging functions provided by VS Code can greatly improve coding efficiency and reduce errors.
