 Operation and Maintenance
 Linux Operation and Maintenance
 What are the commands to check memory usage in Linux?
What are the commands to check memory usage in Linux?
The commands are: 1. The free command can display the system memory status, including the usage of physical, memory, shared memory and system cache; 2. The "cat /proc/meminfo" command can read "/ proc/meminfo" file to display memory usage; 3. vmstat command, which can be used to monitor CPU usage, process status and other information; 4. top command; 5. htop command; 6. sar command; 7. smem command; 8 , glances command; 9. ps_mem command.

#The operating environment of this tutorial: linux7.3 system, Dell G3 computer.
We often need to check the memory usage of the server and the memory occupied by each process to avoid resource shortages and affect the user experience.
For websites and web services, sufficient memory must be available to handle client requests. If there is insufficient memory, it will become slow, congested, and even the service will crash during peak requests. Of course, the same is true for desktop systems.
Memory management and optimization is an important part of Linux system performance optimization. In other words, whether memory resources are sufficient will directly affect the performance of the application system (including the operating system and applications).
The following introduces several system commands through which you can quickly check the memory usage in the Linux system.
The free command is the simplest and most commonly used memory viewing command in Linux systems.
The free command is used to display the system memory status, including the usage of system physical memory, virtual memory (swap swap partition), shared memory and system cache
Examples are as follows:
free -m

free -h
Among them, the -m option displays memory usage information in MB; -h Options are displayed in human-readable units.
In the above example, the line Mem::
totalrepresents a total of7822MBMemory (RAM), that is7.6G.usedindicates the usage of physical memory, which is approximately322M.freerepresents free memory;sharedrepresents shared memory?;buff/cacheIndicates the amount of cache and buffer memory; the Linux system will cache many things to improve performance, and this memory can be released when necessary for use by other programs.availableindicates available memory;
The output result is easy to understand. Swap This line represents swap memory. As you can see from the numbers in the example, swap memory is basically not used.
2. View<span style="font-size: 18px;">/proc/meminfo</span>
other One way is to read the /proc/meminfo file. We know that the /proc directory is full of virtual files, containing dynamic information related to the kernel and operating system.
$ cat /proc/meminfo

MemTotal:        8010408 kB
MemFree:          323424 kB
MemAvailable:    6956280 kB
Buffers:          719620 kB
Cached:          5817644 kB
SwapCached:          132 kB
Active:          5415824 kB
Inactive:        1369528 kB
Active(anon):     385660 kB
Inactive(anon):   249292 kB
Active(file):    5030164 kB
Inactive(file):  1120236 kB
Unevictable:           0 kB
Mlocked:               0 kB
SwapTotal:       4194304 kB
SwapFree:        4193580 kB
Dirty:                60 kB
Writeback:             0 kB
AnonPages:        247888 kB
Mapped:            61728 kB
Shmem:            386864 kB
Slab:             818320 kB
SReclaimable:     788436 kB
SUnreclaim:        29884 kB
KernelStack:        2848 kB
PageTables:         5780 kB
NFS_Unstable:          0 kB
Bounce:                0 kB
WritebackTmp:          0 kB
CommitLimit:     8199508 kB
Committed_AS:     942596 kB
VmallocTotal:   34359738367 kB
VmallocUsed:       22528 kB
VmallocChunk:   34359707388 kB
HardwareCorrupted:     0 kB
AnonHugePages:     88064 kB
HugePages_Total:       0
HugePages_Free:        0
HugePages_Rsvd:        0
HugePages_Surp:        0
Hugepagesize:       2048 kB
DirectMap4k:      176000 kB
DirectMap2M:     6115328 kB
DirectMap1G:     4194304 kB
Focus on these data:
MemTotal, Total MemoryMemFree, Free MemoryMemAvailable, Available MemoryBuffers, BufferCached, CacheSwapTotal, swap memorySwapFree, free swap memory
The information provided and the free command saw almost.
3. Use the <span style="font-size: 18px;">vmstat</span> command
The vmstat command is the abbreviation of Virtual Meomory Statistics (virtual memory statistics), which can be used to monitor CPU usage, process status, memory usage, virtual memory usage, hard disk input/output status and other information.
Use the vmstat -s command and options to collect statistics on memory usage, similar to /proc/meminfo.
The example is as follows:
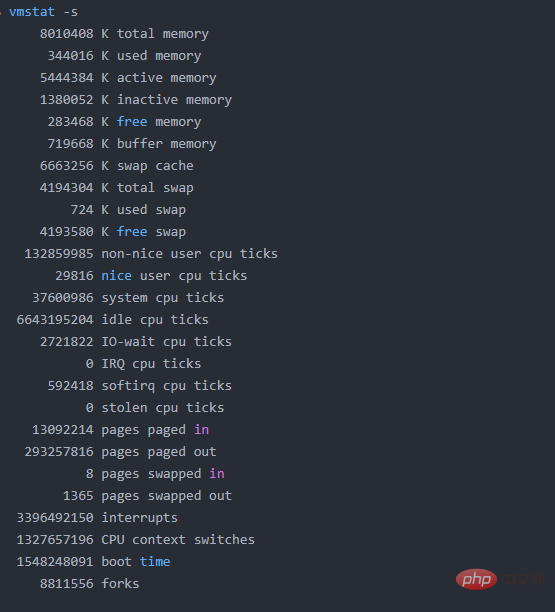
vmstat -s

The first few lines show the total amount of memory, usage, and free memory and other information.
4. Use the <span style="font-size: 18px;">top</span> command
top The command is generally used to check the CPU and memory usage of the process; of course, it also reports the total memory and memory usage, so it can be used to monitor the usage of physical memory.
Summary information is displayed at the top of the output information.
Example output:
top - 15:20:30 up  6:57,  5 users,  load average: 0.64, 0.44, 0.33
Tasks: 265 total,   1 running, 263 sleeping,   0 stopped,   1 zombie
%Cpu(s):  7.8 us,  2.4 sy,  0.0 ni, 88.9 id,  0.9 wa,  0.0 hi,  0.0 si,  0.0 st
KiB Mem:   8167848 total,  6642360 used,  1525488 free,  1026876 buffers
KiB Swap:  1998844 total,        0 used,  1998844 free,  2138148 cached

  PID USER      PR  NI  VIRT  RES  SHR S  %CPU %MEM    TIME+  COMMAND
 2986 enlighte  20   0  584m  42m  26m S  14.3  0.5   0:44.27 yakuake
 1305 root      20   0  448m  68m  39m S   5.0  0.9   3:33.98 Xorg
 7701 enlighte  20   0  424m  17m  10m S   4.0  0.2   0:00.12 kio_thumbnail
各种操作系统提供的参数略有不同,一般来说都可以根据CPU和内存来排序。
例如:
# CentOS
top -o %MEM
top -o %CPU

# mac
top -o mem
top -o cpu
碰到不清楚的,请使用 top -h 查看帮助信息。
重点关注顶部的 KiB Mem 和 KiB Swap 这两行。 表示内存的总量、使用量,以及可用量。
buffer 和 cache 部分,和 free 命令展示的差不多。
5. 使用 <span style="font-size: 18px;">htop</span> 命令
htop 命令是 Linux/Unix 系统的交互式进程查看器。它是一个文本模式应用程序,需要ncurses库,它是由Hisham开发的。它被设计为顶级命令的替代方法。这类似于 top 命令,但允许您垂直和水平滚动以查看运行系统的所有进程。htop带有Visual Colors,它具有额外的好处,并且在跟踪系统性能时非常明显。可以自由地执行与进程相关的任何任务,例如进程终止和重新设置,而无需输入其PID。
与 top 命令类似, 但 htop 还展示了其他的各种信息, 而且支持彩色显示。
htop
顶部的消息显示了CPU使用率, 以及RAM和交换内存的使用情况。
如果没安装,可以使用类似的命令:
yum install htop -y
6. 使用sar 命令
sar 命令也可以用来监控 Linux 的内存使用状况,通过“sar -r”组合可以查看系统内存和交换空间的使用率。
sar 命令很强大,是分析系统性能的重要工具之一,通过该命令可以全面地获取系统的 CPU、运行队列、磁盘读写(I/O)、分区(交换区)、内存、CPU 中断和网络等性能数据。
如下是执行“sar -r”命令的输出结果:
sar -r 2 3

此输出结果中,各个参数表示的含义如下:
kbmemfree:表示空闲的物理内存的大小;
kbmemeused:表示已使用的物理内存的大小;
%memused:表示已使用内存占总内存大小的百分比;
kbbuffers:表示缓冲区所使用的物理内存的大小;
kbcached:表示告诉缓存所使用的物理内存的大小;
kbcommit 和 %commit:分别表示当前系统中应用程序使用的内存大小和百分比;
相比 free 命令,sar 命令的输出信息更加人性化,不仅给出了内存使用量,还给出了内存使用的百分比以及统计的平均值。比如说,仅通过 %commit 一项就可以得知,当前系统中的内存资源充足。
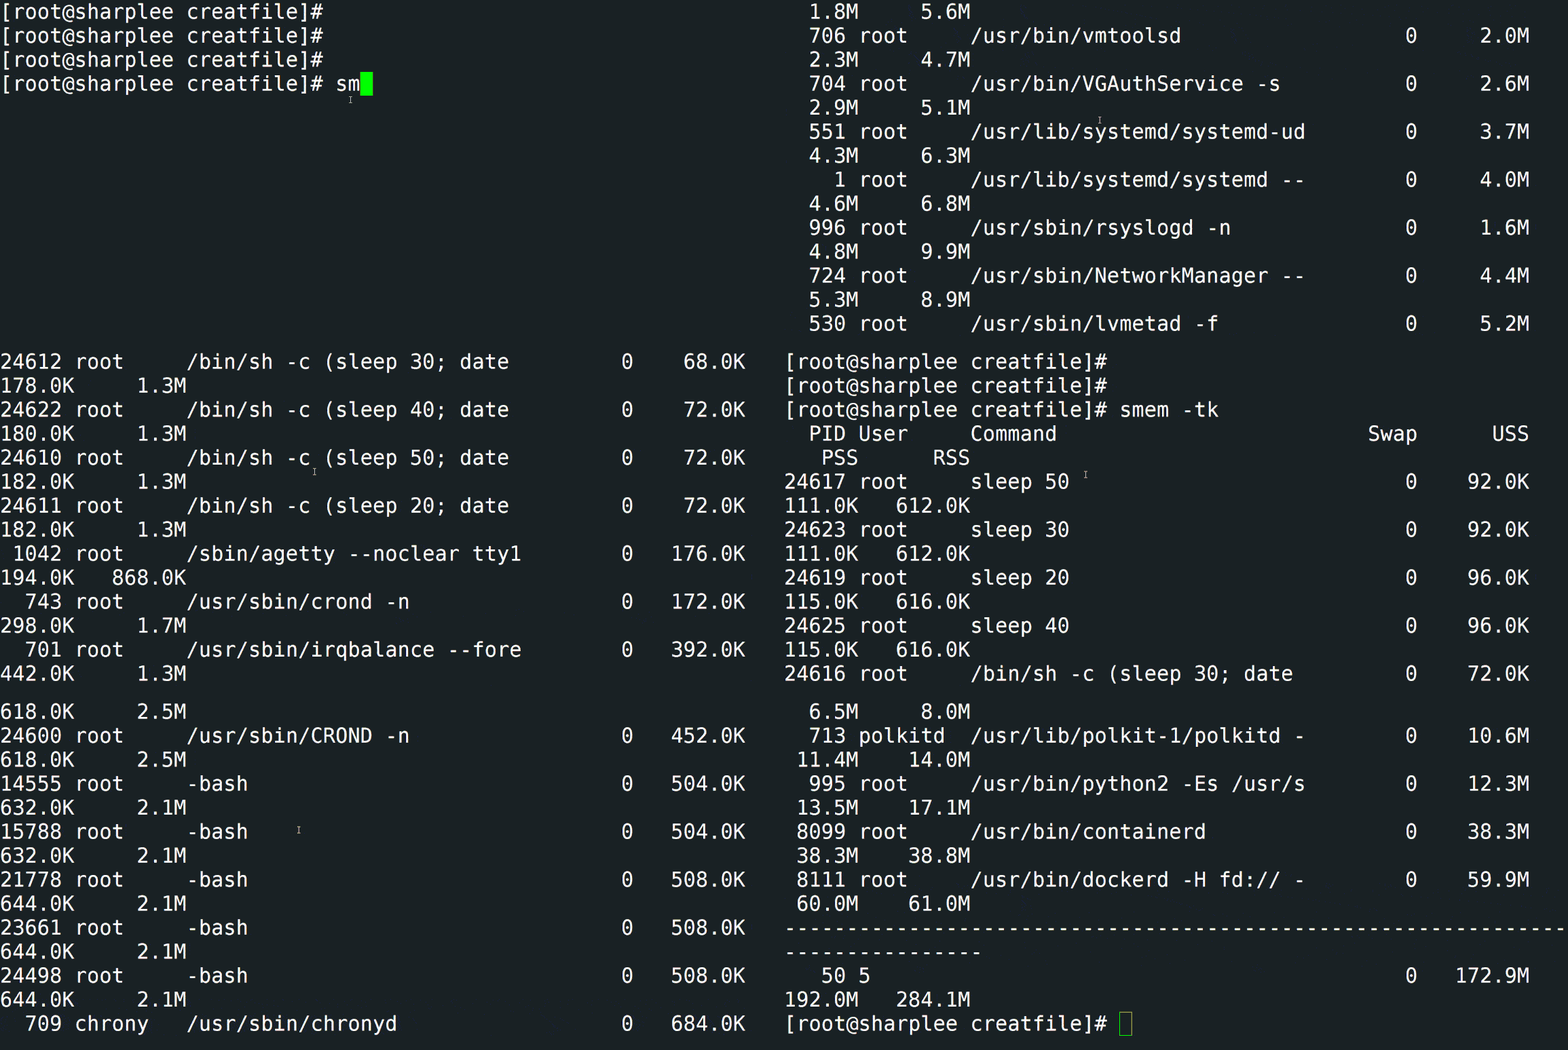
7.使用 smem 命令
smem是一个工具,可以提供大量Linux系统内存使用情况的报告。与现有工具不同,smem 可以报告比例集大小 (PSS)、唯一集大小 (USS) 和常驻集大小 (RSS)。成比例集大小 (PSS):指虚拟内存系统中库和应用程序使用的内存量。唯一集大小 (USS) :未共享的内存报告为 USS(唯一集大小)。驻留集大小 (RSS):物理内存(通常在多个应用程序之间共享)使用情况的标准度量(称为驻留集大小 (RSS))将大大高估内存使用量。注:如果执行以下命令提示未找到,请执行“yum install smem”安装
smem -tk

8.使用 glances 命令
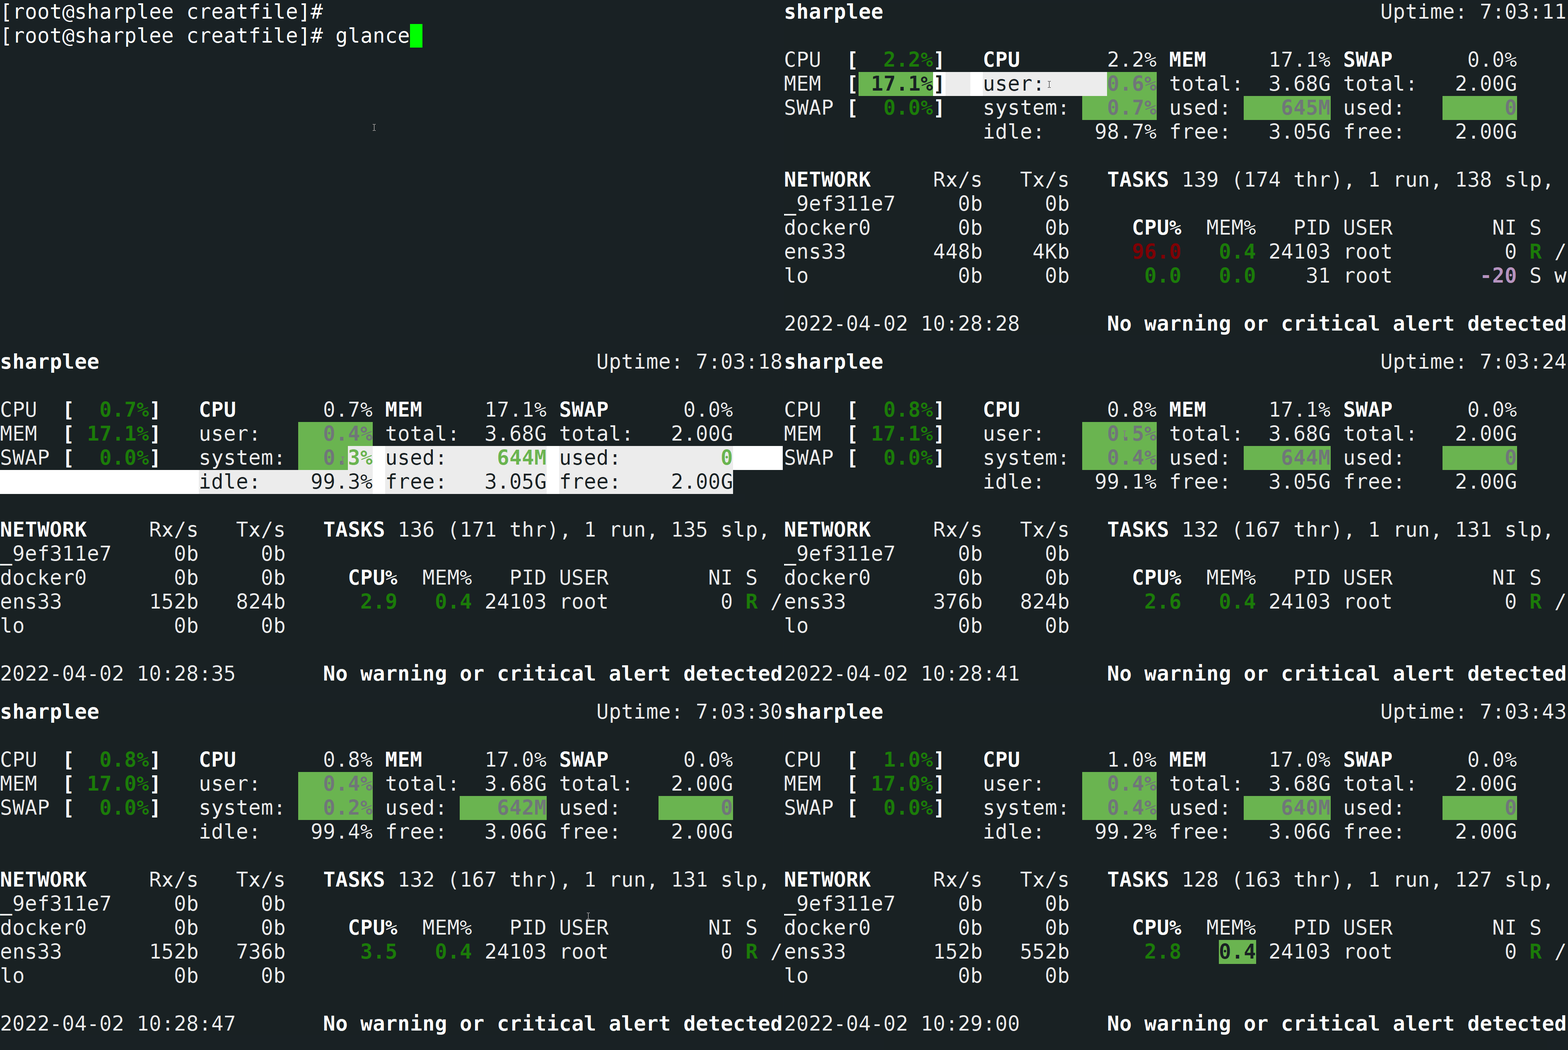
glances是用Python编写的跨平台系统监控工具。可以查看所有信息,例如CPU使用情况,内存使用情况,正在运行的进程,网络接口,磁盘I / O,Raid,传感器,文件系统信息,Docker,系统信息,正常运行时间等.
glances
9.使用 ps_mem 命令
ps_mem是一个简单的Python脚本,允许您准确地获取Linux中程序的核心内存使用情况。这可以确定每个程序(而不是每个进程)使用多少 RAM。它计算每个程序使用的内存总量,总计=总和(程序进程的专用RAM)+总和(程序进程的共享RAM)。计算共享 RAM 存在问题,并且该工具会自动为正在运行的内核选择最准确的方法。
ps_mem
注:如果执行以下命令提示未发现,请执行“yum install ps_mem”安装
相关推荐:《Linux视频教程》
The above is the detailed content of What are the commands to check memory usage in Linux?. For more information, please follow other related articles on the PHP Chinese website!

Hot AI Tools

Undresser.AI Undress
AI-powered app for creating realistic nude photos

AI Clothes Remover
Online AI tool for removing clothes from photos.

Undress AI Tool
Undress images for free

Clothoff.io
AI clothes remover

Video Face Swap
Swap faces in any video effortlessly with our completely free AI face swap tool!

Hot Article

Hot Tools

Notepad++7.3.1
Easy-to-use and free code editor

SublimeText3 Chinese version
Chinese version, very easy to use

Zend Studio 13.0.1
Powerful PHP integrated development environment

Dreamweaver CS6
Visual web development tools

SublimeText3 Mac version
God-level code editing software (SublimeText3)

Hot Topics
 1393
1393
 52
52
 37
37
 110
110
 What computer configuration is required for vscode
Apr 15, 2025 pm 09:48 PM
VS Code system requirements: Operating system: Windows 10 and above, macOS 10.12 and above, Linux distribution processor: minimum 1.6 GHz, recommended 2.0 GHz and above memory: minimum 512 MB, recommended 4 GB and above storage space: minimum 250 MB, recommended 1 GB and above other requirements: stable network connection, Xorg/Wayland (Linux)
 vscode cannot install extension
Apr 15, 2025 pm 07:18 PM
The reasons for the installation of VS Code extensions may be: network instability, insufficient permissions, system compatibility issues, VS Code version is too old, antivirus software or firewall interference. By checking network connections, permissions, log files, updating VS Code, disabling security software, and restarting VS Code or computers, you can gradually troubleshoot and resolve issues.
 Can vscode be used for mac
Apr 15, 2025 pm 07:36 PM
VS Code is available on Mac. It has powerful extensions, Git integration, terminal and debugger, and also offers a wealth of setup options. However, for particularly large projects or highly professional development, VS Code may have performance or functional limitations.
 What is vscode What is vscode for?
Apr 15, 2025 pm 06:45 PM
VS Code is the full name Visual Studio Code, which is a free and open source cross-platform code editor and development environment developed by Microsoft. It supports a wide range of programming languages and provides syntax highlighting, code automatic completion, code snippets and smart prompts to improve development efficiency. Through a rich extension ecosystem, users can add extensions to specific needs and languages, such as debuggers, code formatting tools, and Git integrations. VS Code also includes an intuitive debugger that helps quickly find and resolve bugs in your code.
 How to use VSCode
Apr 15, 2025 pm 11:21 PM
Visual Studio Code (VSCode) is a cross-platform, open source and free code editor developed by Microsoft. It is known for its lightweight, scalability and support for a wide range of programming languages. To install VSCode, please visit the official website to download and run the installer. When using VSCode, you can create new projects, edit code, debug code, navigate projects, expand VSCode, and manage settings. VSCode is available for Windows, macOS, and Linux, supports multiple programming languages and provides various extensions through Marketplace. Its advantages include lightweight, scalability, extensive language support, rich features and version
 How to run java code in notepad
Apr 16, 2025 pm 07:39 PM
Although Notepad cannot run Java code directly, it can be achieved by using other tools: using the command line compiler (javac) to generate a bytecode file (filename.class). Use the Java interpreter (java) to interpret bytecode, execute the code, and output the result.
 What is the main purpose of Linux?
Apr 16, 2025 am 12:19 AM
The main uses of Linux include: 1. Server operating system, 2. Embedded system, 3. Desktop operating system, 4. Development and testing environment. Linux excels in these areas, providing stability, security and efficient development tools.
 How to check the warehouse address of git
Apr 17, 2025 pm 01:54 PM
To view the Git repository address, perform the following steps: 1. Open the command line and navigate to the repository directory; 2. Run the "git remote -v" command; 3. View the repository name in the output and its corresponding address.


