How to run and debug code in VScode? Tutorial sharing
How to adjust VSCode in Linux environment? The following article will share with you the VScode debugging tutorial and introduce the setting methods of tasks.json and launch.json. I hope it will be helpful to everyone!
Running environment:
VSCode 1.68.1
wsl: ubuntu subsystem
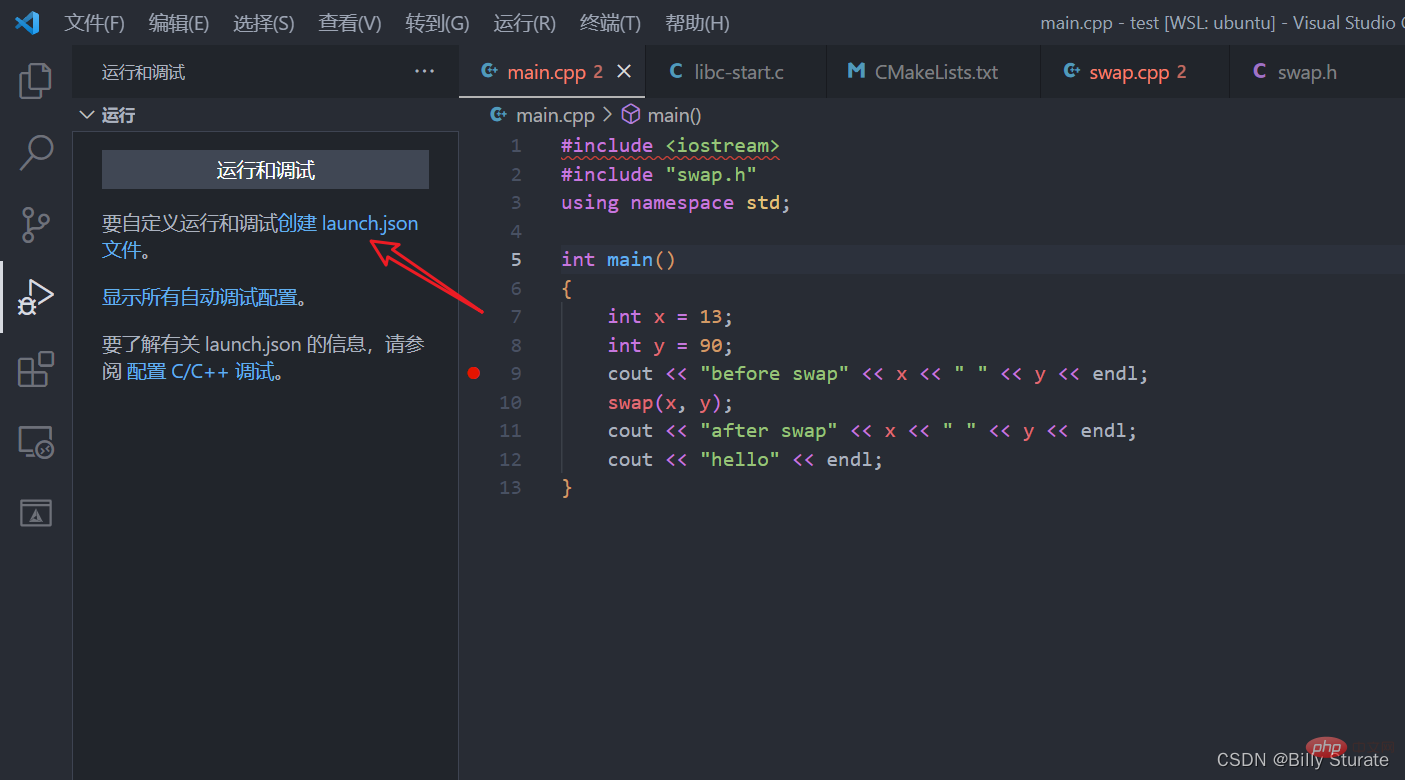
Without further ado, let’s start directly. First, select the fourth option on the left taskbar. [Recommended learning: vscode tutorial, Programming teaching]Running and debugging, click to create launch.json
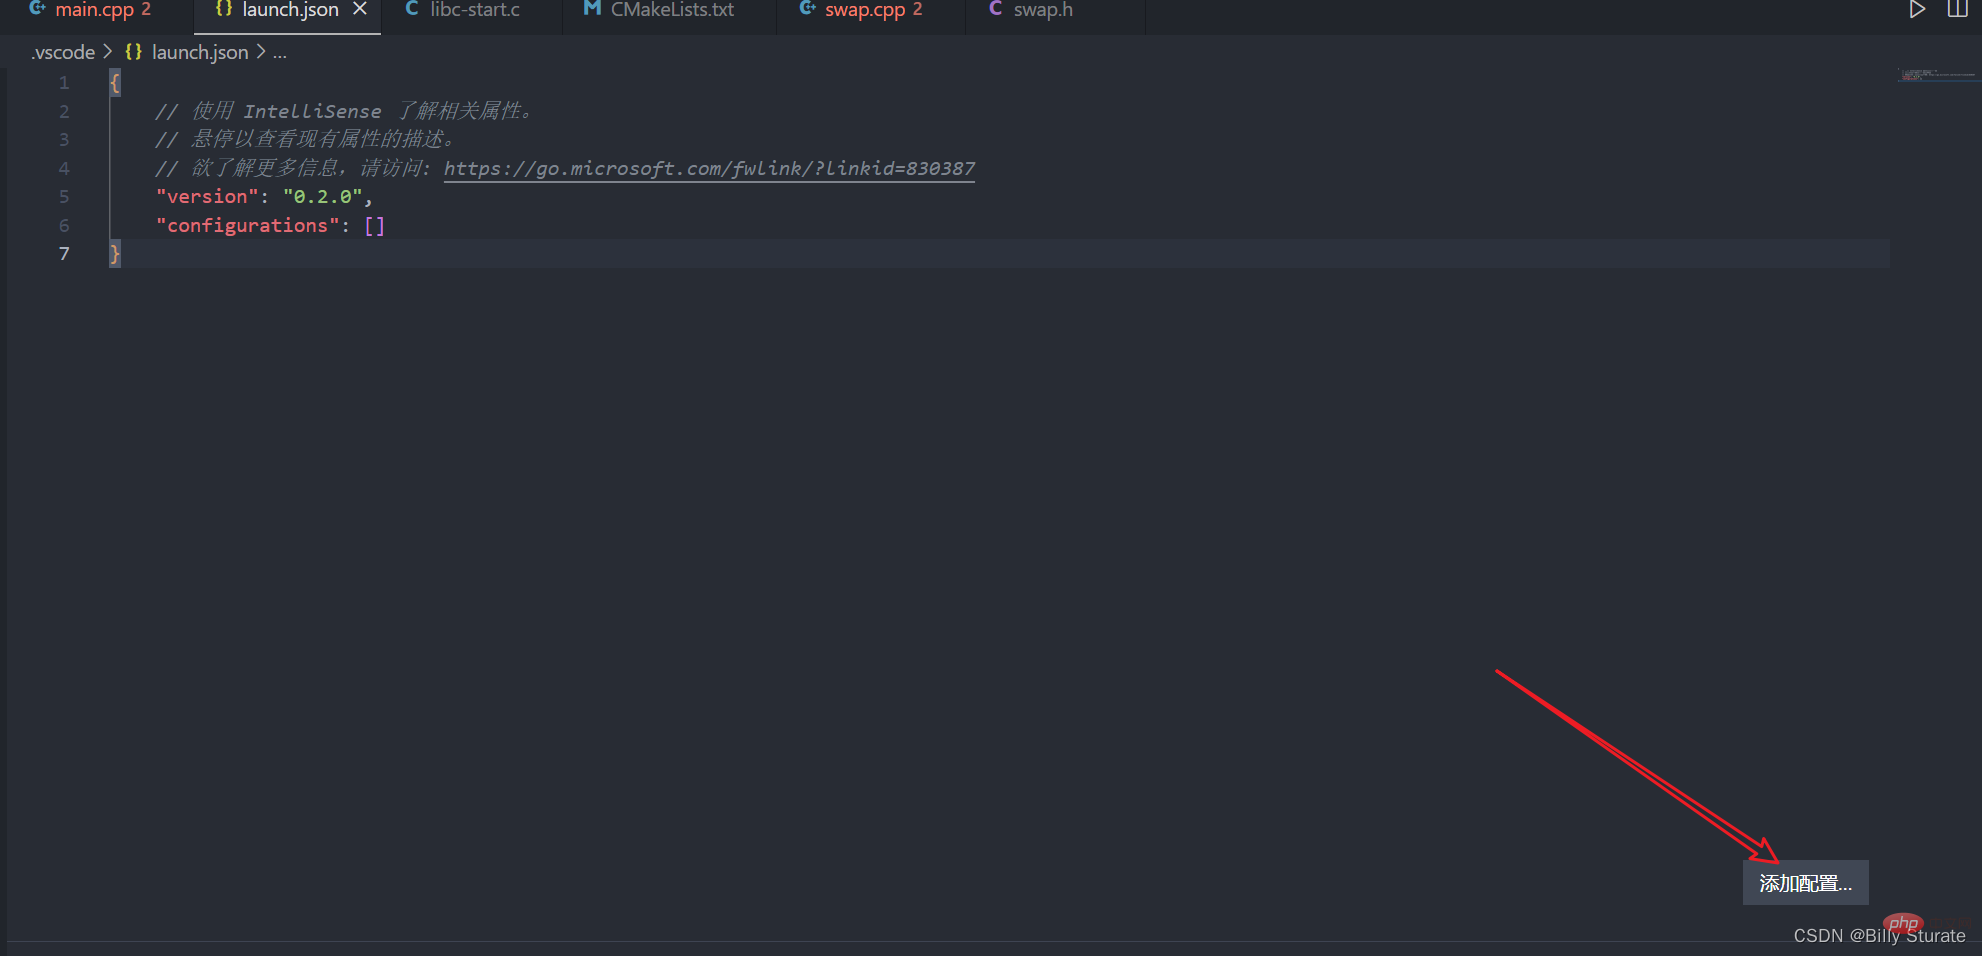
The created interface is as shown in the picture above. Click Add Configuration in the lower right corner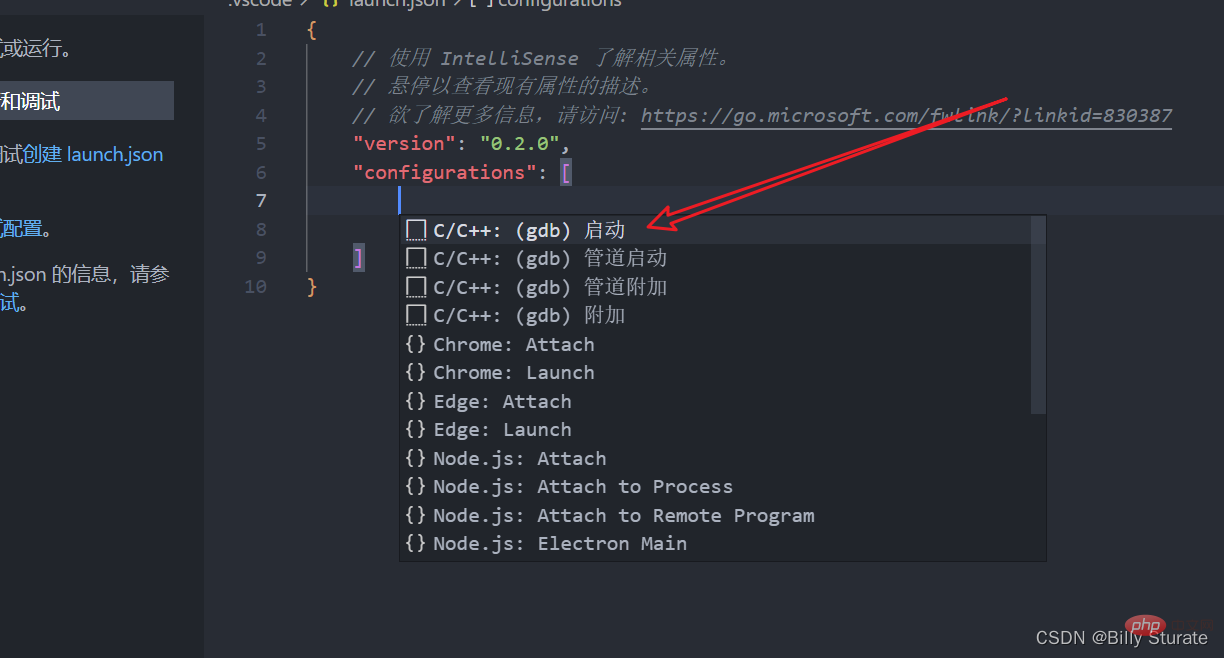
As shown in the picture above, select the firstc/c (gdb) to start
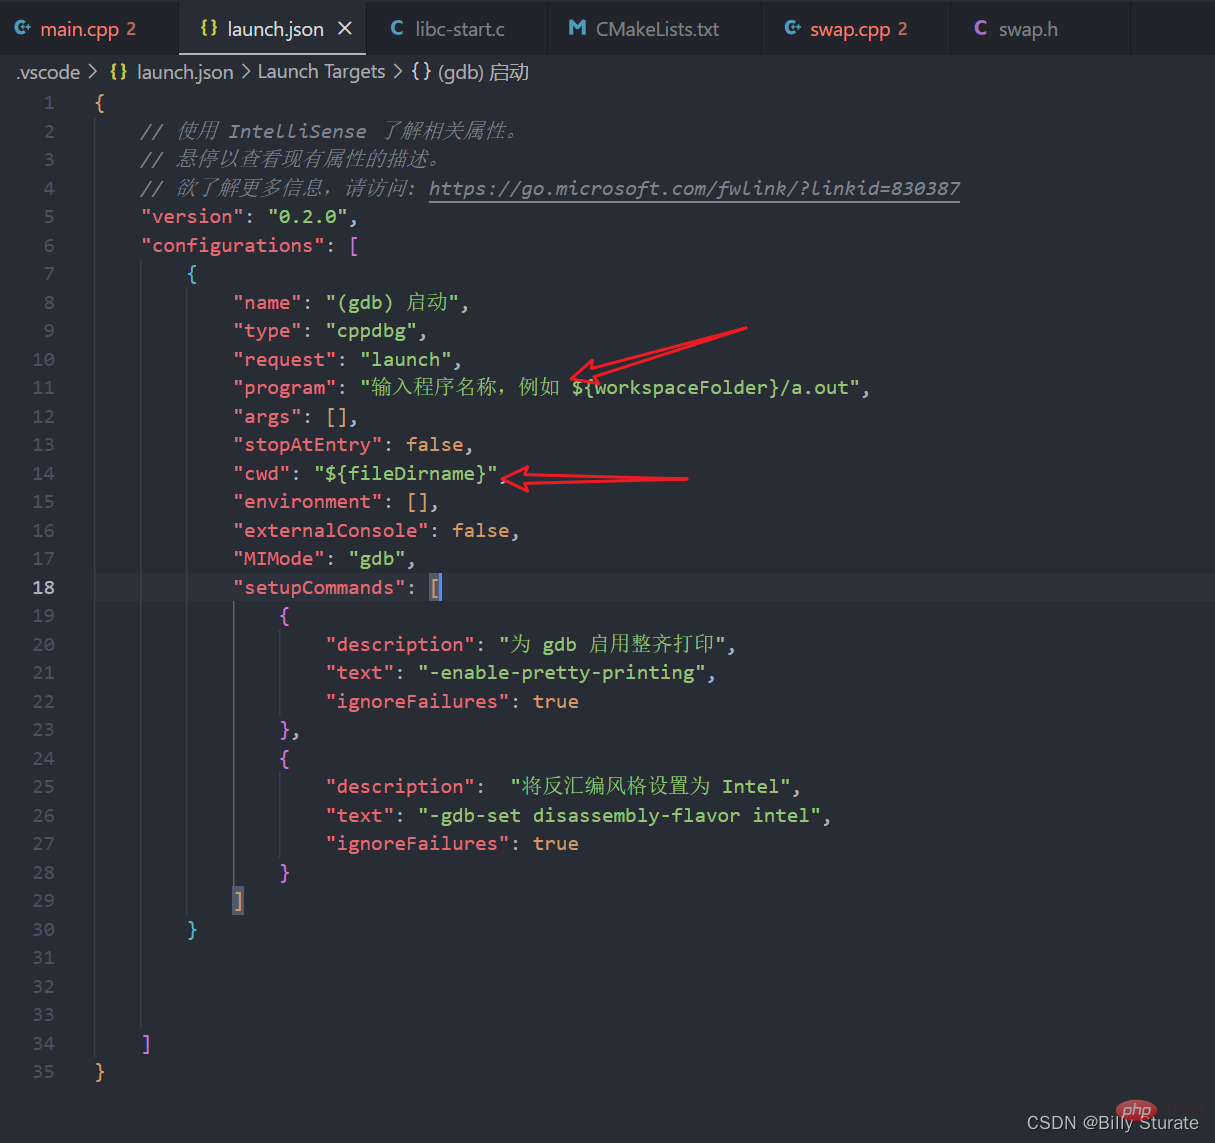
At this time, the code shown in the picture above will be generated. Pay attention to the two places where I drew the arrows. The cwd is the working directory where our current file is located. Change the two places where I drew the arrows to be the same.
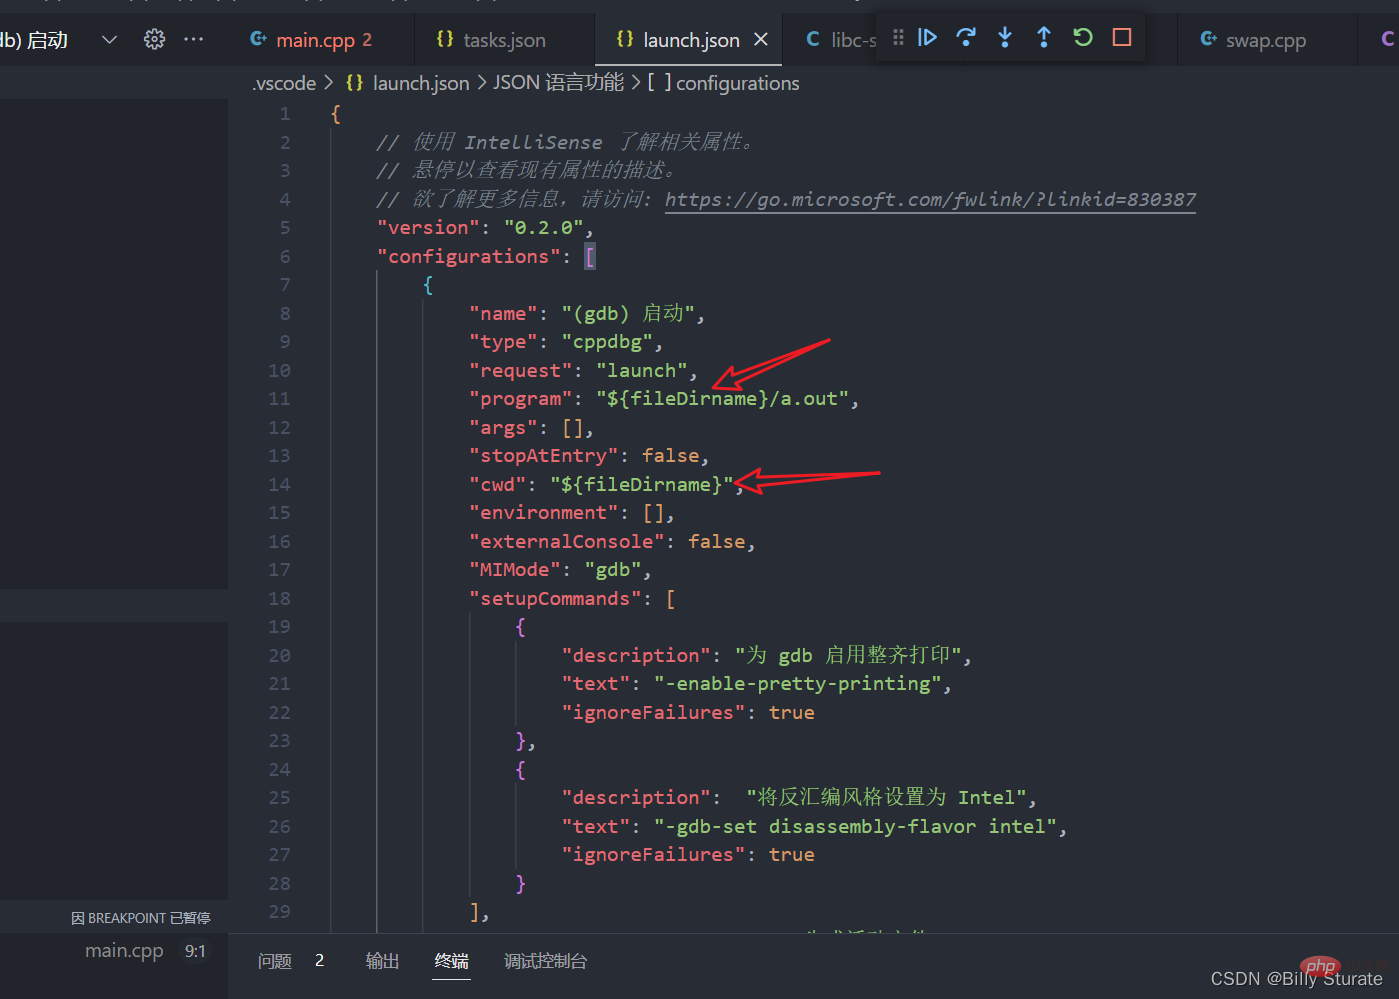
After the modification, it is as shown in the picture above. The a.out behind is the name of the executable file we will debug later. You can also use the one generated by the system here. Change it to your own That's fine, next we start configuring tasks.json
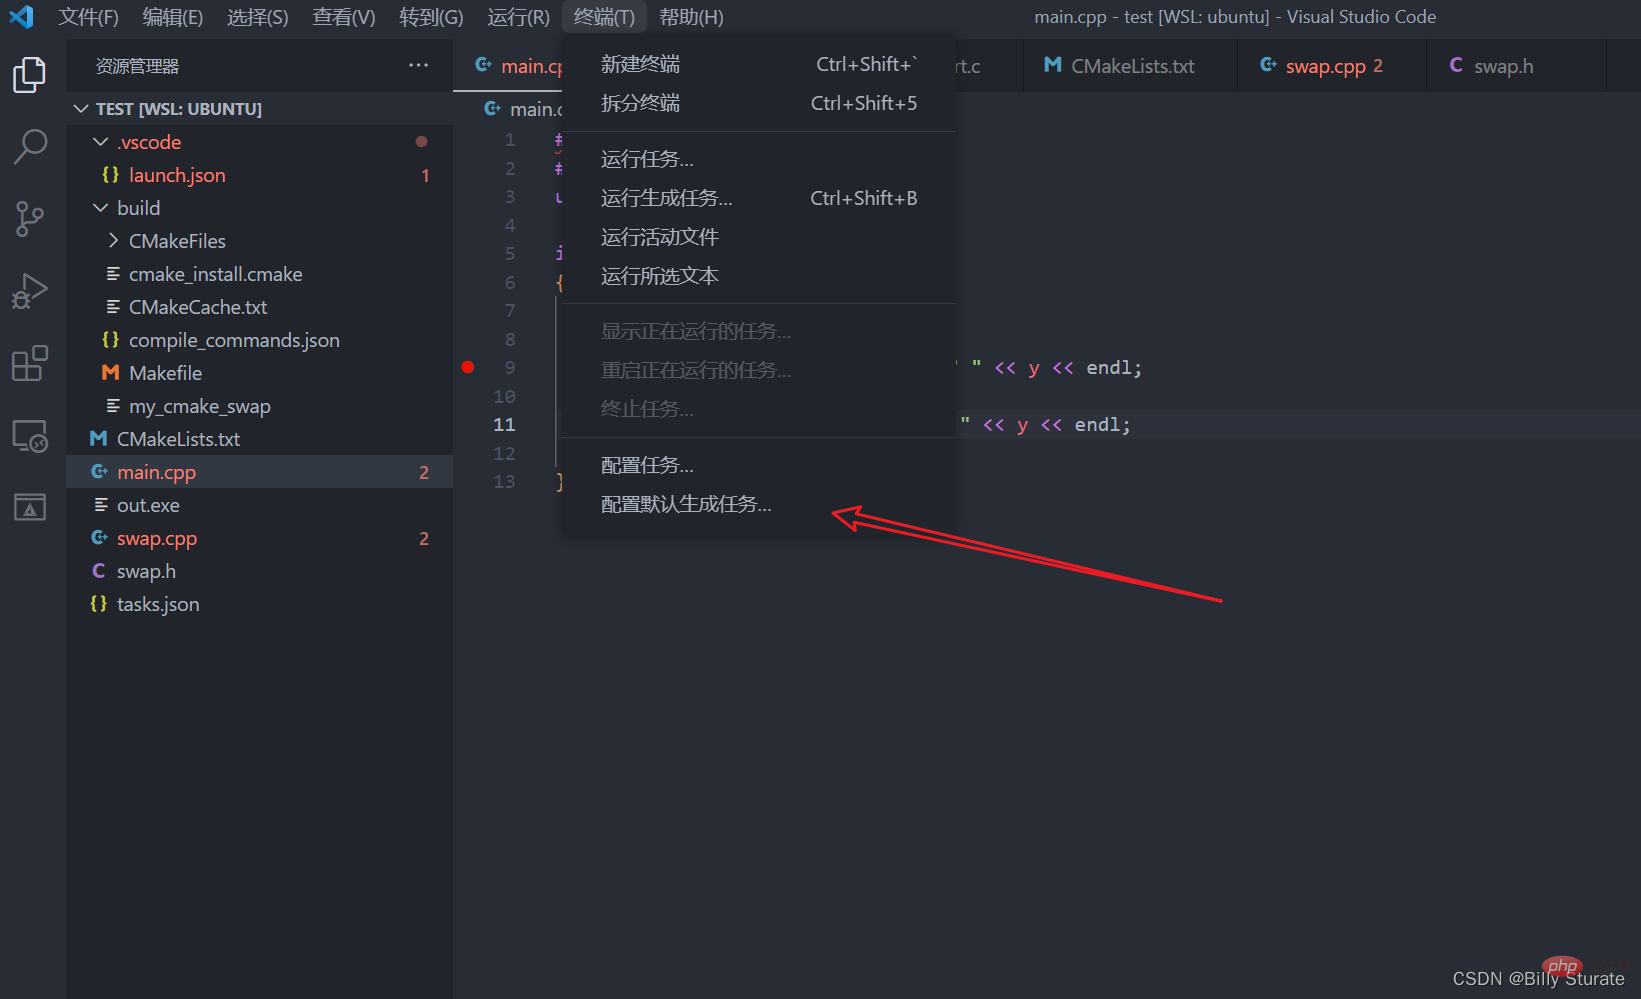
First go back to main.cpp, then click on the terminal in the menu bar above and select the last to configure the default Generate task
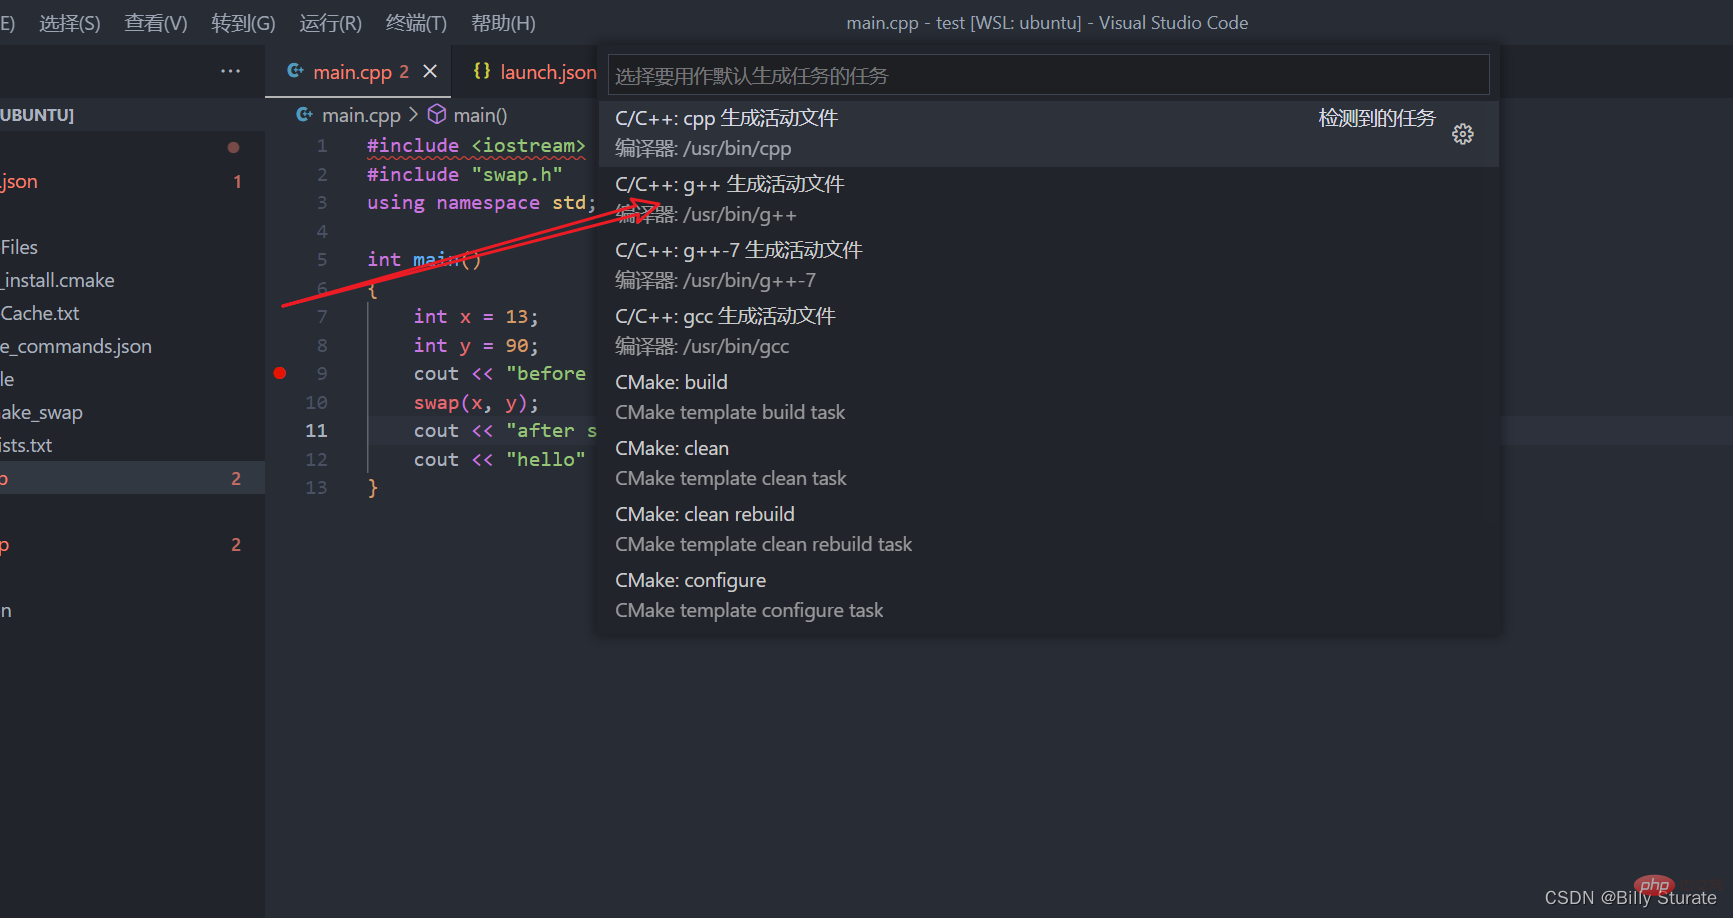
#At this time, as shown above, select the second c/c :g to generate the active file
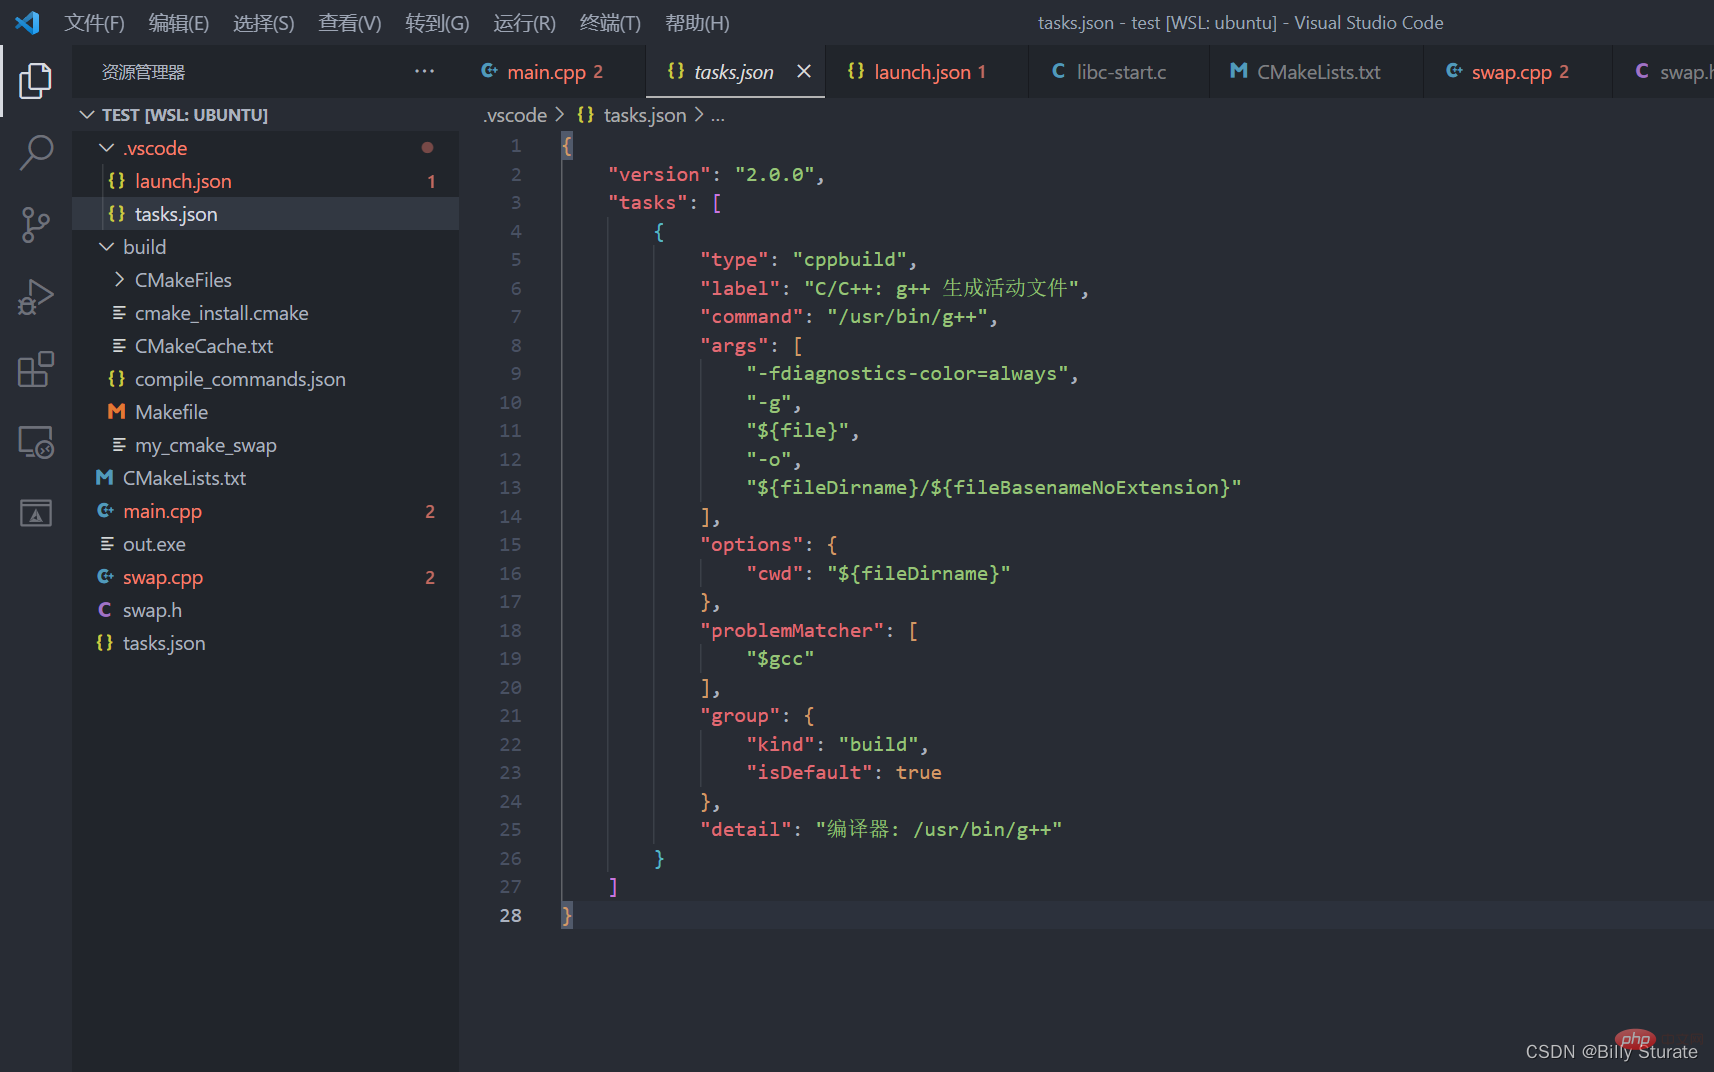
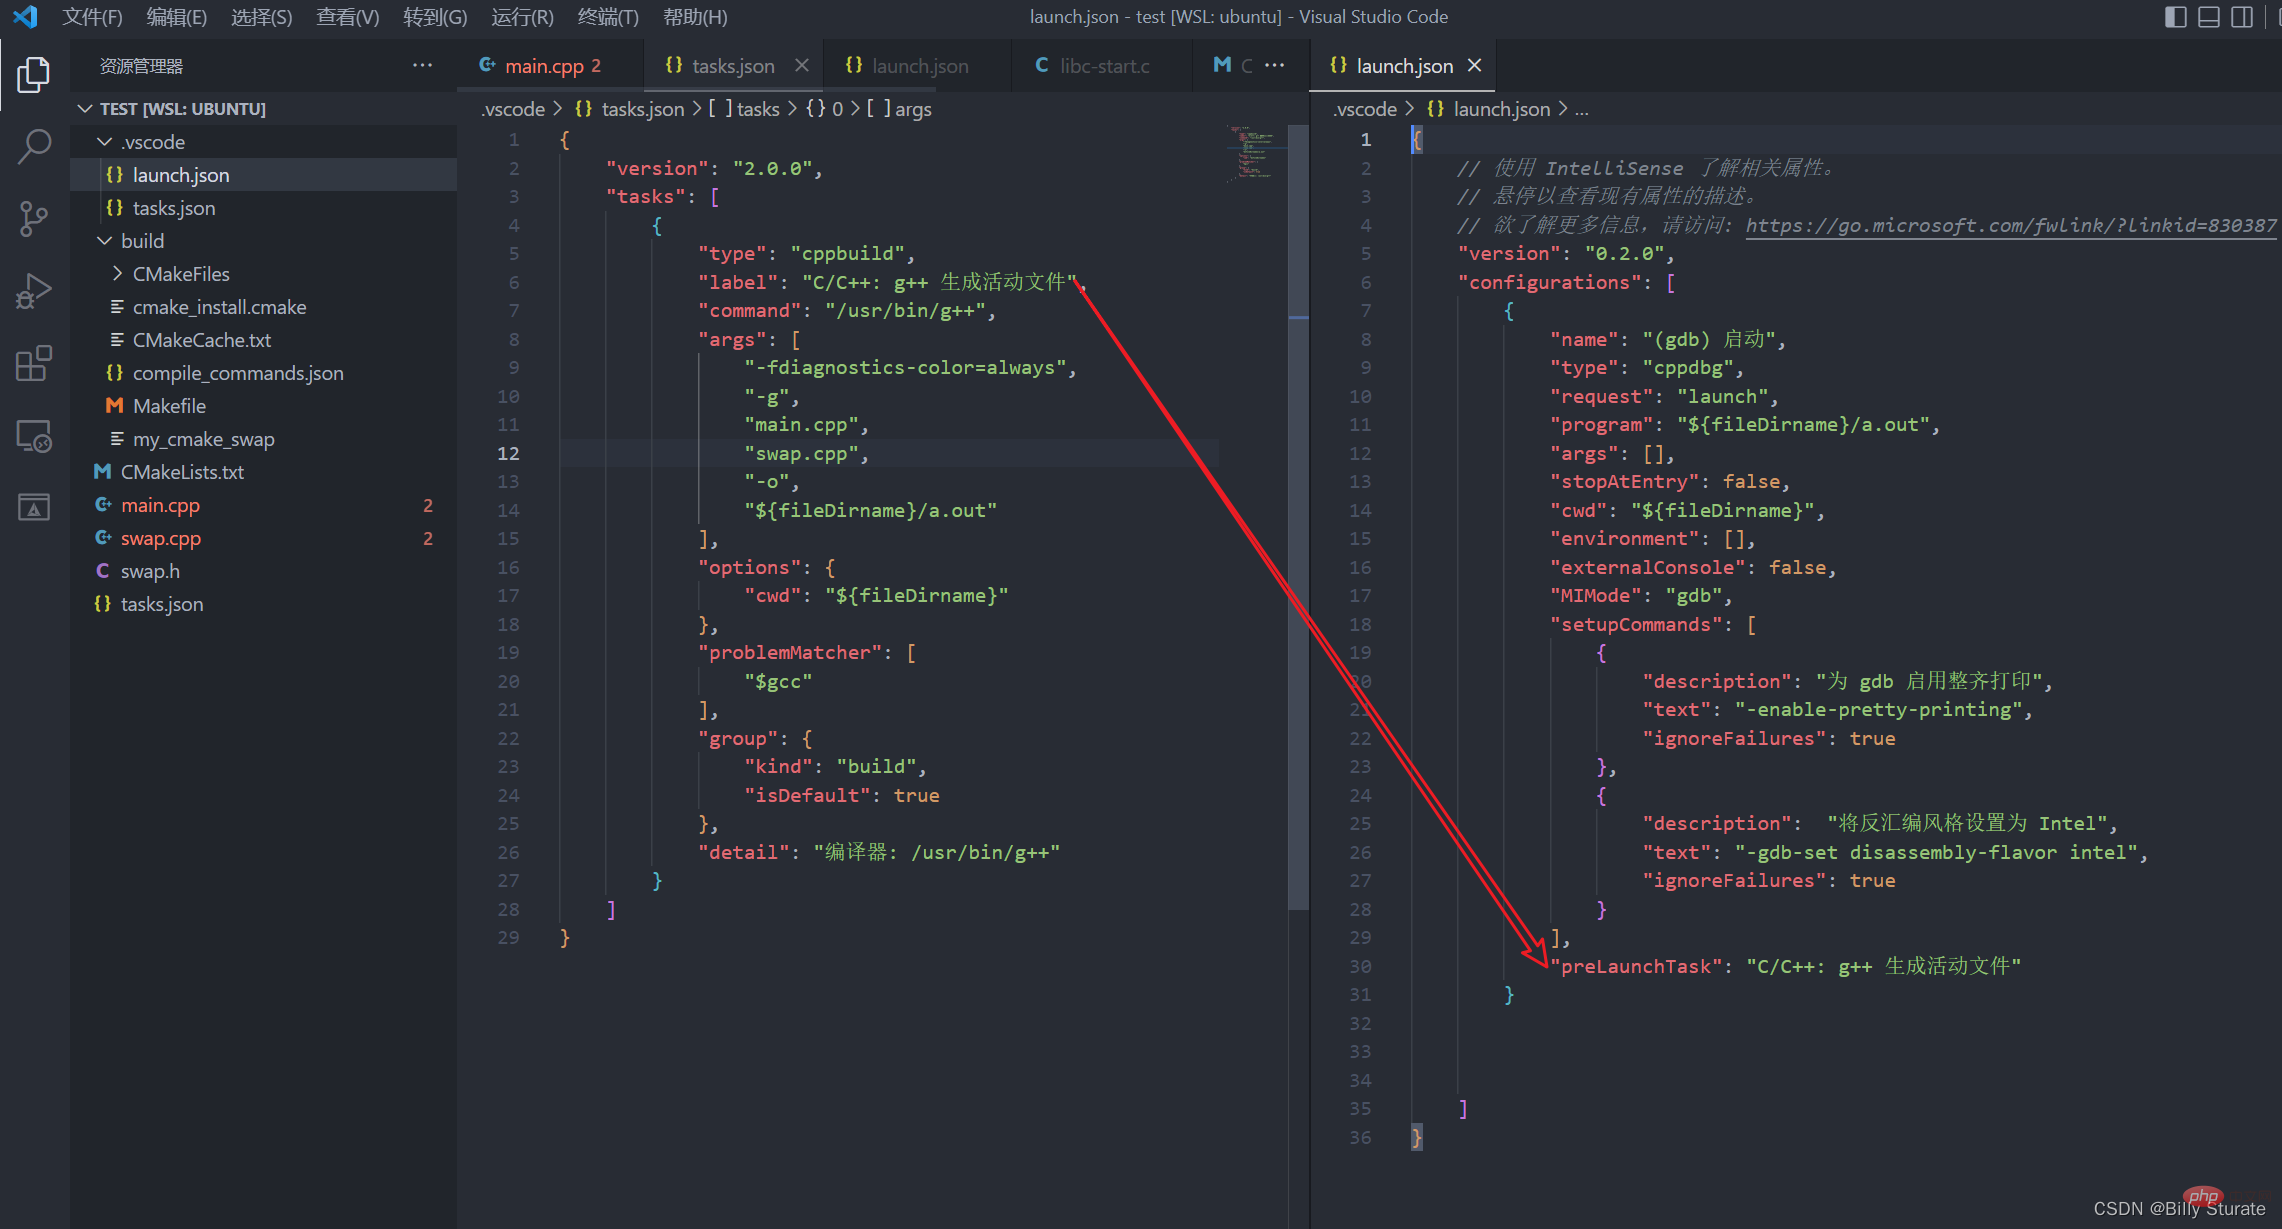
As shown in the figure above, tasks.json is generated. Then we open launch.json to make a comparison. We first add a line of code "preLaunchTask" after launch.json. This line of code It means the name of the task that is run before launch. This name must be consistent with the task name in tasks.json. As shown in the figure below, the label in tasks.json must be exactly the same as the preLaunchTask in launch.json, because during execution Before launch.json, the system will first execute the contents of tasks.json based on this line of code. It can be simply understood that the code in tasks.json will help us compile and generate an executable file using g/gcc, and the code in launch.json It is to let the system debug our executable file.
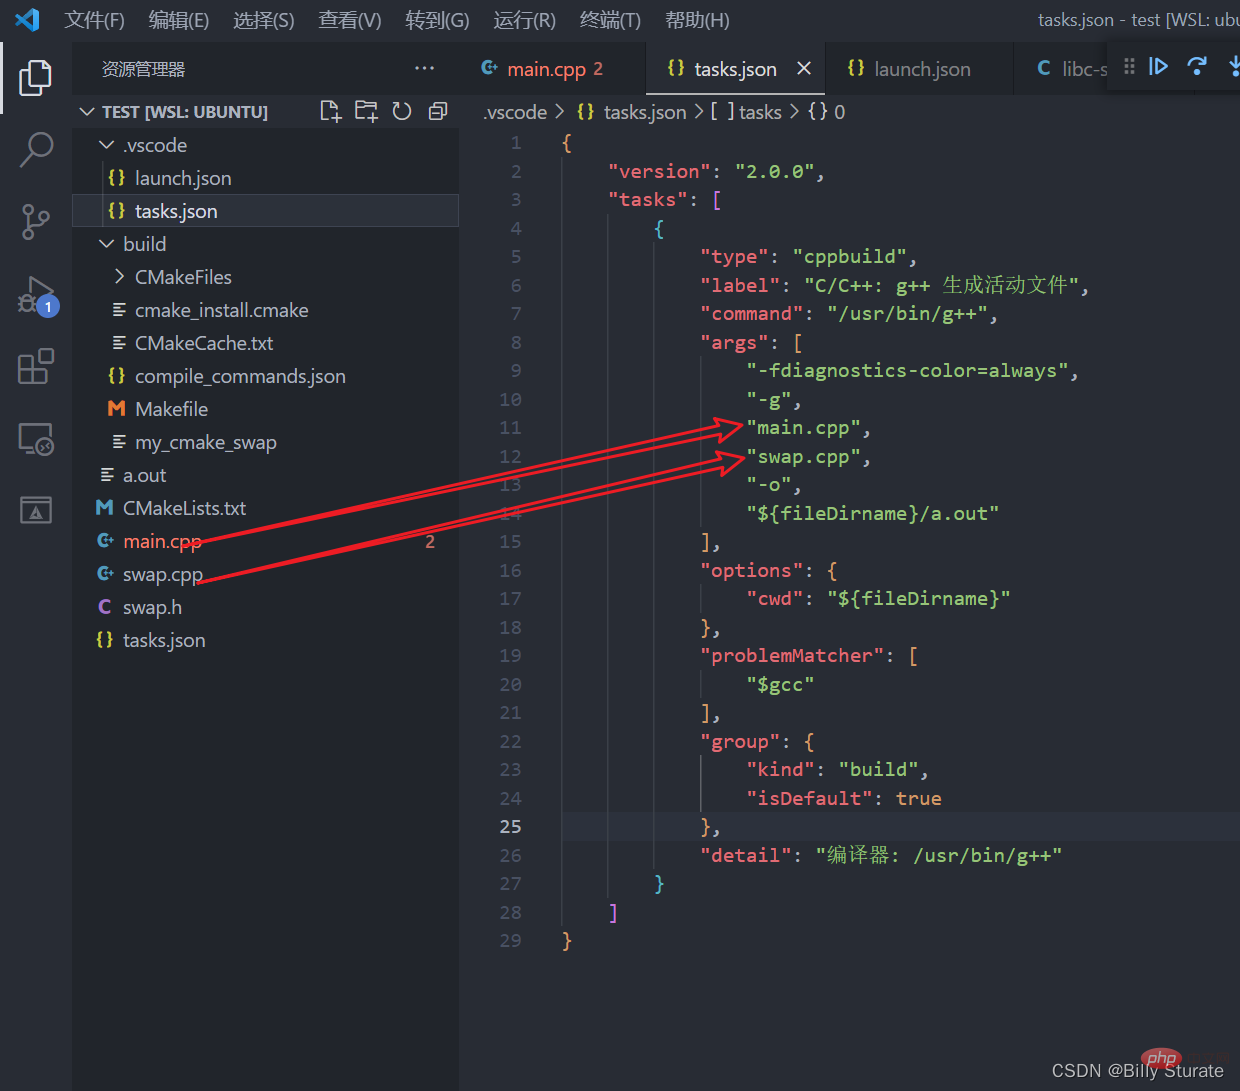
Next, you will see the file in tasks.json, as shown in the figure below. The command configuration specifies the compiler, usually gcc or g compiler, and then The following args are the compilation options after the compiler. Note that -g means compiling an executable file with debugging information. If this -g is missing, the generated executable file cannot be debugged. The following main.cpp and swap.cpp is the name of the file to be compiled, the -0 parameter specifies the name of the generated executable file, the next line is the location of the generated executable file in the current working directory, the name is a.out
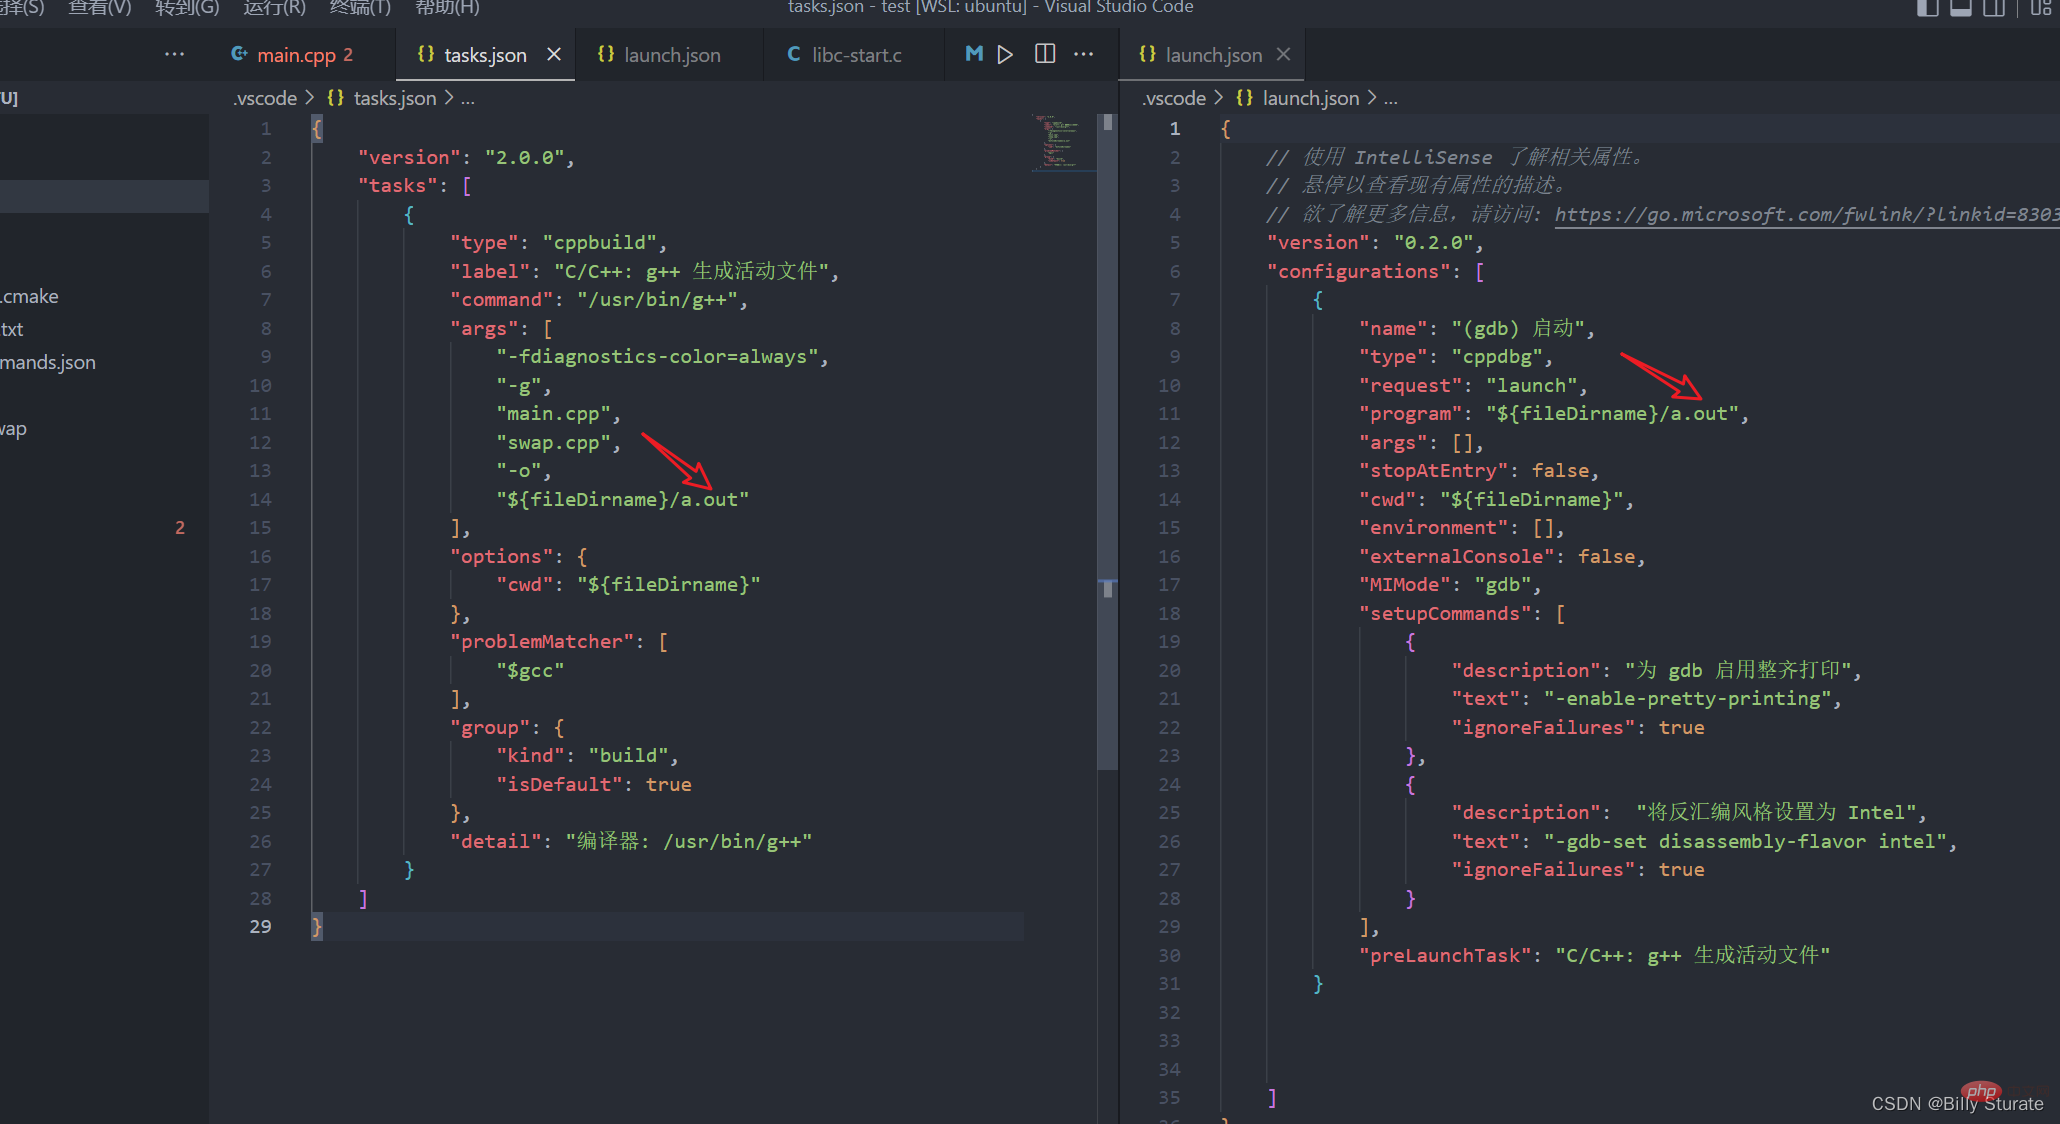
As shown in the figure below, everyone pays attention to the arrow part in the article. The two names must be the same. The one on the left is the generated executable file called a.out, and the one on the right is the debugging file called a. out, the name can be changed by yourself
So tasks.json is actually equivalent to helping us complete the operationg -g main.cpp swap.cpp -o a.out
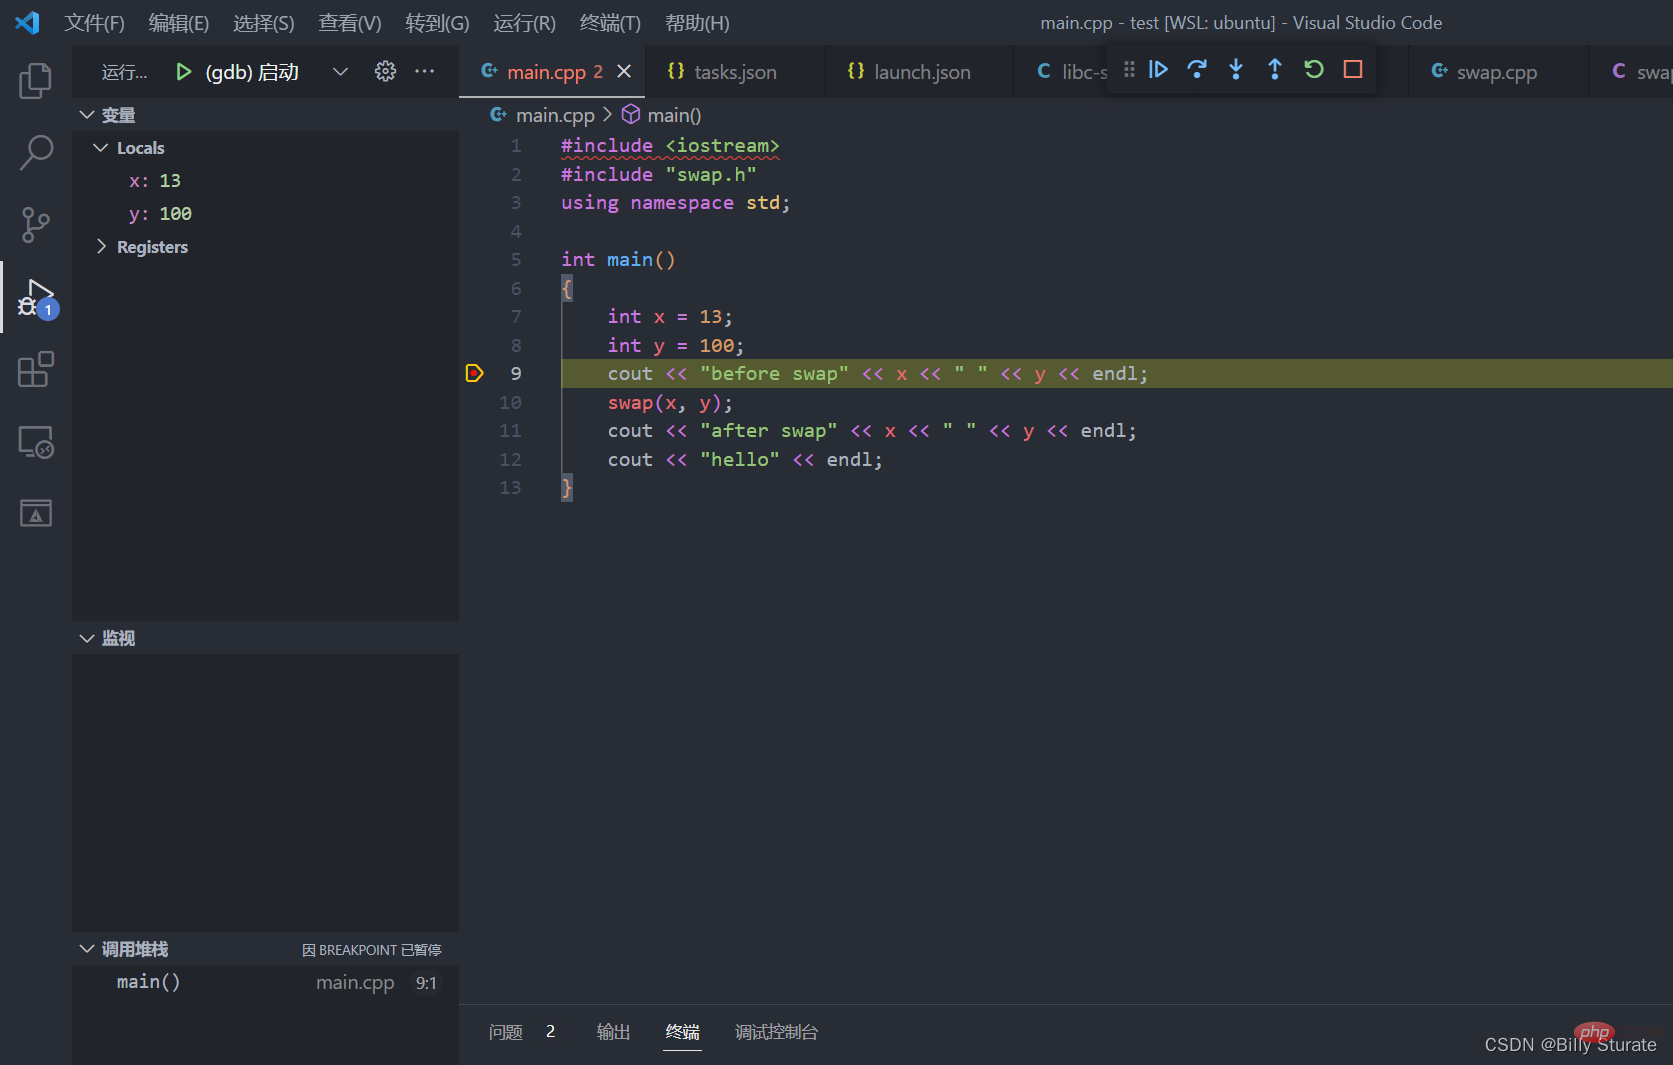
After configuring the above files, go back to main.cpp to set your own breakpoint, and then press the F5 key to debug. Success
For more knowledge about VSCode, please visit: vscode Basic Tutorial!
The above is the detailed content of How to run and debug code in VScode? Tutorial sharing. For more information, please follow other related articles on the PHP Chinese website!

Hot AI Tools

Undresser.AI Undress
AI-powered app for creating realistic nude photos

AI Clothes Remover
Online AI tool for removing clothes from photos.

Undress AI Tool
Undress images for free

Clothoff.io
AI clothes remover

Video Face Swap
Swap faces in any video effortlessly with our completely free AI face swap tool!

Hot Article

Hot Tools

Notepad++7.3.1
Easy-to-use and free code editor

SublimeText3 Chinese version
Chinese version, very easy to use

Zend Studio 13.0.1
Powerful PHP integrated development environment

Dreamweaver CS6
Visual web development tools

SublimeText3 Mac version
God-level code editing software (SublimeText3)

Hot Topics
 1386
1386
 52
52
 What computer configuration is required for vscode
Apr 15, 2025 pm 09:48 PM
VS Code system requirements: Operating system: Windows 10 and above, macOS 10.12 and above, Linux distribution processor: minimum 1.6 GHz, recommended 2.0 GHz and above memory: minimum 512 MB, recommended 4 GB and above storage space: minimum 250 MB, recommended 1 GB and above other requirements: stable network connection, Xorg/Wayland (Linux)
 How to define header files for vscode
Apr 15, 2025 pm 09:09 PM
How to define header files using Visual Studio Code? Create a header file and declare symbols in the header file using the .h or .hpp suffix name (such as classes, functions, variables) Compile the program using the #include directive to include the header file in the source file. The header file will be included and the declared symbols are available.
 How to switch Chinese mode with vscode
Apr 15, 2025 pm 11:39 PM
VS Code To switch Chinese mode: Open the settings interface (Windows/Linux: Ctrl, macOS: Cmd,) Search for "Editor: Language" settings Select "Chinese" in the drop-down menu Save settings and restart VS Code
 Common commands for vscode terminal
Apr 15, 2025 pm 10:06 PM
Common commands for VS Code terminals include: Clear the terminal screen (clear), list the current directory file (ls), change the current working directory (cd), print the current working directory path (pwd), create a new directory (mkdir), delete empty directory (rmdir), create a new file (touch) delete a file or directory (rm), copy a file or directory (cp), move or rename a file or directory (mv) display file content (cat) view file content and scroll (less) view file content only scroll down (more) display the first few lines of the file (head)
 How to set vscode in Chinese
Apr 15, 2025 pm 09:27 PM
There are two ways to set up a Chinese language in Visual Studio Code: 1. Install the Chinese language package; 2. Modify the "locale" settings in the configuration file. Make sure Visual Studio Code version is 1.17 or higher.
 vscode Previous Next Shortcut Key
Apr 15, 2025 pm 10:51 PM
VS Code One-step/Next step shortcut key usage: One-step (backward): Windows/Linux: Ctrl ←; macOS: Cmd ←Next step (forward): Windows/Linux: Ctrl →; macOS: Cmd →
 How to solve the problem of vscode Chinese annotations becoming question marks
Apr 15, 2025 pm 11:36 PM
How to solve the problem that Chinese comments in Visual Studio Code become question marks: Check the file encoding and make sure it is "UTF-8 without BOM". Change the font to a font that supports Chinese characters, such as "Song Style" or "Microsoft Yahei". Reinstall the font. Enable Unicode support. Upgrade VSCode, restart the computer, and recreate the source file.
 How to use VSCode
Apr 15, 2025 pm 11:21 PM
Visual Studio Code (VSCode) is a cross-platform, open source and free code editor developed by Microsoft. It is known for its lightweight, scalability and support for a wide range of programming languages. To install VSCode, please visit the official website to download and run the installer. When using VSCode, you can create new projects, edit code, debug code, navigate projects, expand VSCode, and manage settings. VSCode is available for Windows, macOS, and Linux, supports multiple programming languages and provides various extensions through Marketplace. Its advantages include lightweight, scalability, extensive language support, rich features and version


