 Web Front-end
 JS Tutorial
 Node learning how to minimize heap allocation and prevent memory leaks
Node learning how to minimize heap allocation and prevent memory leaks
How to check memory leaks in Node.js? The following article will introduce you to Nodejs heap allocation and introduce how to minimize heap allocation and prevent memory leaks. I hope it will be helpful to you!

#Memory management issues have always attracted much attention in the computer field. Each piece of software that runs on a computer is allocated a small portion of the computer's limited memory. This memory must be carefully managed and allocated or released at the appropriate time.
Nodejs can handle the tedious task of memory management through its efficient automatic garbage collection mechanism, thereby freeing developers to engage in other tasks. Although Nodejs has helped developers solve the problem of memory management, in the process of developing large-scale applications, it is difficult for developers to understand V8 and Nodejs The memory management mechanism in is still very important.
This article mainly introduces how to allocate and release memory in the heap, and helps you know how to minimize heap allocation and prevent memory leaks. [Related tutorial recommendations: nodejs video tutorial, Programming teaching]
Heap allocation in Nodejs
JavaScript and Node.js abstract a lot of things away for you and do most of the heavy lifting behind the scenes.
We know that when a piece of code is executed, the variables and objects in the code will be stored in stack memory or heap memory, JavaScript The code will be stored in the code that will be executed. in the execution context.
ECMAScript The specification itself does not specify how memory is allocated and managed. This is an implementation detail that relies on the JavaScript engine and underlying system architecture. A deep understanding of how the engine handles variables is beyond the scope of this article, but if you want to learn more about how V8 does this, please refer to the articleJavaScript Memory Model Revealing how and data are stored in V8 JS engine memory? .
Why is efficient heap memory usage important in Node.js?
Memory variables stored in the heap will always exist unless It is deleted or freed by the garbage collector. Heap memory is a large contiguous block of memory that remains in this state even after it is allocated and released.
Unfortunately, due to the way heap memory is collected and released, memory can be wasted, causing leaks.
V8 uses a generational garbage collection mechanism, that is, it divides objects into different generations (new generation and old generation). The generation space will be divided into different areas - for example, the new generation consists of new space, and the old generation will be divided into old space, mapping space and large object space. New objects are initially allocated to the new generation space. When the new generation space is used up, the garbage collector will perform a cleanup mechanism to free up the space. Objects that survive one GC run are copied to the middle of the young generation, and objects that survive the second run are moved to the old generation.
Since the running program first collects memory, occupying precious virtual memory resources, when the memory is no longer needed, the program must release the memory, which is memory release.
In addition, if the memory is released (regardless of where it was previously released in the heap), the heap memory will be merged into a continuous block of memory. Due to the increased complexity of the heap memory, storing here will incur a higher performance overhead (but allows for greater flexibility in subsequent stores).
Although Nodejs has an efficient garbage collection mechanism, inefficient use of heap memory may lead to memory leaks. Applications may take up too much memory or even crash.
Causes of Nodejs Heap Memory Leak
The garbage collector will find and release orphaned memory spaces, but sometimes it may not be able to track every piece of memory. This can lead to unnecessary load increases, especially for large applications. We will discuss in detail how the garbage collector works in Nodejs later.
Some of the most common causes of memory leaks include:
- Multiple references
- Global variables
- Closure
- Timer
- Event
Use multiple It is a very common operation to hold a reference to an object through a variable pointer. While this is very convenient for you, it can also cause a memory leak if one of the references to the object is collected by the garbage collector, but the other references are not.
In Node.js and JavaScript applications, timers and callback functions that are forgotten to be cleaned are also two common causes of memory leaks. Objects bound to a timer will not be garbage collected until timeout. If the timer runs forever, the referenced object will never be collected by the garbage collector. This happens even if no variable pointer refers to the object, thus creating a memory leak in the heap.
Think about the sample code:
const language = () => {
  console.log("Javascript");】
  // 递归自身
  setTimeout(() => language(), 1000);
}The above code will always run and will never be recycled by the garbage collector
How to find out## Memory leaks in #Nodejs
There are several tools that can be used to detect and debug memory leaks in Nodejs, including Chrome DevTools , the process of Node. Garbage collector dashboard for memoryUsage API and AppSignal.
Using Chrome DevTools
Chrome DevToolsProbably one of the easiest tools out there. To start the debugger, you need to start the Node in inspect mode. Run node --inspect to do this.
Node is app.js, you need to run node --inspect app.js to debug Node applications. Then, open the Chromium browser and enter chrome://inspect. You can also open the inspector page at Edge://inspect. In the inspector page, you should see a page like this:
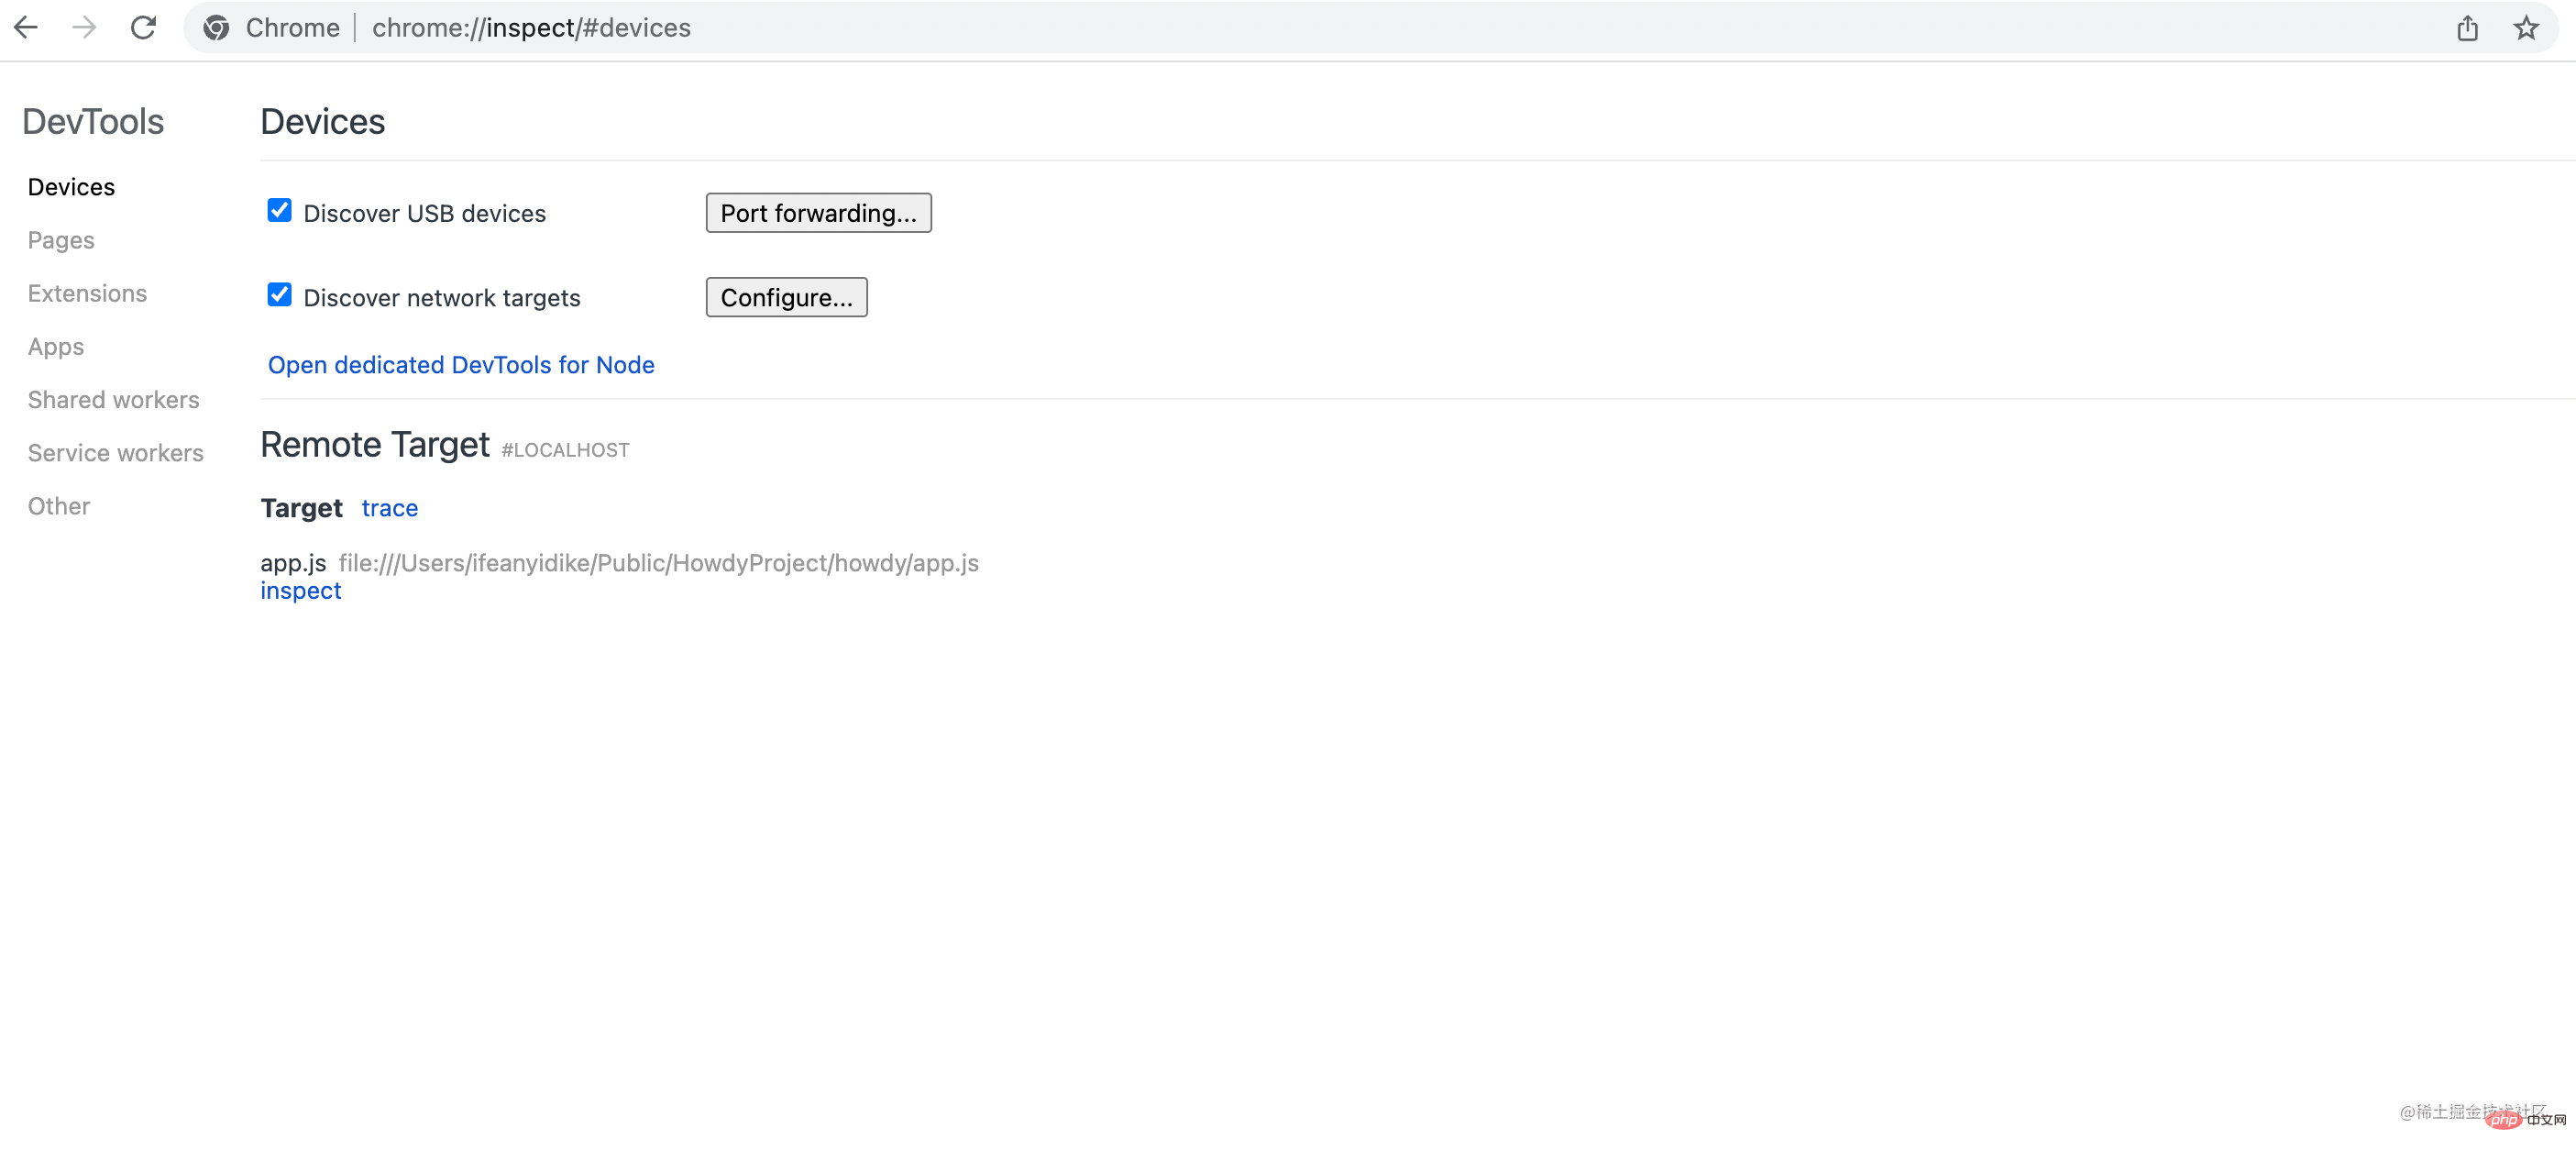
Node application you are trying to debug appears in the inspector page bottom. Click inspect to open the debugger. The debugger has two important tabs - Memory and Profiler - but in this discussion we will focus on the Memory tab.
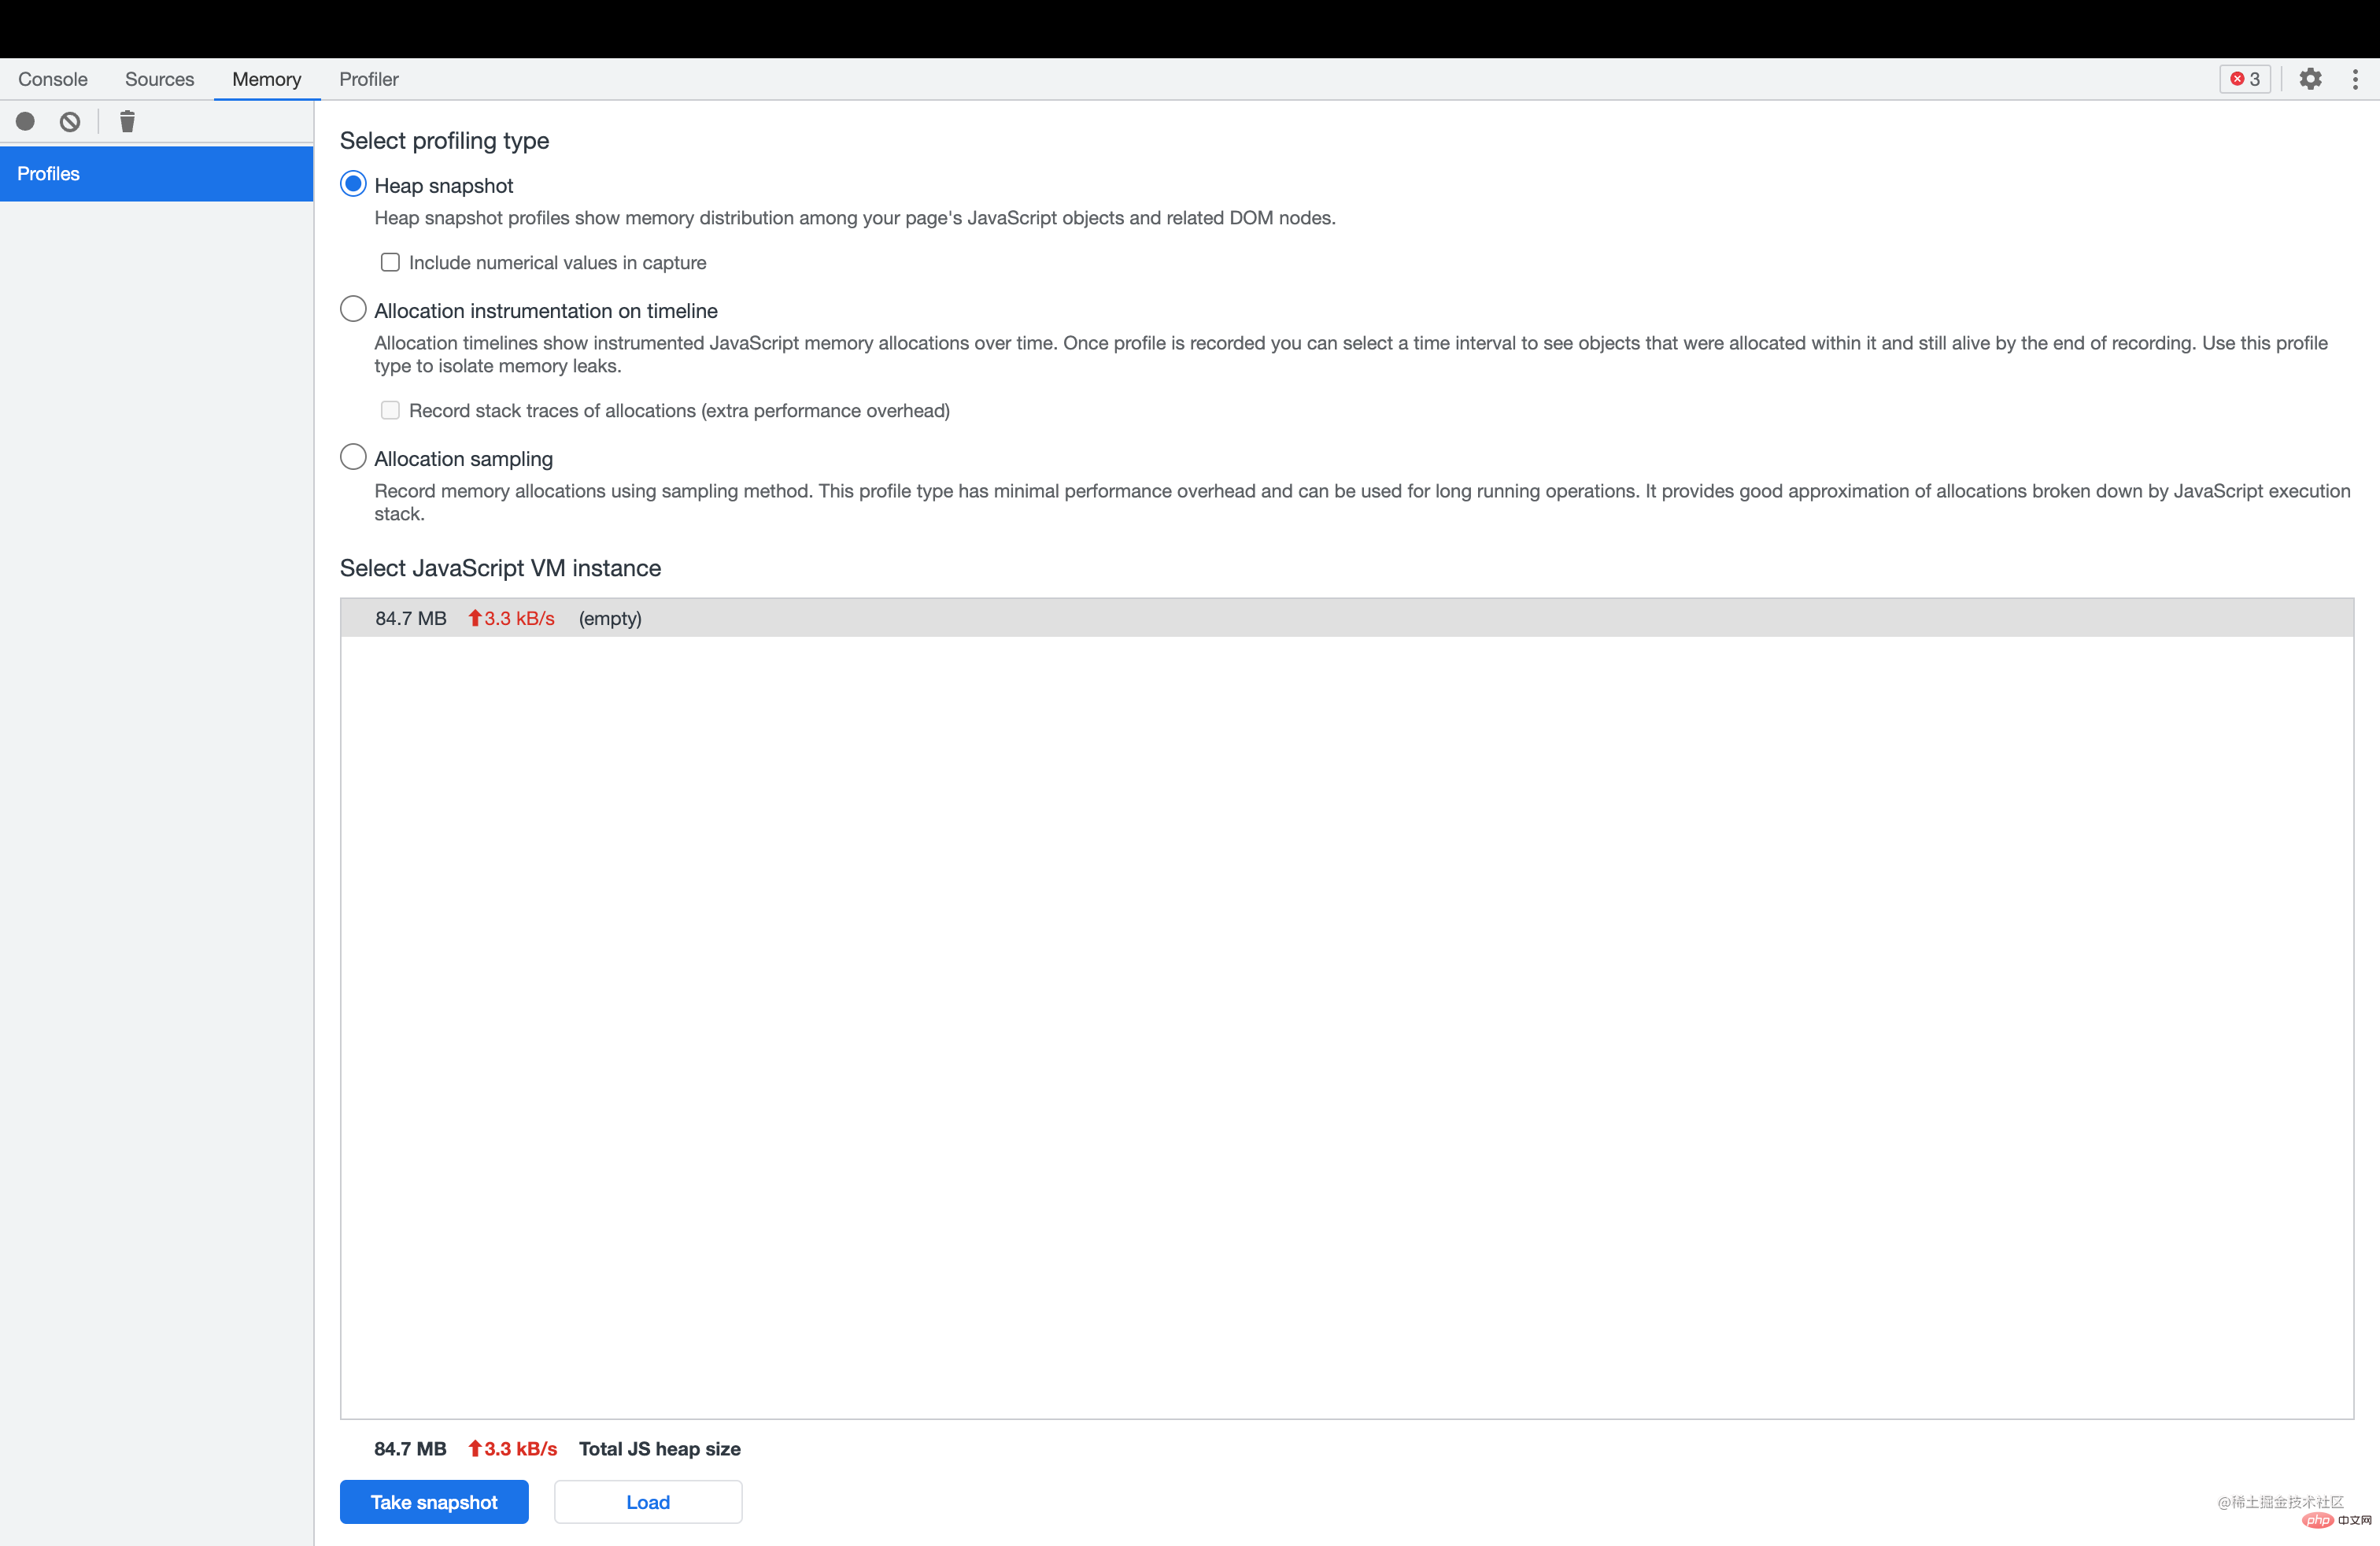
Chrome Debugger The easiest way to find memory leaks is to use a Heap Snapshot. Snapshots can help you inspect some variables or check their reserve size.
Heap snapshot and then click the *Take snapshot button. This may take some time, depending on your application's Total JS heap size. You can also load an existing snapshot by clicking the load button at the bottom of DevTool.
Summary
: Nodein the application based on the constructor name Objects are displayed in groupsComparison
: Display the difference between two snapshots-
Containment
: Allows you to look inside the heap and analyze objects referenced in the global namespace Statistics
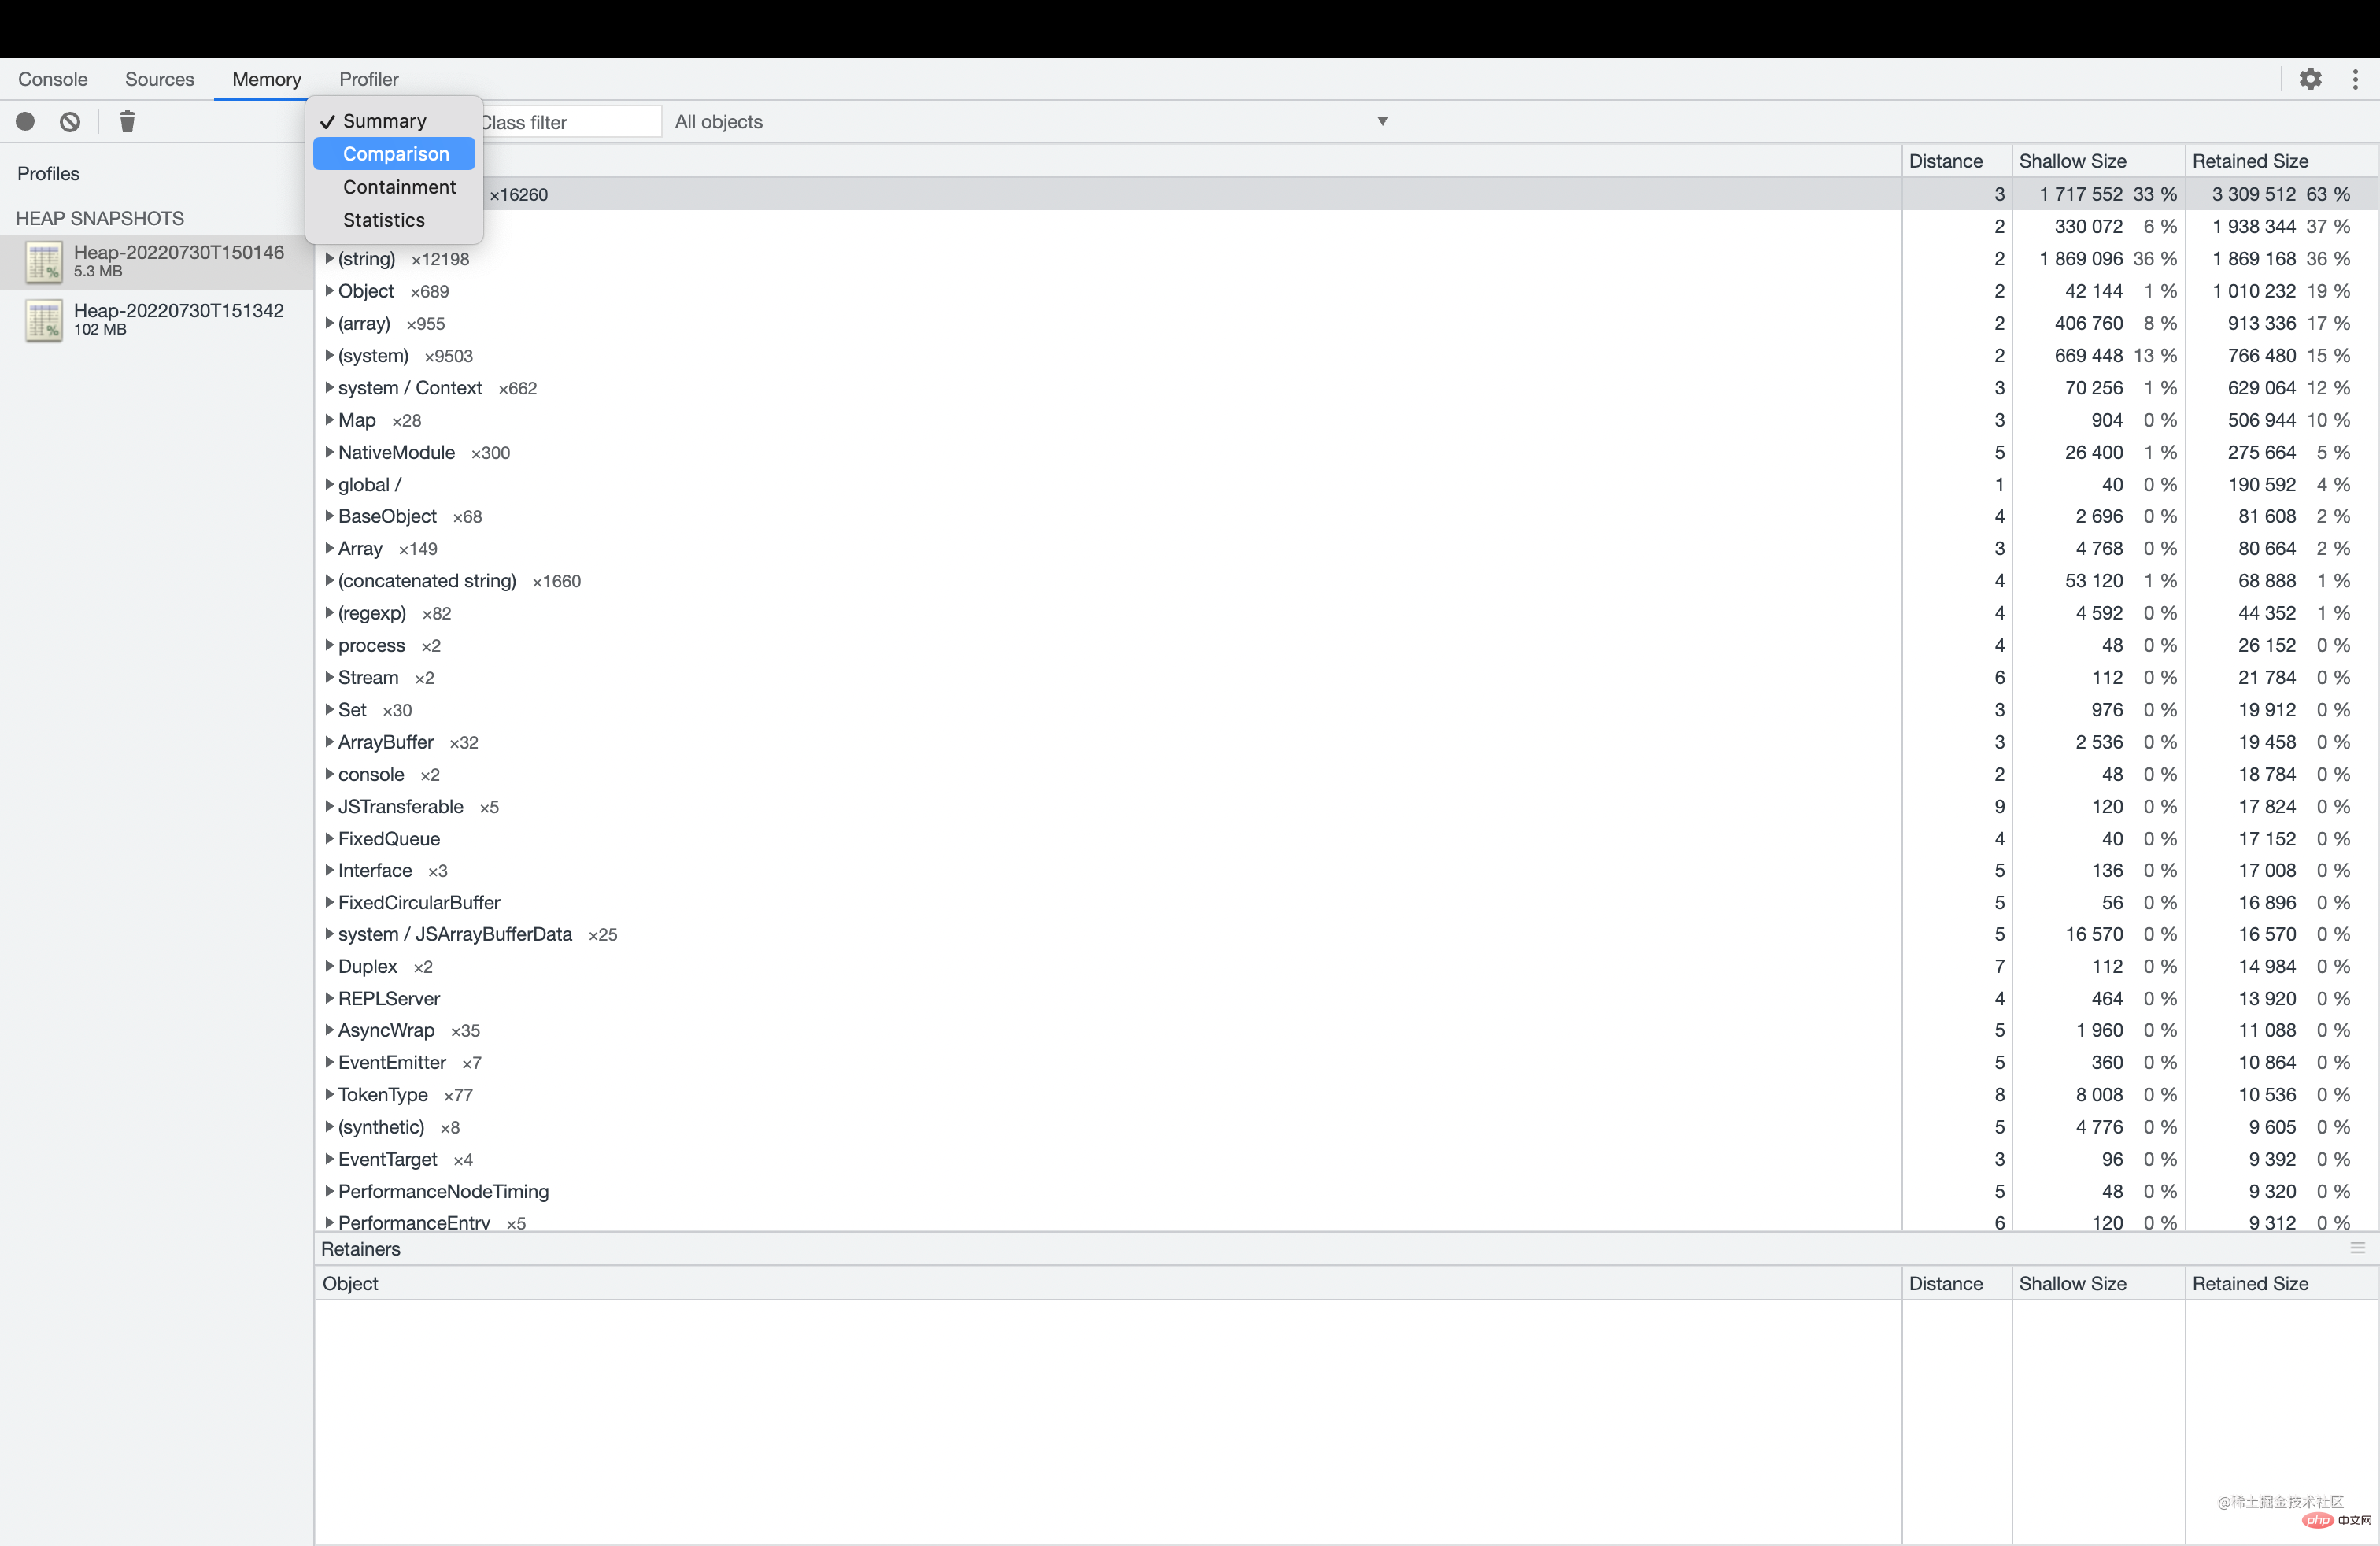 ##There are two columns that stand out in the
heap analyzer - namely Shallow Size and Retained Size.
Shallow Size represents the size of the object itself in memory. This memory size is not large for most objects, except array and string types. On the other hand, Retained Size is the memory size released when the object in question and dependent objects are released or become inaccessible from the root node.
is not the only way to get a heap snapshot. If you are using nodejs 12.0 or higher, you can also run the node --heapsnapshot-signal command: <div class="code" style="position:relative; padding:0px; margin:0px;"><pre class='brush:php;toolbar:false;'>node --heapsnapshot-signal=SIGUSR2 app.js</pre><div class="contentsignin">Copy after login</div></div> Although any flag can be used, But it is recommended to use user-defined signals
or SIGUSR2. If you obtain a pair snapshot from an application running on the server, you can use the
function in the V8 package: <div class="code" style="position:relative; padding:0px; margin:0px;"><pre class='brush:php;toolbar:false;'>require("v8").writeHeapSnapshot();</pre><div class="contentsignin">Copy after login</div></div><p>这个方法要求 <code>Nodejs 的版本高于 11.13。在早期的版本中,你可以使用相关的包来实现。
使用 Chrome DevTools 获取堆快照并不是调试内存问题的唯一方法。你也可以使用Allocation instrumentation on timeline 跟踪每个堆分配的情况。
内存分配时间轴显示了随时间变化的测量内存分配的情况。要启用此功能,需要先启动分析器(Profiler),然后运行应用程序示例以开始调试内存问题。如果你希望记录长时间运行的内存分配操作,并想要更小的性能开销,那么最好的选择是分配抽样方法。
通过 Node 的 process.memoryUsage API
你也可以使用 Node 的 process.memoryUsage API来观察内存使用情况。运行 process.memoryUsage,你可以访问以下内容:
rss:已分配的内存量heapTotal:已分配堆的总大小heapUsed:当执行进程时被使用内存总量arrayBuffers:为 Buffer 实例分配的内存大小
使用 AppSignal 的垃圾收集器看板
为了可视化堆的变化情况,AppSignal 提供了一个方便的垃圾收集看板。当你将 Node.js 应用连接到AppSignal 时,这个看板会自动为你生成!
看看这个例子,在“V8 Heap Statistics”图表中,你可以清楚地看到内存使用的峰值:

如果看板中中的数据出现一个稳定增长的趋势,这意味着你的代码中或者依赖中存在内存泄漏的情况。
垃圾回收机制工作原理
如果你知道如何发现内存泄漏,但如何修复它们?我们可能很快就知道。但是首先重要的是理解 Nodejs 和 V8 是如何进行垃圾收集的。
垃圾回收机制会在不需要的时候释放内存。为了更高效的工作,垃圾回收算法必须正确的定义和识别不需要再内存中继续存储的内容。
在引用计数 GC 算法中,如果堆中的对象在堆栈中不再有引用,则该对象将被垃圾收集。该算法通过计数引用来工作——因此,如果引用计数为零,则对象将进行垃圾收集。尽管这个算法大多数时候都有效,但它在处理循环引用的情况时却失效了。
看一下代码示例:
let data = {};
data.el = data;
let obj1 = {};
let obj2 = {};
obj1.a = obj2;
obj2.a = obj1;具有循环引用的对象永远不会被清除作用域或被垃圾回收器回收,即使不再需要或使用它们。这会形成内存泄漏,并使应用程序效率低下。值得庆幸的是,Node.js 不再使用这种算法进行垃圾回收。
JavaScript 中的最上层对象是一个全局对象。在浏览器中,是 window 对象,但在 Nodejs 中,是 global 对象。该算法比引用计数算法更高效,并解决了循环引用的问题。
考虑到上面的例子,虽然 obj1 和 obj2 仍然存在循环引用,但如果它们不再从顶级对象可访问(不再需要),它们将被垃圾收集。
这种算法,通常称为 mark and sweep (标记清除算法)回收算法,非常有用。但是,你必须小心并显式地使一个对象从根节点不可访问,以确保它被垃圾收集。
修复 Nodejs App 中的内存泄漏
这有一些方法可以提高内存使用率并避免内存泄漏。
避免全局变量
全局变量包括使用 var 关键字声明的变量、this 关键字声明的变量和未使用关键字声明的变量。
我们已经偶然声明的全局变量(以及任何其他形式的全局变量)会导致内存泄漏。它们总是可以从全局对象访问,因此除非显式地设置为 null,否则不能被垃圾收集。
考虑下面的例子:
function variables() {
  this.a = "Variable one";
  var b = "Variable two";
  c = "Variable three";
}这三个变量都是全局变量。为了避免使用全局变量,可以考虑在文件顶部添加 use strict 指令来切换strict 模式。
使用 JSON.parse
JSON 的语法比 JavaScript 简单得多,因此它比 JavaScript 对象更容易解析。
事实上,如果你使用一个大型 JavaScript 对象,通过将其转化为字符串形式,使用时解析为 JSON,那么你可以在 V8 和Chrome 中将性能提高 1.7 倍。
在其他 JavaScript 引擎(如Safari)中,性能可能会更好。在 Webpack 中使用这种优化方法来提高前端应用程序的性能。
例如,不使用以下 JavaScript 对象:
const Person = { name: "Samuel", age: 25, language: "English" };更有效的方法是将它们进行字符串化,然后将其解析为JSON。
const Person = JSON.parse('{"name":"Samuel","age":25,"language":"English"}');将大数据处理拆分为块并创建子进程
你获取在实际业务中会当处理大型数据时,遇到一些奇观的内存溢出的问题,例如大的 CSV 文件。当然,你可以通过扩展你的应用内存上限去处理任务,但是最好的方法是通过将大块数据分割为多个小块(chunks)。
在一些情况下,在多核机器上扩展 Node.js 应用程序可能会有所帮助。这涉及到将应用程序分离为主进程和工作进程。worker 处理繁重的逻辑,而 master 控制 worker 并在内存耗尽时重新启动它们。
有效使用计时器
我们创建的计时器可能会造成内存泄漏。为了提高堆内存管理,确保你的计时器不会永远运行。
特别是,使用 setInterval 创建计时器时,当不再需要计时器时调用 clearInterval 清除计时器是至关重要的。
当你不再需要使用 setTimeout 或 setimmediation 创建计时器时,调用 clearTimeout 或clearImmediate 也是一个很好的实践。
const timeout = setTimeout(() => {
  console.log("timeout");
}, 1500);

const immediate = setImmediate(() => {
  console.log("immediate");
});

const interval = setInterval(() => {
  console.log("interval");
}, 500);

clearTimeout(timeout);
clearImmediate(immediate);
clearInterval(interval);移除闭包中不在需要的变量
在 JavaScript 中,闭包是一个常见概念。例如存在函数嵌套或者回调函数。如果在函数中使用了一个变量,当函数返回时,它将被标记为垃圾收集,但闭包可不是这样的。
代码示例:
const func = () => {
  let Person1 = { name: "Samuel", age: 25, language: "English" };
  let Person2 = { name: "Den", age: 23, language: "Dutch" };

  return () => Person2;
};上面函数会一直引用父级作用域并将每个变量保存在作用域中。换句话说,虽然你仅仅使用了 Person2,但 Person1 和 Person2 都被保存在作用域中。
这会消耗更多内存,并造成内存泄漏。为此,在面临上面这种情况时,你最好仅声明你需要的,将不需要的重置为 null。
例如:
const func = () => {
  let Person1 = { name: "Samuel", age: 25, language: "English" };
  let Person2 = { name: "Den", age: 23, language: "Dutch" };
  Person1 = null;
  return () => Person2;
};取消订阅观察者和 Event Emitters
具有较长生命周期的观察器和事件发射器可能是内存泄漏的来源,特别是如果你在不再需要它们时没有取消订阅的话。
代码示例:
const EventEmitter = require("events").EventEmitter;
const emitter = new EventEmitter();

const bigObject = {}; //Some big object
const listener = () => {
  doSomethingWith(bigObject);
};
emitter.on("event1", listener);在这里,我们保留 bigObject 的内存,直到侦听器从发射器中释放,或者发射器被垃圾收集。为了解决这个问题,我们需要调用 removeEventListener 从发射器中释放监听器。
emitter.removeEventListener("event1", listener);当连接到发射器的事件侦听器超过 10 个时,也可能发生内存泄漏。大多数情况下,你可以通过编写更高效的代码来解决这个问题。
但是,在某些情况下,你可能需要显式地设置最大事件侦听器。
例如:
emitter.setMaxListeners(n);
总结
在这篇文章中,我们探索了如何最小化你的堆和检测 Node.js 中的内存泄漏。
我们首先研究了 Node 中的堆分配,包括堆栈和堆的工作方式。然后,我们考虑了跟踪内存使用情况和内存泄漏的原因的重要性。
接下来,我们看到了如何使用 Chrome DevTools , Node 的进程来查找内存泄漏。memoryUsage API和 AppSignal 的垃圾收集可视化看板。
最后,我们发现了垃圾收集是如何工作的,并分享了一些修复应用程序内存泄漏的方法。
Like any other programming language, memory management is very important in JavaScript and Node.js. I hope this introduction is useful to you. Happy coding!
##For more node-related knowledge, please Visit:Original link: Minimize Heap Allocations in Node.js
nodejs tutorial!
The above is the detailed content of Node learning how to minimize heap allocation and prevent memory leaks. For more information, please follow other related articles on the PHP Chinese website!

Hot AI Tools

Undresser.AI Undress
AI-powered app for creating realistic nude photos

AI Clothes Remover
Online AI tool for removing clothes from photos.

Undress AI Tool
Undress images for free

Clothoff.io
AI clothes remover

AI Hentai Generator
Generate AI Hentai for free.

Hot Article

Hot Tools

Notepad++7.3.1
Easy-to-use and free code editor

SublimeText3 Chinese version
Chinese version, very easy to use

Zend Studio 13.0.1
Powerful PHP integrated development environment

Dreamweaver CS6
Visual web development tools

SublimeText3 Mac version
God-level code editing software (SublimeText3)

Hot Topics
 How to implement an online speech recognition system using WebSocket and JavaScript
Dec 17, 2023 pm 02:54 PM
How to use WebSocket and JavaScript to implement an online speech recognition system Introduction: With the continuous development of technology, speech recognition technology has become an important part of the field of artificial intelligence. The online speech recognition system based on WebSocket and JavaScript has the characteristics of low latency, real-time and cross-platform, and has become a widely used solution. This article will introduce how to use WebSocket and JavaScript to implement an online speech recognition system.
 WebSocket and JavaScript: key technologies for implementing real-time monitoring systems
Dec 17, 2023 pm 05:30 PM
WebSocket and JavaScript: Key technologies for realizing real-time monitoring systems Introduction: With the rapid development of Internet technology, real-time monitoring systems have been widely used in various fields. One of the key technologies to achieve real-time monitoring is the combination of WebSocket and JavaScript. This article will introduce the application of WebSocket and JavaScript in real-time monitoring systems, give code examples, and explain their implementation principles in detail. 1. WebSocket technology
 How to implement an online reservation system using WebSocket and JavaScript
Dec 17, 2023 am 09:39 AM
How to use WebSocket and JavaScript to implement an online reservation system. In today's digital era, more and more businesses and services need to provide online reservation functions. It is crucial to implement an efficient and real-time online reservation system. This article will introduce how to use WebSocket and JavaScript to implement an online reservation system, and provide specific code examples. 1. What is WebSocket? WebSocket is a full-duplex method on a single TCP connection.
 How to use JavaScript and WebSocket to implement a real-time online ordering system
Dec 17, 2023 pm 12:09 PM
Introduction to how to use JavaScript and WebSocket to implement a real-time online ordering system: With the popularity of the Internet and the advancement of technology, more and more restaurants have begun to provide online ordering services. In order to implement a real-time online ordering system, we can use JavaScript and WebSocket technology. WebSocket is a full-duplex communication protocol based on the TCP protocol, which can realize real-time two-way communication between the client and the server. In the real-time online ordering system, when the user selects dishes and places an order
 Simple JavaScript Tutorial: How to Get HTTP Status Code
Jan 05, 2024 pm 06:08 PM
JavaScript tutorial: How to get HTTP status code, specific code examples are required. Preface: In web development, data interaction with the server is often involved. When communicating with the server, we often need to obtain the returned HTTP status code to determine whether the operation is successful, and perform corresponding processing based on different status codes. This article will teach you how to use JavaScript to obtain HTTP status codes and provide some practical code examples. Using XMLHttpRequest
 JavaScript and WebSocket: Building an efficient real-time weather forecasting system
Dec 17, 2023 pm 05:13 PM
JavaScript and WebSocket: Building an efficient real-time weather forecast system Introduction: Today, the accuracy of weather forecasts is of great significance to daily life and decision-making. As technology develops, we can provide more accurate and reliable weather forecasts by obtaining weather data in real time. In this article, we will learn how to use JavaScript and WebSocket technology to build an efficient real-time weather forecast system. This article will demonstrate the implementation process through specific code examples. We
 How to get HTTP status code in JavaScript the easy way
Jan 05, 2024 pm 01:37 PM
Introduction to the method of obtaining HTTP status code in JavaScript: In front-end development, we often need to deal with the interaction with the back-end interface, and HTTP status code is a very important part of it. Understanding and obtaining HTTP status codes helps us better handle the data returned by the interface. This article will introduce how to use JavaScript to obtain HTTP status codes and provide specific code examples. 1. What is HTTP status code? HTTP status code means that when the browser initiates a request to the server, the service
 Django: A magical framework that can handle both front-end and back-end development!
Jan 19, 2024 am 08:52 AM
Django: A magical framework that can handle both front-end and back-end development! Django is an efficient and scalable web application framework. It is able to support multiple web development models, including MVC and MTV, and can easily develop high-quality web applications. Django not only supports back-end development, but can also quickly build front-end interfaces and achieve flexible view display through template language. Django combines front-end development and back-end development into a seamless integration, so developers don’t have to specialize in learning


