 Web Front-end
 JS Tutorial
 Implementing the effect of Baidu map ABCD marker based on Arcgis for javascript_javascript skills
Implementing the effect of Baidu map ABCD marker based on Arcgis for javascript_javascript skills
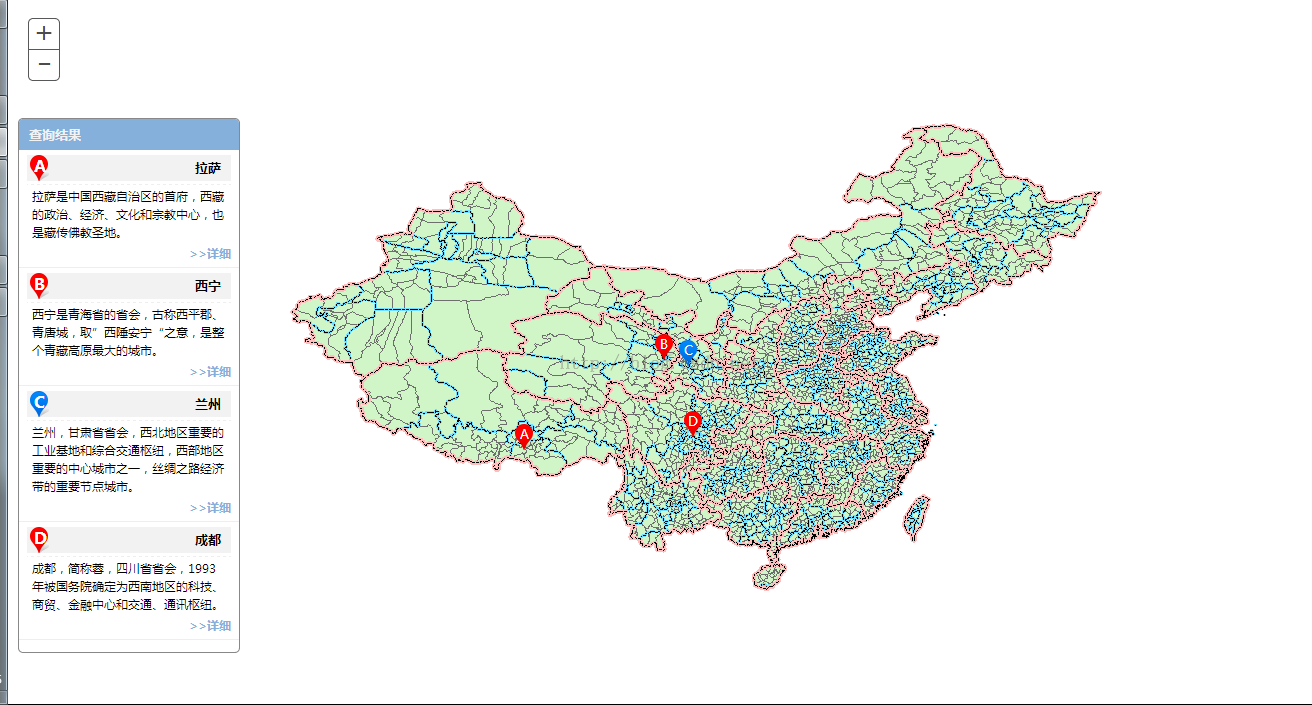
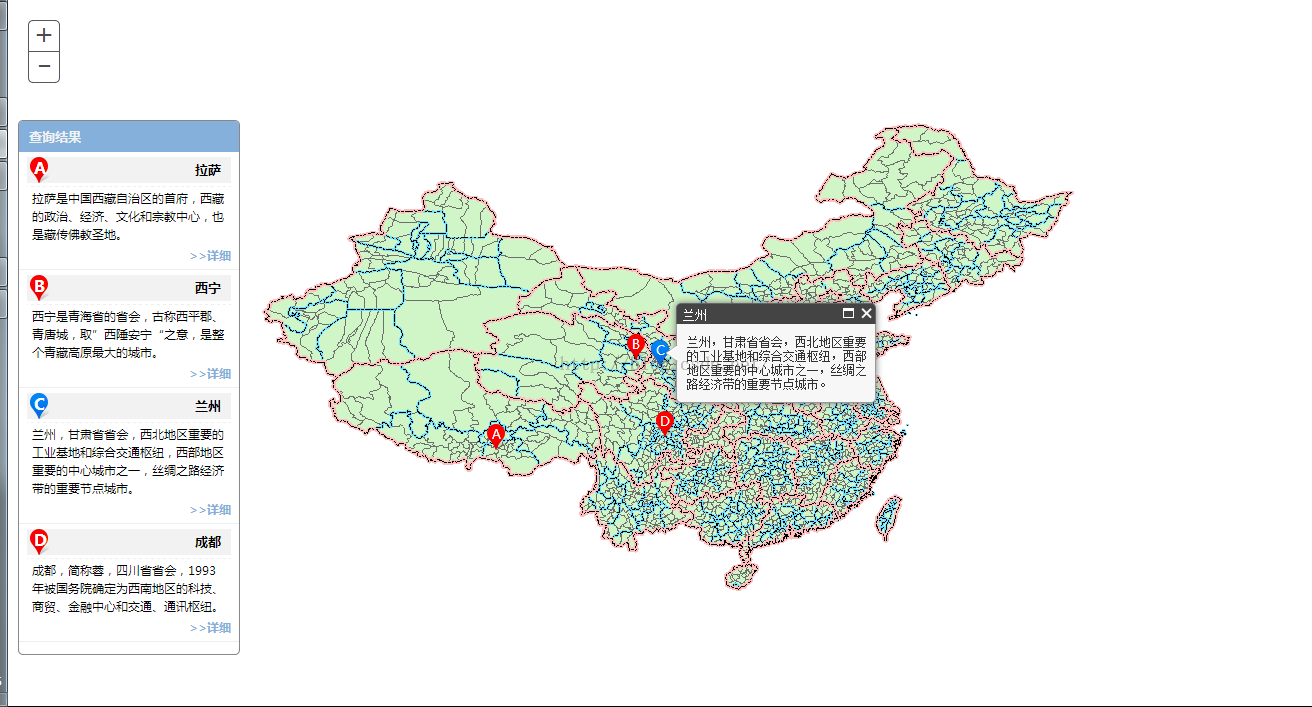
Let me show you the effect after implementation:
For the sake of visualization, I will post the effect I made first

List display, map display and linkage

Show information
Implementation ideas:
1. Interaction between list and map
When the mouse passes over the list, the list icon is modified and a blue marker is drawn on the map based on the value returned by the list; when the mouse is moved out, the list icon is modified to red and the map marker layer is cleared.
Key code:
title.on("mouseover",function(){
 var attr = $(this).data("attr");
 $("#icon"+attr.id).css("background","url('images/blue.png')");
 var pt=new Point(attr.x,attr.y,{"wkid":4326});
 var pms = new esri.symbol.PictureMarkerSymbol("images/blue.png",24,26)
 var gImg = new Graphic(pt,pms);
 gLyrHover.add(gImg);
});
title.on("mouseout",function(){
 var attr = $(this).data("attr");
 $("#icon"+attr.id).css("background","url('images/red.png')");
 gLyrHover.clear();
});2. Interaction between map and list
When the mouse passes over the red marker on the map, the corresponding list icon is modified and the red marker picture is changed to blue; when the mouse is moved out, the corresponding list icon is modified and the marker is changed to red.
Key code:
gLyr.on("mouse-over",function(e){
 map.setMapCursor("pointer");
 var sms = e.graphic.symbol;
 sms.url = "images/blue.png";
 gLyr.redraw();
 $("#icon"+e.graphic.attributes.id).css("background","url('images/blue.png')");
});
gLyr.on("mouse-out",function(e){
 map.setMapCursor("default");
 var sms = e.graphic.symbol;
 sms.url = "images/red.png";
 gLyr.redraw();
 $("#icon"+e.graphic.attributes.id).css("background","url('images/red.png')");
}); 3. The ABCD text on the map is a separate layer and does not participate in interaction.
4. The data exists in JSON form.
var data = [
 {
 "id":"A","name":"拉萨", "x":91.162998, "y":29.71042,
 "desc":"拉萨是中国西藏自治区的首府,西藏的政治、经济、文化和宗教中心,也是藏传佛教圣地。"
 },
 {
 "id":"B", "name":"西宁","x":101.797303,"y":36.593642,
 "desc":"西宁是青海省的省会,古称西平郡、青唐城,取”西陲安宁“之意,是整个青藏高原最大的城市。"
 },
 {
 "id":"C","name":"兰州","x":103.584297,"y":36.119086,
 "desc":"兰州,甘肃省省会,西北地区重要的工业基地和综合交通枢纽,西部地区重要的中心城市之一,丝绸之路经济带的重要节点城市。"
 },
 {
 "id":"D","name":"成都","x":104.035508,"y":30.714179,
 "desc":"成都,简称蓉,四川省省会,1993年被国务院确定为西南地区的科技、商贸、金融中心和交通、通讯枢纽。"
 }
];Full code:
<!DOCTYPE html>
<html>
<head>
 <meta http-equiv="Content-Type" content="text/html; charset=utf-8">
 <meta name="viewport" content="initial-scale=1, maximum-scale=1,user-scalable=no"/>
 <title></title>
 <link rel="stylesheet" href="http://localhost/arcgis_js_api/library/3.9/3.9/js/esri/css/esri.css">
 <style type="text/css">
 html, body, #map {
  height: 100%;
  margin: 0;
  padding: 0;
  font-size: 62.5%;
  font-family:"微软雅黑";
 }
 .search-box{
  z-index: 99;
  background: #fff;
  border: 1px solid #888888;
  border-radius: 5px;
  width: 220px;
  max-height:600px;
  overflow-y: auto;
  position: absolute;
  top: 120px;
  left: 10px;
 }
 .search-box-title{
  padding: 6px 10px;
  text-align: left;
  font-size: 13px;
  font-weight: bold;
  color: #f2f2f2;
  background: #85b0db;
 }
 .search-box-result{
  list-style: none;
  margin-left:-40px;
  margin-top: 0px;
 }
 .search-box-result-item{
  border-bottom: 1px solid #eeeeee;
  padding: 5px 8px;
 }
 .search-name{
  float: right;
  font-weight: bold;
  font-size: 13px;
  margin-top: 3px;
  margin-right: 10px;
 }
 .search-name-title{
  background: #f2f2f2;
 }
 .search-name-title:hover{
  cursor: pointer;
 }
 .search-detail{
  border-top: 1px dashed #eeeeee;
  margin-top: 3px;
  padding: 3px 5px;
  line-height: 18px;
 }
 .search-icon{
  background: url("images/red.png");
  width: 24px;
  height: 26px;
  background-repeat: no-repeat;
 }
 .search-text{
  color: #ffffff;
  font-weight: bold;
  font-size: 16px;
  margin-left:7px ;
 }
 .detail{
  color: #85b0db;
  font-weight: bold;
  text-align: right;
 }
 .detail:hover{
  cursor: pointer;
 }
 </style>
 <script src="http://localhost/arcgis_js_api/library/3.9/3.9/init.js"></script>
 <script src="jquery-1.8.3.js"></script>
 <script type="text/javascript">
 var map;
 var data = [
  {
  "id":"A","name":"拉萨", "x":91.162998, "y":29.71042,
  "desc":"拉萨是中国西藏自治区的首府,西藏的政治、经济、文化和宗教中心,也是藏传佛教圣地。"
  },
  {
  "id":"B", "name":"西宁","x":101.797303,"y":36.593642,
  "desc":"西宁是青海省的省会,古称西平郡、青唐城,取”西陲安宁“之意,是整个青藏高原最大的城市。"
  },
  {
  "id":"C","name":"兰州","x":103.584297,"y":36.119086,
  "desc":"兰州,甘肃省省会,西北地区重要的工业基地和综合交通枢纽,西部地区重要的中心城市之一,丝绸之路经济带的重要节点城市。"
  },
  {
  "id":"D","name":"成都","x":104.035508,"y":30.714179,
  "desc":"成都,简称蓉,四川省省会,1993年被国务院确定为西南地区的科技、商贸、金融中心和交通、通讯枢纽。"
  }
 ];
 require([
   "esri/map",
   "esri/layers/ArcGISTiledMapServiceLayer",
   "esri/geometry/Point",
   "esri/layers/GraphicsLayer",
   "esri/graphic",
   "dojo/_base/Color",
   "dojo/domReady!"],
  function(Map,
    Tiled,
    Point,
    GraphicsLayer,
    Graphic,
    Color)
  {
   map = new Map("map",{logo:false});
   var tiled = new Tiled("http://localhost:6080/arcgis/rest/services/china/MapServer",{"id":"tiled"});
   map.addLayer(tiled);
   var mapCenter = new Point(103.847, 36.0473, {"wkid":4326});
   map.centerAndZoom(mapCenter,0);
   var gLyr = new GraphicsLayer({"id":"gLyr"});
   map.addLayer(gLyr);
   var gLyrHover = new GraphicsLayer({"id":"gLyrHover"});
   map.addLayer(gLyrHover);
   var gLyrLbl = new GraphicsLayer({"id":"gLyrLbl"});
   map.addLayer(gLyrLbl);
   map.on("load",function(){
   $("#search").show();
   for(var i=0;i<data.length;i++){
    var li = $("<li />").addClass("search-box-result-item").appendTo($("#result"));
    var name = $("<div />").addClass("search-name").html(data[i].name);
    var icon = $("<div />").addClass("search-icon")
     .attr("id","icon"+data[i].id)
     .append("<div class='search-text'>"+data[i].id+"</div>");
    var title = $("<div />").addClass("search-name-title")
     .append(name).append(icon).appendTo(li)
     .data("attr",data[i]);
    var desc = $("<div />").addClass("search-detail").html(data[i].desc).appendTo(li);
    var more = $("<div />").addClass("detail").appendTo(li).html(">>详细");
    title.on("mouseover",function(){
    var attr = $(this).data("attr");
    $("#icon"+attr.id).css("background","url('images/blue.png')");
    var pt=new Point(attr.x,attr.y,{"wkid":4326});
    var pms = new esri.symbol.PictureMarkerSymbol("images/blue.png",24,26)
    var gImg = new Graphic(pt,pms);
    gLyrHover.add(gImg);
    });
    title.on("mouseout",function(){
    var attr = $(this).data("attr");
    $("#icon"+attr.id).css("background","url('images/red.png')");
    gLyrHover.clear();
    });
    title.on("click",function(){
    var attr = $(this).data("attr");
    showCity(attr);
    });
    var pt=new Point(data[i].x,data[i].y,{"wkid":4326});
    var pms = new esri.symbol.PictureMarkerSymbol("images/red.png",24,26)
    var gImg = new Graphic(pt,pms,data[i]);
    gLyr.add(gImg);
    var font = new esri.symbol.Font();
    font.setSize("10pt");
    font.setFamily("微软雅黑");
    var text = new esri.symbol.TextSymbol(data[i].id);
    text.setOffset(0,-2);
    text.setFont(font);
    text.setColor(new dojo.Color([255,255,255,100]));
    var gLbl = new esri.Graphic(pt,text,data[i]);
    gLyrLbl.add(gLbl);
   }
   gLyr.on("mouse-over",function(e){
    map.setMapCursor("pointer");
    var sms = e.graphic.symbol;
    sms.url = "images/blue.png";
    gLyr.redraw();
    $("#icon"+e.graphic.attributes.id).css("background","url('images/blue.png')");
   });
   gLyr.on("mouse-out",function(e){
    map.setMapCursor("default");
    var sms = e.graphic.symbol;
    sms.url = "images/red.png";
    gLyr.redraw();
    $("#icon"+e.graphic.attributes.id).css("background","url('images/red.png')");
   });
   gLyr.on("click",function(e){
    var attr = e.graphic.attributes;
    showCity(attr);
   });
   });

   function showCity(attr){
   var pt=new Point(attr.x,attr.y,{"wkid":4326});
   map.infoWindow.setTitle(attr.name);
   map.infoWindow.setContent(attr.desc);
   map.infoWindow.resize(200,80);
   map.infoWindow.show(pt);
   map.centerAndZoom(pt,0);
   }
  });
 </script>
</head>
<body>
<div id="search" class="search-box" style="display: none;">
 <div class="search-box-title">查询结果</div>
 <ul class="search-box-result" id="result">
 </ul>
</div>
<div id="map">
</div>
</body>
</html> The above content is the effect of realizing Baidu map ABCD marker based on Arcgis for javascript shared by the editor of Script House. I hope you like it.

Hot AI Tools

Undresser.AI Undress
AI-powered app for creating realistic nude photos

AI Clothes Remover
Online AI tool for removing clothes from photos.

Undress AI Tool
Undress images for free

Clothoff.io
AI clothes remover

AI Hentai Generator
Generate AI Hentai for free.

Hot Article

Hot Tools

Notepad++7.3.1
Easy-to-use and free code editor

SublimeText3 Chinese version
Chinese version, very easy to use

Zend Studio 13.0.1
Powerful PHP integrated development environment

Dreamweaver CS6
Visual web development tools

SublimeText3 Mac version
God-level code editing software (SublimeText3)

Hot Topics
 1376
1376
 52
52
 Replace String Characters in JavaScript
Mar 11, 2025 am 12:07 AM
Detailed explanation of JavaScript string replacement method and FAQ This article will explore two ways to replace string characters in JavaScript: internal JavaScript code and internal HTML for web pages. Replace string inside JavaScript code The most direct way is to use the replace() method: str = str.replace("find","replace"); This method replaces only the first match. To replace all matches, use a regular expression and add the global flag g: str = str.replace(/fi
 How do I create and publish my own JavaScript libraries?
Mar 18, 2025 pm 03:12 PM
Article discusses creating, publishing, and maintaining JavaScript libraries, focusing on planning, development, testing, documentation, and promotion strategies.
 How do I optimize JavaScript code for performance in the browser?
Mar 18, 2025 pm 03:14 PM
The article discusses strategies for optimizing JavaScript performance in browsers, focusing on reducing execution time and minimizing impact on page load speed.
 How do I debug JavaScript code effectively using browser developer tools?
Mar 18, 2025 pm 03:16 PM
The article discusses effective JavaScript debugging using browser developer tools, focusing on setting breakpoints, using the console, and analyzing performance.
 10 Ways to Instantly Increase Your jQuery Performance
Mar 11, 2025 am 12:15 AM
This article outlines ten simple steps to significantly boost your script's performance. These techniques are straightforward and applicable to all skill levels. Stay Updated: Utilize a package manager like NPM with a bundler such as Vite to ensure
 Using Passport With Sequelize and MySQL
Mar 11, 2025 am 11:04 AM
Sequelize is a promise-based Node.js ORM. It can be used with PostgreSQL, MySQL, MariaDB, SQLite, and MSSQL. In this tutorial, we will be implementing authentication for users of a web app. And we will use Passport, the popular authentication middlew
 How to Build a Simple jQuery Slider
Mar 11, 2025 am 12:19 AM
This article will guide you to create a simple picture carousel using the jQuery library. We will use the bxSlider library, which is built on jQuery and provides many configuration options to set up the carousel. Nowadays, picture carousel has become a must-have feature on the website - one picture is better than a thousand words! After deciding to use the picture carousel, the next question is how to create it. First, you need to collect high-quality, high-resolution pictures. Next, you need to create a picture carousel using HTML and some JavaScript code. There are many libraries on the web that can help you create carousels in different ways. We will use the open source bxSlider library. The bxSlider library supports responsive design, so the carousel built with this library can be adapted to any
 How do I use source maps to debug minified JavaScript code?
Mar 18, 2025 pm 03:17 PM
The article explains how to use source maps to debug minified JavaScript by mapping it back to the original code. It discusses enabling source maps, setting breakpoints, and using tools like Chrome DevTools and Webpack.


