How to use vue to implement a column chart: 1. Create a div attribute as "
"; 2. Pass "mounted(){this.fetchData()window.addEventListener('resize',()=>{if (this.chart){...}" Just implement a three-dimensional histogram.

The operating environment of this tutorial: Windows 10 system, vue3 version, DELL G3 computer
How to use vue to implement a column chart?
vue implements a three-dimensional histogram
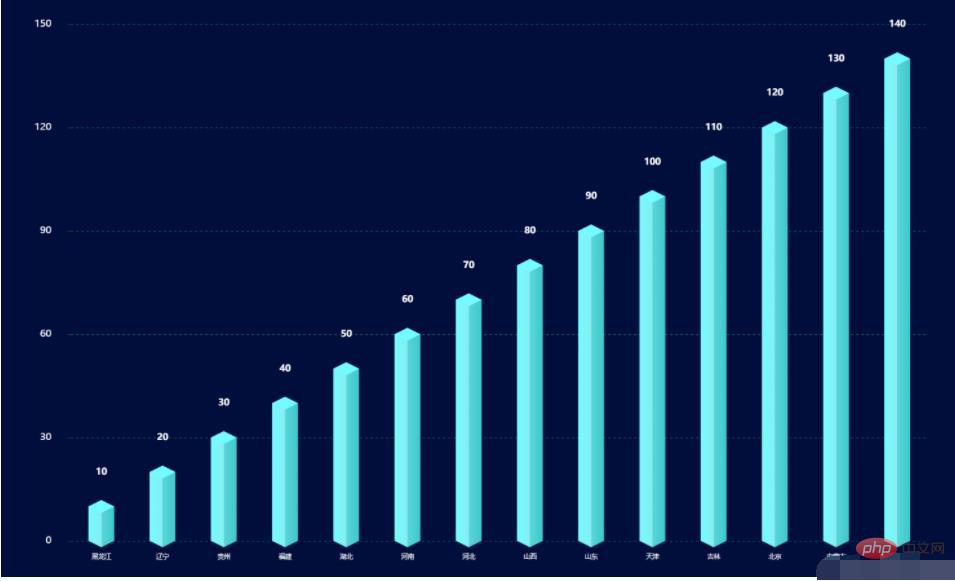
The style is as shown in the figure below:
The three-dimensional histogram can be regarded as the bottom and top of yData The composition, the corresponding code is as follows:
<template>
  <div></div></template>
<script>import echarts from 'echarts'export default {
data() {
return {
chart: null,
data: [], //数据
xData: [], //x轴
yBarData: [], //y轴
yLable: [],
colorStops: [],
chartLegend: [], //图例
colorOptions: [ //图例以及柱形图颜色选择
'#5ba2e4',
'#f58510',
'#afa5a5',
'#facb3d',
'#0854cf',
'#48c611',
'#082b63'
]
}
},
mounted() {
this.fetchData()
//图的大小自适应
window.addEventListener('resize',()=>{
if (this.chart){
this.chart.resize()
}
})
},
beforeDestroy() { //实例销毁之前调用
if (!this.chart) {
return
}
this.chart.dispose()
this.chart = null
},
methods: {
fetchData() {
this.xData = ["黑龙江",'辽宁','贵州','福建','湖北','河南','河北','山西','山东','天津','吉林','北京','内蒙古','云南']
this.yLable = ['10','20','30','40','50','60','70','80','90','100','110','120','130','140']
this.chartLegend = []
const dateArr = []
this.yLable.forEach((item, index) => {
if (item !== null && item !== undefined) {
dateArr.push(this.yLable[index])
}
})
this.chartLegend = dateArr this.initData()
this.initChart()
},
initData() {
this.yBarData = this.yLable },
initChart() {
this.chart = echarts.init(this.$refs.BarChart)
this.chart.clear() // 清空当前实例
let colors = []
const dom = 800
const barWidth = dom / 20
for (let i = 0; i < 4; i++) {
colors.push({
colorStops: [
{
offset: 0,
color: '#73fcff' // 最左边
}, {
offset: 0.5,
color: '#86eef1' // 左边的右边 颜色
}, {
offset: 0.5,
color: '#5ad6d9' // 右边的左边 颜色
}, {
offset: 1,
color: '#3dc8ca'
}]
})
}
this.chart.setOption({
backgroundColor: '#010d3a',
//提示框
tooltip: {
trigger: 'axis',
formatter: "{b} : {c}",
axisPointer: { // 坐标轴指示器,坐标轴触发有效
type: 'shadow' // 默认为直线,可选为:'line' | 'shadow'
}
},
/**区域位置*/
grid: {
left: '10%',
right: '10%',
top: '10%',
bottom: '10%',
},
//X轴
xAxis: [{
data: this.xData,
type: 'category',
show: true,
axisLine: {
show: false,
lineStyle: {
color: 'rgba(255,255,255,1)',
shadowColor: 'rgba(255,255,255,1)',
// shadowOffsetX: '20'
},
symbol: ['none', 'arrow'],
symbolOffset: [0, 25]
},
splitLine: {
show: false
},
axisTick: {
show: false
},
axisLabel: {
margin: 20,
fontSize: 10
}
}],
yAxis: {
show: true,
splitNumber: 4,
axisLine: {
show: false
},
splitLine: {
show: true,
lineStyle: {
type: 'dashed',
color: '#075858'
},
},
axisLabel: {
show: true,
color: '#FFFFFF',
margin: 30,
fontSize: 15
}
},
series: [
{//数据颜色
name: '日付费用户数',
type: 'bar',
barWidth: barWidth,
itemStyle: {
normal: {
color: (params) => {
return colors[params.dataIndex % 4];
}
}
},
label: {
show: true,
position: [barWidth / 2, -(barWidth + 20)],
color: '#ffffff',
fontSize: 14,
fontStyle: 'bold',
align: 'center'
},
data: this.yBarData },
{//底
z: 2,
type: 'pictorialBar',
data: this.yBarData,
symbol: 'diamond',
symbolOffset: [0, '50%'],
symbolSize: [barWidth, barWidth * 0.5],
itemStyle: {
normal: {
color: (params) => {
return colors[params.dataIndex % 4]
}
}
}
},
{//顶
z: 3,
type: 'pictorialBar',
symbolPosition: 'end',
data: this.yBarData,
symbol: 'diamond',
symbolOffset: [0, '-50%'],
symbolSize: [barWidth, barWidth * 0.5],
itemStyle: {
normal: {
borderWidth: 0,
color: (params) => {
return colors[params.dataIndex % 4].colorStops[0].color;
}
}
}
}
]
}, true)
}
}}</script>In the above js code, there are the following precautions:
colors[params.dataIndex % 4]Replace with this.colorOptions[params.dataIndex % 4], that is, use the colorOptions defined in the code for color fillingcolors[params.dataIndex % 4]The selection of 4 in is variable, ensuring that the index value is within the length range of the colors variable. For example: in this example, the length of colors is 4, params. dataIndex % 4can be no more than 4To quote the above barchart, the following code can be applied:
<template>
  <bar-chart></bar-chart></template>
<script>import barChart from "./components/barChart"export default {
name: 'barchart',
components: { barChart }}</script>Recommended learning: "vue video tutorial》
The above is the detailed content of How to use vue to implement column chart. For more information, please follow other related articles on the PHP Chinese website!


