what is go pprof
pprof is Go's performance analysis tool. During the running process of the program, it can record the running information of the program, which can be CPU usage, memory usage, goroutine running status, etc. When performance tuning or bug location is required, At times, these recorded information are quite important. There are many ways to use pprof. Go has already packaged a "net/http/pprof" ready-made. With a few simple lines of commands, you can open pprof, record running information, and provide web services.

The operating environment of this tutorial: Windows 7 system, GO version 1.18, Dell G3 computer.
go pprof introduction
profile is generally called performance analysis. The translation in the dictionary is an overview (noun) or an overview that describes... verb). For a computer program, its profile is various general information about a program when it is running, including CPU occupancy, memory, thread status, thread blocking, etc. Knowing this information about the program, you can easily locate problems and causes of failures in the program.
pprof is Go's performance analysis tool. During the running process of the program, it can record the running information of the program, which can be CPU usage, memory usage, goroutine running status, etc. When performance tuning or bug location is required, At times, these recorded information are quite important.
golang has relatively good support for profiling. The standard library provides the profile libraries "runtime/pprof" and "net/http/pprof", and also provides many useful visual tools to assist developers. profiling.
For online services, for an HTTP Server, access the HTTP interface provided by pprof to obtain performance data. Of course, in fact, the bottom layer here is also called the function provided by runtime/pprof, which is encapsulated into an interface to provide external network access. This article mainly introduces the use of "net/http/pprof".
Basic use
There are many ways to use pprof. Go has already packaged one: net/http/pprof, which is easy to use. With a few lines of commands, you can start pprof, record operating information, and provide a web service that can obtain operating data through the browser and the command line.
How to enable monitoring in web services, let’s look at a simple example.
package main

import (
"fmt"
 "net/http"
 _ "net/http/pprof"
)

func main() {
// 开启pprof,监听请求
 ip := "0.0.0.0:8080"
 if err := http.ListenAndServe(ip, nil); err != nil {
 	fmt.Printf("start pprof failed on %s\n", ip)
 }
 dosomething()
}Import the "net/http/pprof" package into the program and open the listening port. At this time, you can obtain the profile of the program. In actual production, we generally encapsulate this function into a goroutine. So how do you check it after opening it? There are three methods:
Browser method
Open a browser and enter ip:port/debug/pprof, Enter.
#pprof will provide a lot of performance data. The specific meaning is:
- allocs: Sampling information on memory allocation
- blocks: Sampling information on blocking operations cmdline: Program startup command and its parameters
- goroutine : Stack information of all current coroutines
- heap: Sampling information of memory usage on the heap mutex: Sampling information of lock contention
- profile: Sampling information of cpu occupancy
- threadcreate: Sampling information about system thread creation
- trace: Tracking information about program running
allocs is the memory allocation of all objects, and heap is the memory allocation of active objects , which will be described in detail later.
1. When CPU performance analysis is enabled, Go runtime will pause every 10ms to record the call stack and related data of the currently running goroutine. After the performance analysis data is saved to the hard disk, we can analyze the hot spots in the code.
2. Memory performance analysis is to record the call stack when the heap is allocated. By default, it is sampled once every 1000 allocations, this value can be changed. Stack allocation will not be recorded by memory analysis because it will be released at any time. Because memory analysis is a sampling method, and also because it records the allocation of memory, not the use of memory. Therefore, it is difficult to use memory performance analysis tools to accurately determine the specific memory usage of a program.
3. Blocking analysis is a very unique analysis. It is somewhat similar to CPU performance analysis, but what it records is the time spent by goroutine waiting for resources. Blocking analysis is very helpful in analyzing program concurrency bottlenecks. Blocking performance analysis can show when a large number of goroutines are blocked. Blocking performance analysis is a special analysis tool and should not be used for analysis before CPU and memory bottlenecks have been eliminated.
Of course, if you click on any link, you will find that it is poorly readable and almost impossible to analyze. As shown in the picture:

Click on the heap and scroll to the bottom. You can see some interesting data. Sometimes it may be helpful for troubleshooting, but it is generally not used.
heap profile: 3190: 77516056 [54762: 612664248] @ heap/1048576
1: 29081600 [1: 29081600] @ 0x89368e 0x894cd9 0x8a5a9d 0x8a9b7c 0x8af578 0x8b4441 0x8b4c6d 0x8b8504 0x8b2bc3 0x45b1c1
#    0x89368d    github.com/syndtr/goleveldb/leveldb/memdb.(*DB).Put+0x59d
#    0x894cd8    xxxxx/storage/internal/memtable.(*MemTable).Set+0x88
#    0x8a5a9c    xxxxx/storage.(*snapshotter).AppendCommitLog+0x1cc
#    0x8a9b7b    xxxxx/storage.(*store).Update+0x26b
#    0x8af577    xxxxx/config.(*config).Update+0xa7
#    0x8b4440    xxxxx/naming.(*naming).update+0x120
#    0x8b4c6c    xxxxx/naming.(*naming).instanceTimeout+0x27c
#    0x8b8503    xxxxx/naming.(*naming).(xxxxx/naming.instanceTimeout)-fm+0x63

......

# runtime.MemStats
# Alloc = 2463648064
# TotalAlloc = 31707239480
# Sys = 4831318840
# Lookups = 2690464
# Mallocs = 274619648
# Frees = 262711312
# HeapAlloc = 2463648064
# HeapSys = 3877830656
# HeapIdle = 854990848
# HeapInuse = 3022839808
# HeapReleased = 0
# HeapObjects = 11908336
# Stack = 655949824 / 655949824
# MSpan = 63329432 / 72040448
# MCache = 38400 / 49152
# BuckHashSys = 1706593
# GCSys = 170819584
# OtherSys = 52922583
# NextGC = 3570699312
# PauseNs = [1052815 217503 208124 233034 ......]
# NumGC = 31
# DebugGC = false
- Sys: 进程从系统获得的内存空间,虚拟地址空间
- HeapAlloc:进程堆内存分配使用的空间,通常是用户new出来的堆对象,包含未被gc掉的。
- HeapSys:进程从系统获得的堆内存,因为golang底层使用TCmalloc机制,会缓存一部分堆内存,虚拟地址空间
- PauseNs:记录每次gc暂停的时间(纳秒),最多记录256个最新记录。
- NumGC: 记录gc发生的次数
命令行方式
除了浏览器,Go还提供了命令行的方式,能够获取以上信息,这种方式用起来更方便。
使用命令go tool pprof url可以获取指定的profile文件,此命令会发起http请求,然后下载数据到本地,之后进入交互式模式,就像gdb一样,可以使用命令查看运行信息,以下为使用示例:
# 下载cpu profile,默认从当前开始收集30s的cpu使用情况,需要等待30s
go tool pprof http://localhost:8080/debug/pprof/profile # 30-second CPU profile
go tool pprof http://localhost:8080/debug/pprof/profile?seconds=120 # wait 120s

# 下载heap profile
go tool pprof http://localhost:8080/debug/pprof/heap # heap profile

# 下载goroutine profile
go tool pprof http://localhost:8080/debug/pprof/goroutine # goroutine profile

# 下载block profile
go tool pprof http://localhost:8080/debug/pprof/block # goroutine blocking profile

# 下载mutex profile
go tool pprof http://localhost:8080/debug/pprof/mutex
接下来用一个例子来说明最常用的四个命令:web、top、list、traces。
接下来以内存分析举例,cpu和goroutine等分析同理,读者可以自行举一反三。
首先,我们通过命令go tool pprof url获取指定的profile/heap文件,随后自动进入命令行。如图:

第一步,我们首先输入web命令,这时浏览器会弹出各个函数之间的调用图,以及内存的之间的关系。如图:

这个图的具体读法,可参照:中文文档 或者英文文档 这里不多赘述。只需要了解越红越大的方块,有问题的可能性就越大,代表可能占用了更多的内存,如果在cpu的图中代表消耗了更多cpu资源,以此类推。
接下来 top、list、traces三步走可以看出很多想要的结果。
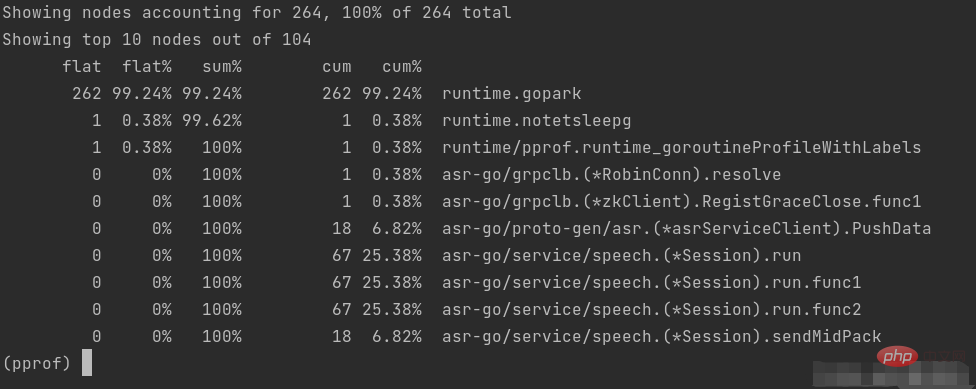
top 按指标大小列出前10个函数,比如内存是按内存占用多少,CPU是按执行时间多少。
top会列出5个统计数据:
- flat: 本函数占用的内存量。
- flat%: 本函数内存占使用中内存总量的百分比。
- sum%: 之前函数flat的累计和。
- cum:是累计量,假如main函数调用了函数f,函数f占用的内存量,也会记进来。
cum%: 是累计量占总量的百分比。

这样我们可以看到到底是具体哪些函数占用了多少内存。
当然top后也可以接参数,top n可以列出前n个函数。
list可以查看某个函数的代码,以及该函数每行代码的指标信息,如果函数名不明确,会进行模糊匹配,比如list main会列出main.main和runtime.main。现在list sendToASR试一下。

可以看到切片中增加元素时,占用了很多内存,左右2个数据分别是flat和cum。
traces 打印所有调用栈,以及调用栈的指标信息。使用方式为traces+函数名(模糊匹配)。

在命令行之中,还有一个重要的参数 -base,假设我们已经通过命令行得到profile1与profile2,使用go tool pprof -base profile1 profile2,便可以以profile1为基础,得出profile2在profile1之上出现了哪些变化。通过两个时间切片的比较,我们可以清晰的了解到,两个时间节点之中发生的变化,方便我们定位问题(很重要!!!!)
可视化界面
打开可视化界面的方式为:go tool pprof -http=:1234 http://localhost:8080/debug/pprof/heap 其中1234是我们指定的端口

Top

该视图与前面所讲解的 top 子命令的作用和含义是一样的,因此不再赘述。
Graph
为函数调用图,不在赘述.
Peek

Compared with the Top view, this view adds the display of contextual information, which is the output of the function. caller/callee.
Source

This view mainly adds tracking and analysis for source code. You can see that its overhead is mainly consumed in where.
Flame Graph

The flame graph corresponding to resource consumption, the reading method of the flame graph, I will not go into details here, it is not the focus of this article .
The second drop-down menu is as shown in the figure:

alloc_objects, alloc_space represents the resources allocated by the application, regardless of whether Not released, inuse_objects,inuse_space indicates the application's resource allocation situation that has not yet been released.
| Name | Meaning |
|---|---|
| amount of memory allocated and not released yet | |
| amount of objects allocated and not released yet | |
| total amount of memory allocated (regardless of released) | |
| total amount of objects allocated (regardless of released) |


