
This article brings you relevant knowledge about PHPSTORM Xdebug. It mainly introduces how to configure and use phpstorm Xdebug. Let’s take a look at it together. I hope it will be helpful to friends in need.
Written in front
Because PHP is born with the advantage of "hot loading", many phpers may rarely use the debug function of php. Anyway, I haven’t used debug for a long, long, long time. It must have been 5 or 6 years in retrospect. . .
But for novice phpers, there is nothing more friendly than debug. After all, when I was getting started with PHP, it accompanied me for many years and made a lot of efforts. It is not an exaggeration to say that it is a great tool for troubleshooting and solving problems.
The following is a brief record of the configuration and use of phpstorm Xdebug, I hope it will be helpful to you!
Brief principle
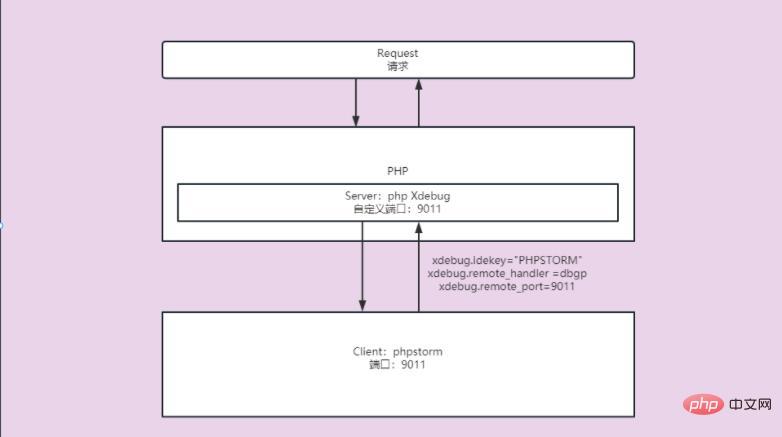
Simple C/S understanding: one client (Client) and one server (Server)
Check the installation
Check and install the Xdebug extension of the current php version. I will not talk about the php extension installation
D:\www\oa2>php -m | find "Xdebug"Xdebug
Configure php.ini debug parameters
[XDebug]zend_extension="php_xdebug.dll"xdebug.idekey="PHPSTORM"xdebug.remote_enable =1xdebug.remote_handler =dbgp
xdebug.remote_host =127.0.0.1xdebug.remote_port=9011xdebug.max_nesting_level=256xdebug.mode=debug,trace
PHPSTORM Settings
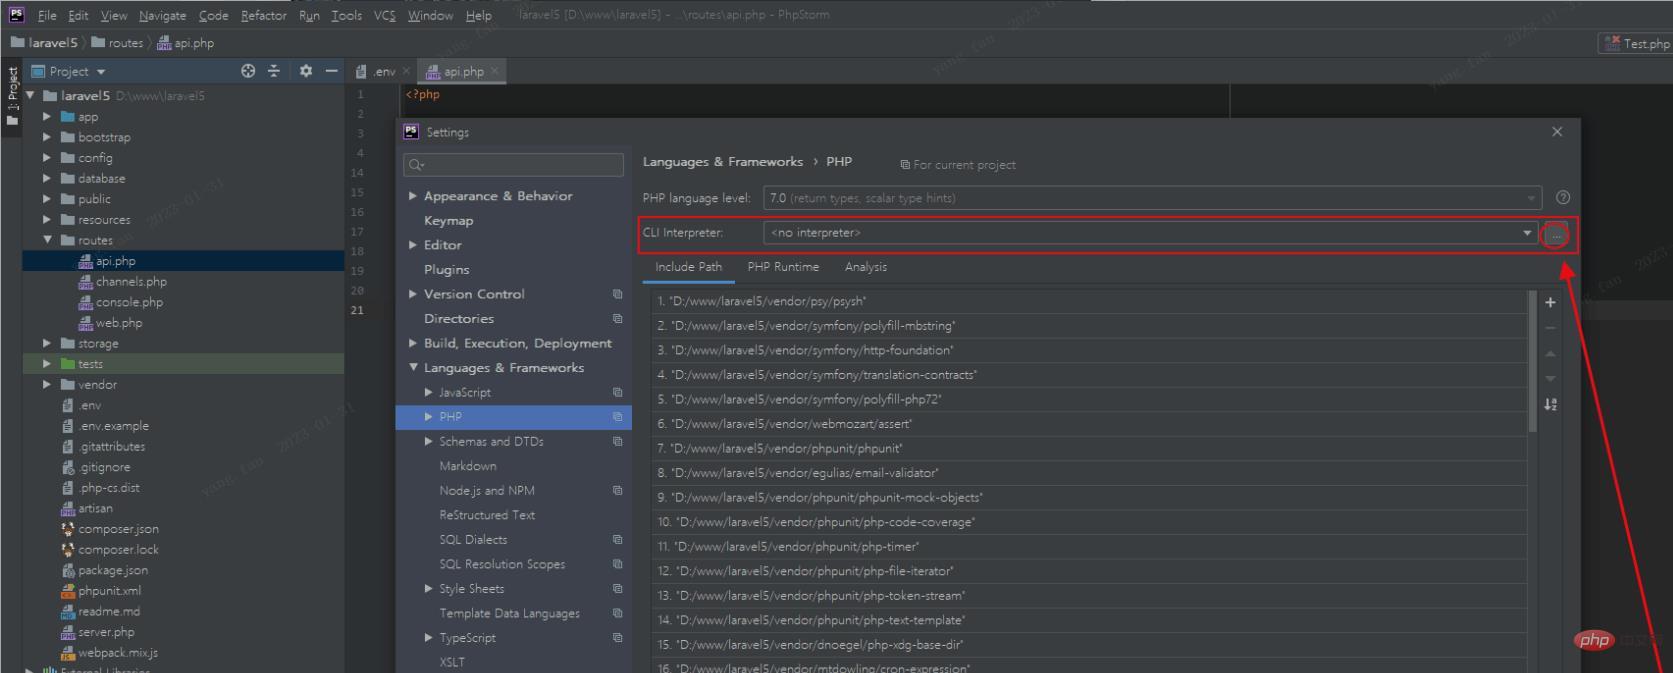
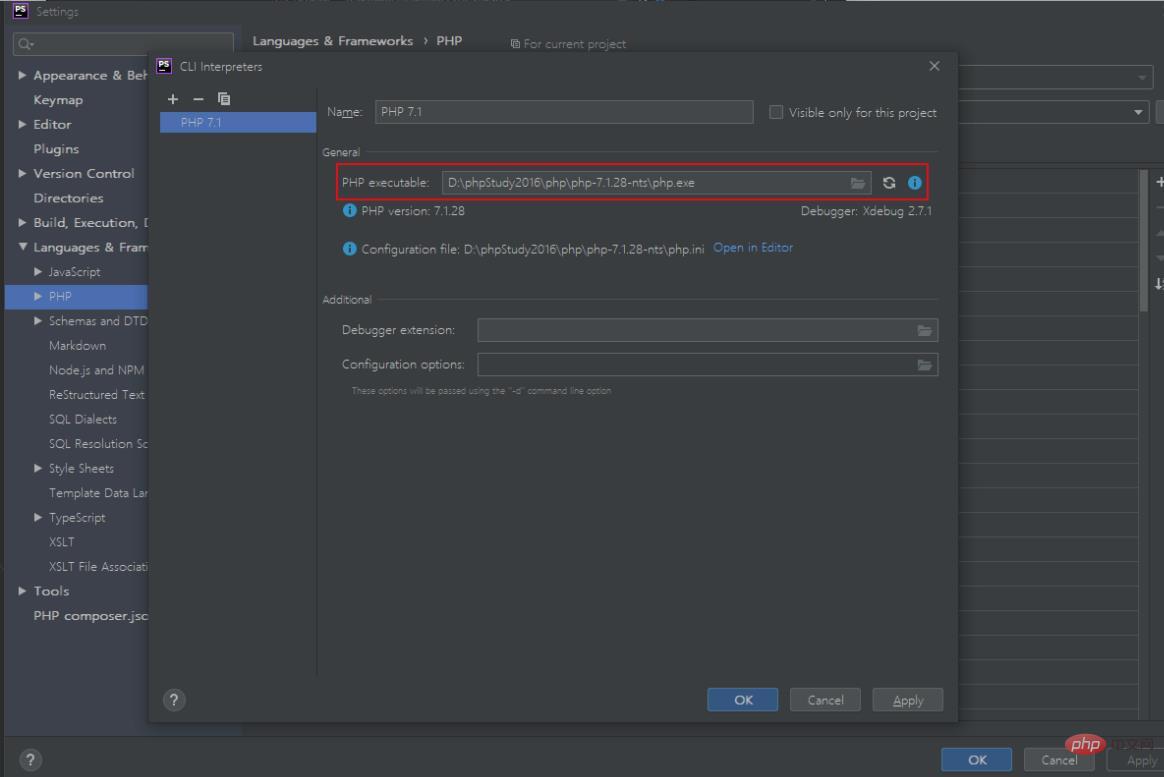
Enter the phpstorm settings menu (Ctrl Alt S), select Languages & Frameworks => PHP, set CLI Interpreters;
Select PHP => Debug, set the debug port, the same as xdebug.remote_port=9011 set in php.ini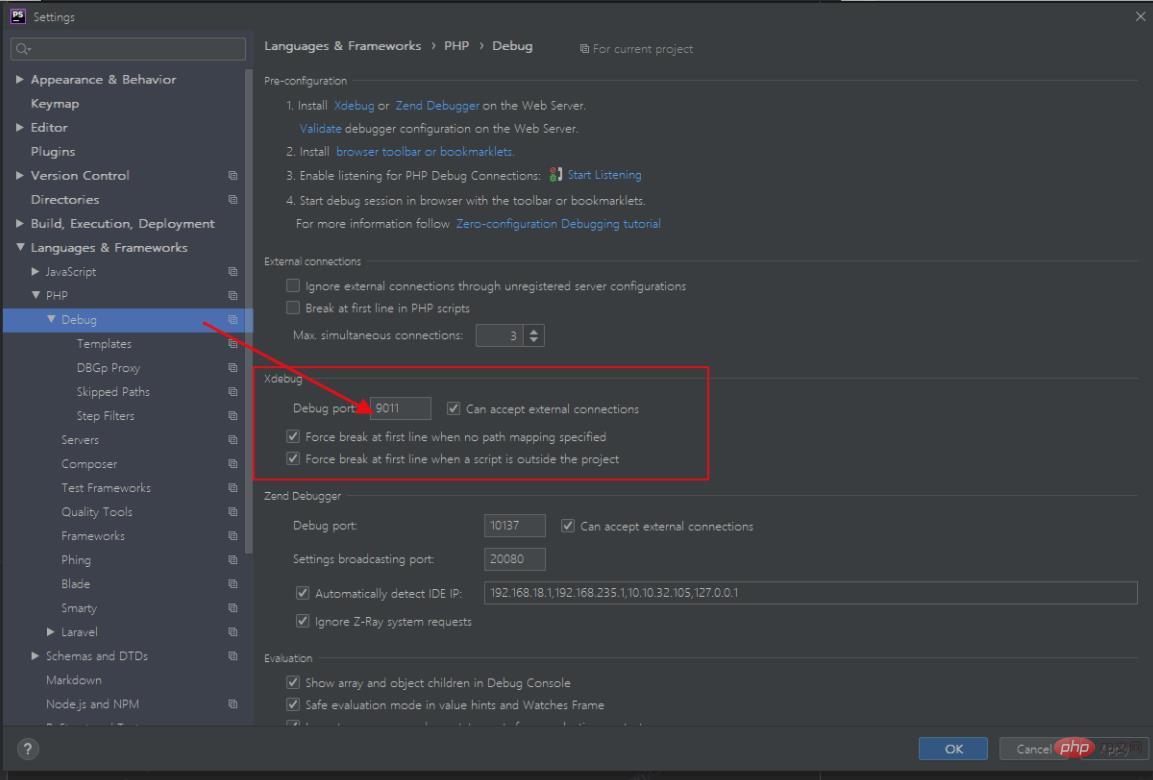
Click the Validate button on the current page to verify whether the configuration is successful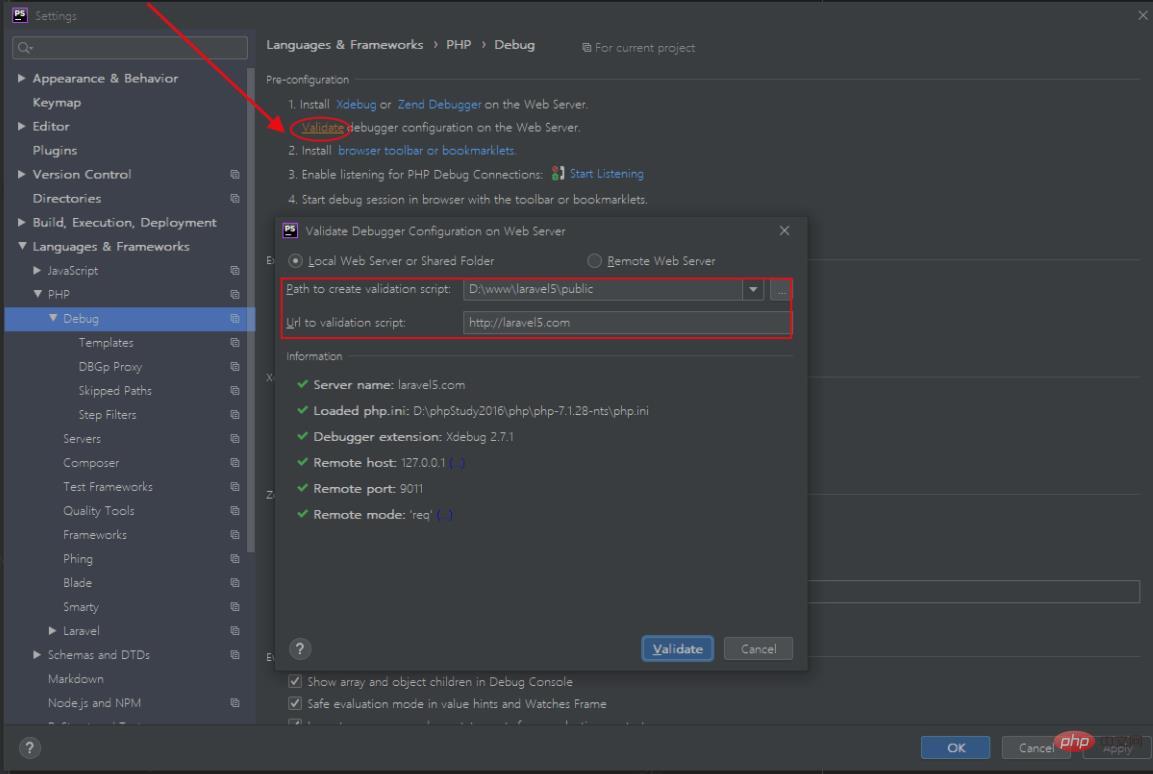
Select PHP => Server, configure the server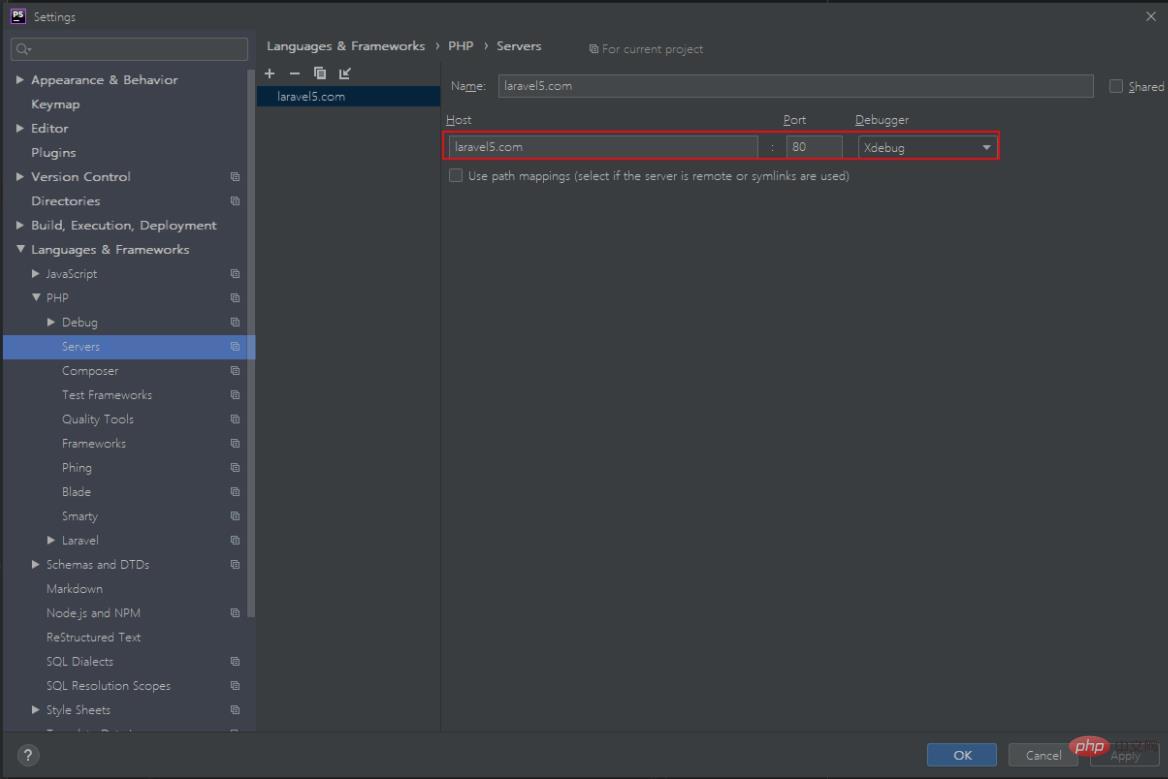
Set Debug Configurations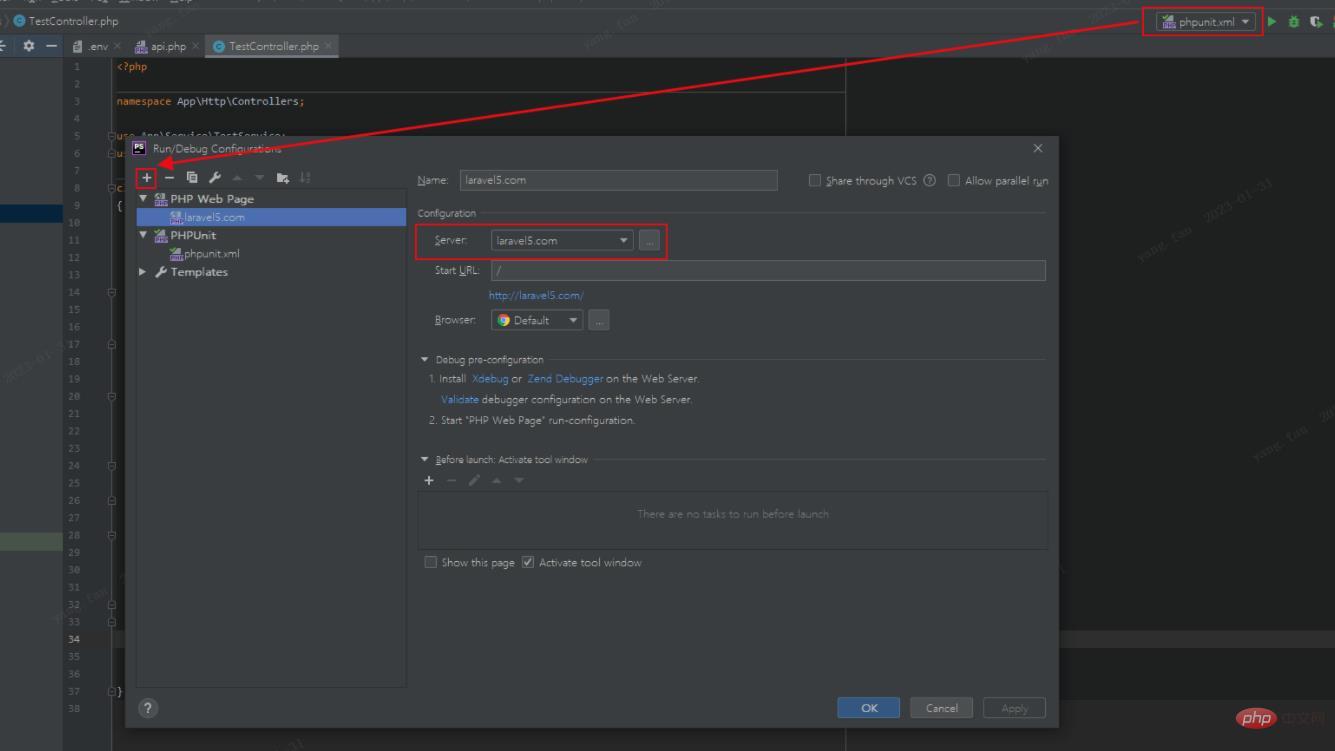
This is basically ok. Finally, write a demo to enable monitoring, edit breakpoints, and try the effect of debugging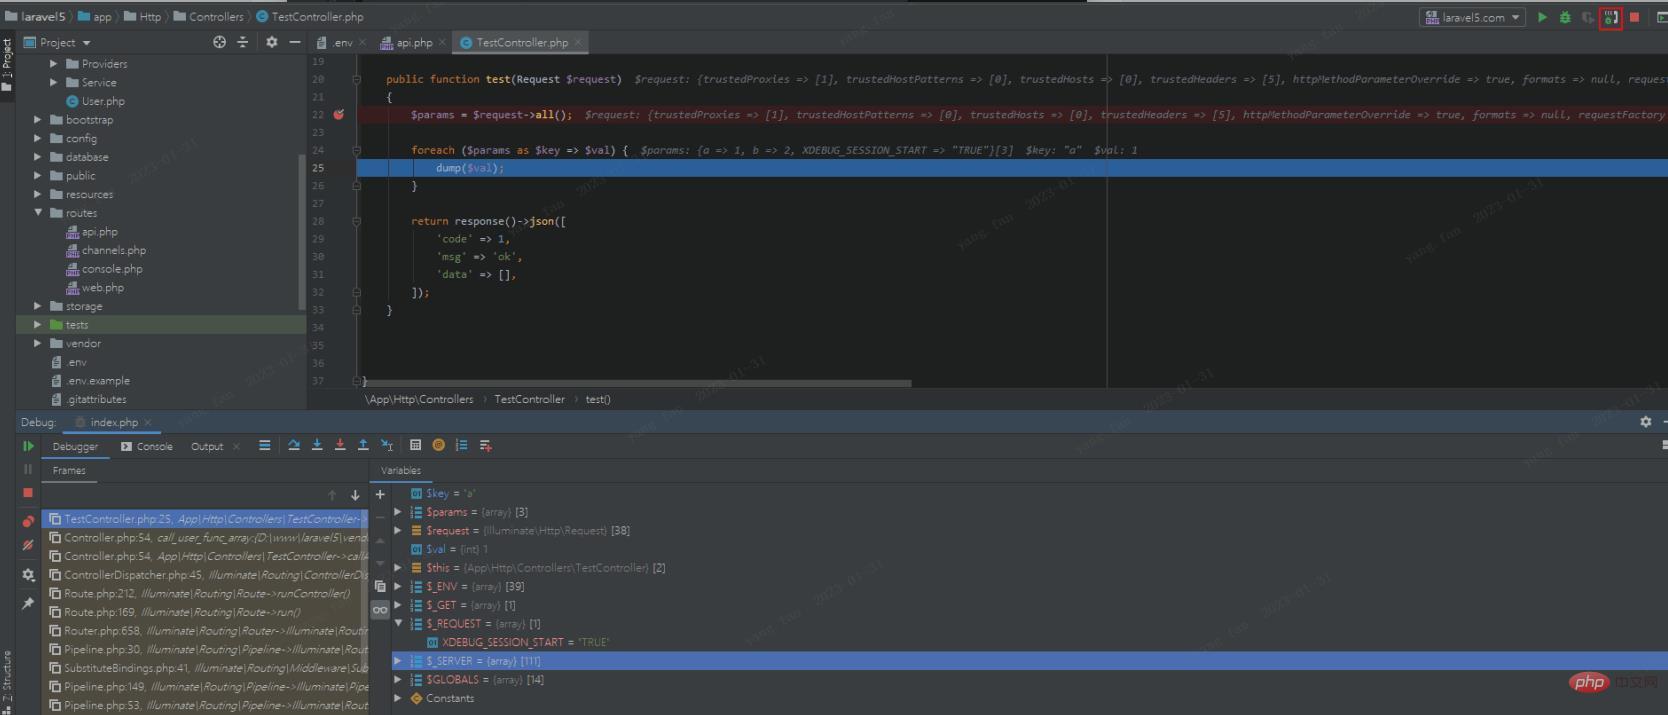
Interface debugging
When using the interface tool to request the API, you need to add parameters: XDEBUG_SESSION_START=TRUE
For example: laravel5.com/api/test? XDEBUG_SESSION=TRUE;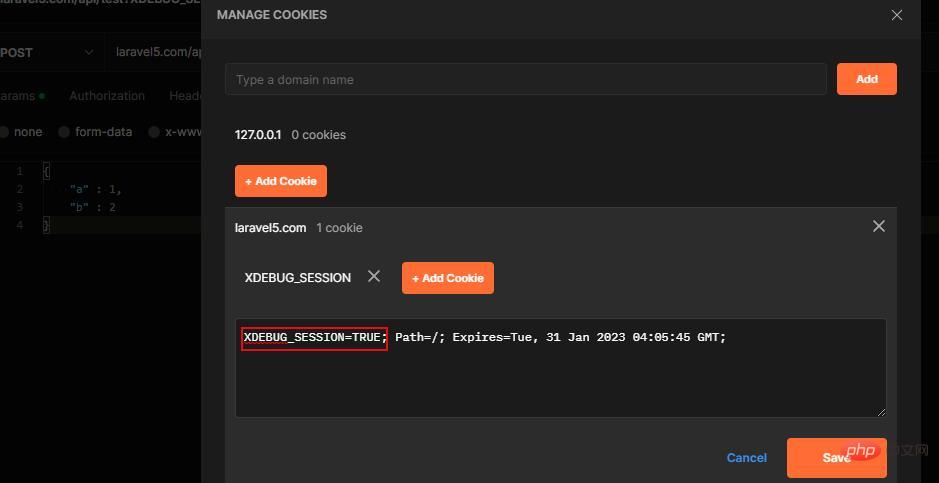
Debugging on the command line is even simpler. In fact, it is to configure a php running script
For example: generate a artisan test script, set breakpoints and run debug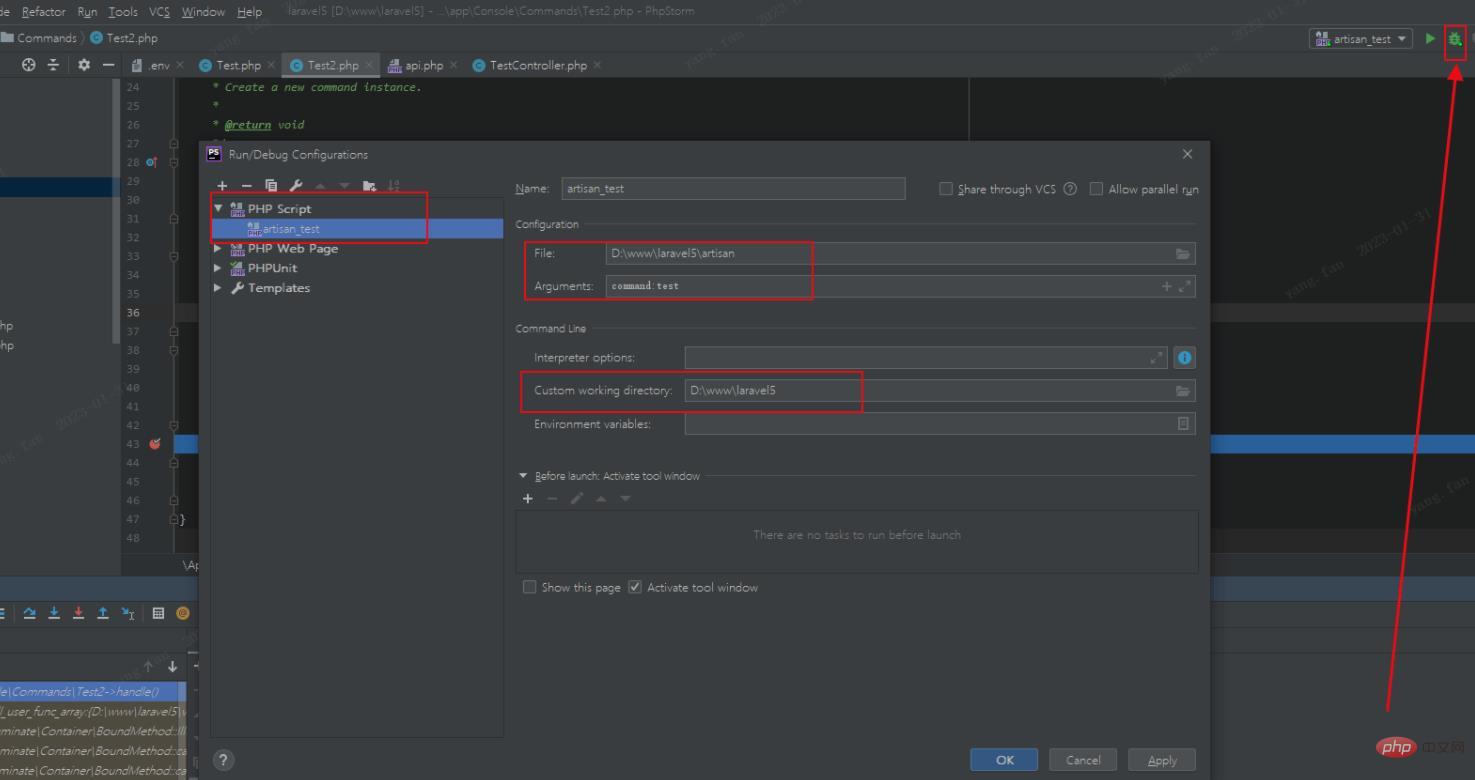
Question
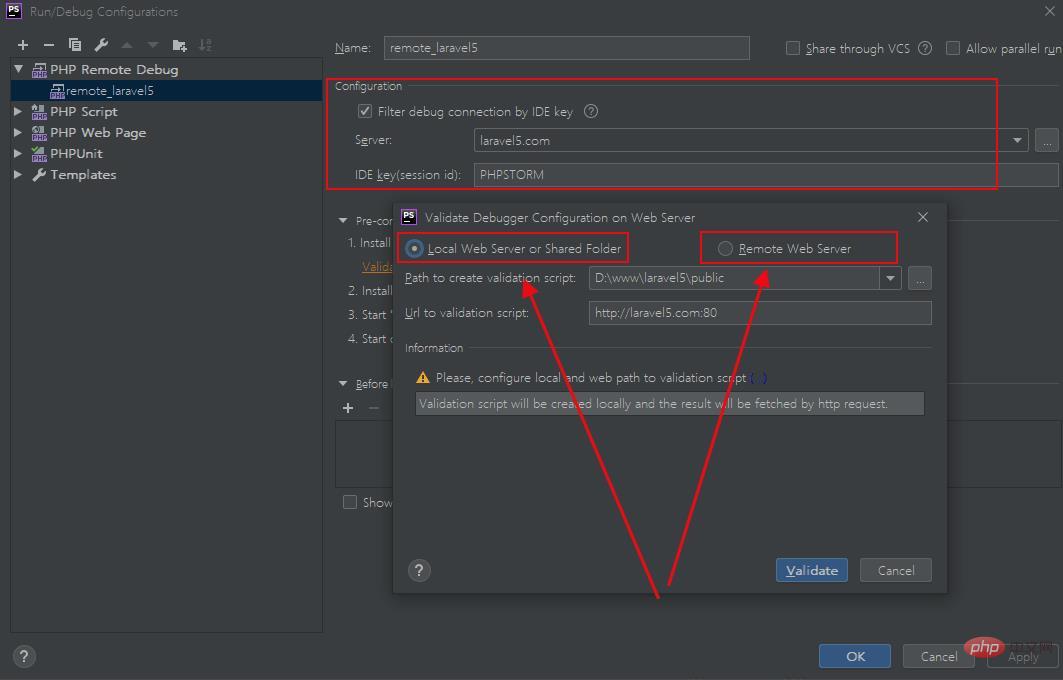
How to configure remote debugging?In the "Settings Debug Configurations" above, I selected "PHP Web Page". You can also select "PHP Remote Debug", which also supports local debugging and remote debugging. This option requires the configuration of an additional IDE Key.
Remote debugging is actually the same, with a little more configuration: mapping of remote code and local code, that’s it! 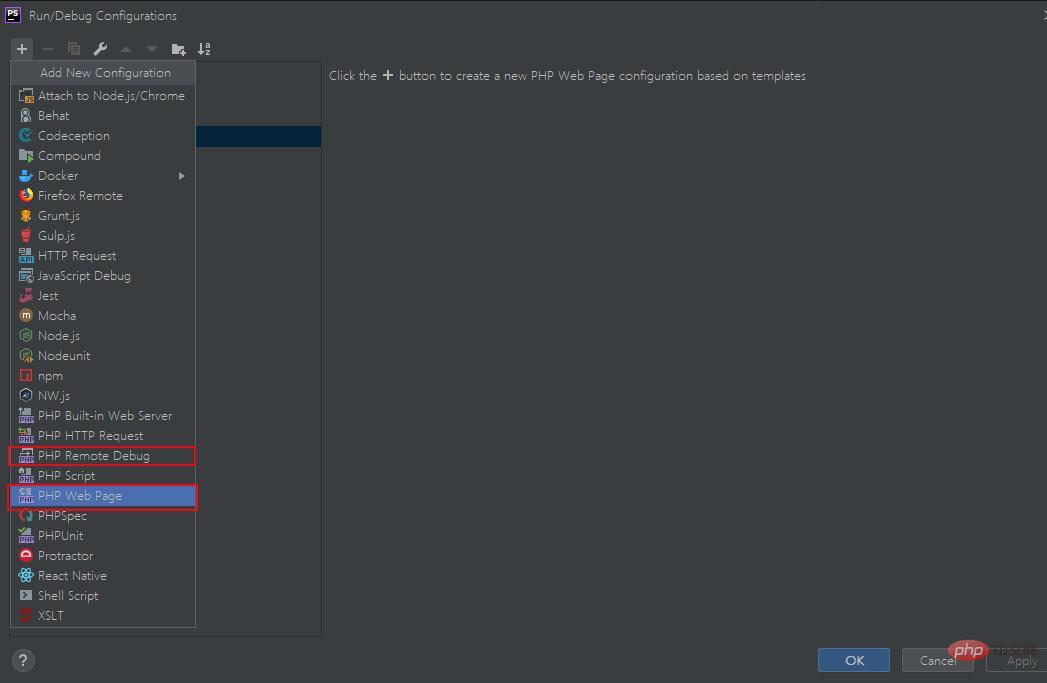
phpstorm usage tutorial"
The above is the detailed content of Detailed graphic explanation of the configuration and use of PHPSTORM Xdebug. For more information, please follow other related articles on the PHP Chinese website!
 How to export project in phpstorm
 Reasons why mobile phone touch screen fails
 Which platform does Tonglian Payment belong to?
 The latest price of eth market
 Introduction to the relationship between php and front-end
 How to unlock android permission restrictions
 How to represent negative numbers in binary
 Data encryption method