
 Web Front-end
Vue.js
Let's talk about the best way to encapsulate echarts in vue3? (detailed code explanation)
Web Front-end
Vue.js
Let's talk about the best way to encapsulate echarts in vue3? (detailed code explanation)
Let's talk about the best way to encapsulate echarts in vue3? (detailed code explanation)

项目中经常用到echarts,不做封装直接拿来使用也行,但不可避免要写很多重复的配置代码,封装稍不注意又会过度封装,丢失了扩展性和可读性。始终没有找到一个好的实践,偶然看到一篇文章,给了灵感。找到了一个目前认为用起来很舒服的封装。
思路
- 结合项目需求,针对不同类型的图表,配置基础的默认通用配置,例如x/y,label,图例等的样式
- 创建图表组件实例(不要使用
id,容易重复,还需要操作dom,直接用ref获取当前组件的el来创建图表),提供type(图表类型),和options(图表配置)两个必要属性 - 根据传入
type,加载默认的图表配置 - 深度监听传入的
options,变化时更新覆盖默认配置,更新图表 - 提供事件支持,支持
echart事件按需绑定交互
注意要确保所有传入图表组件的options数组都是
shallowReactive类型,避免数组量过大,深度响应式导致性能问题
目录结构
├─v-charts
│  │  index.ts     // 导出类型定义以及图表组件方便使用
│  │  type.d.ts    // 各种图表的类型定义
│  │  useCharts.ts // 图表hooks
│  │  v-charts.vue // echarts图表组件
│  │
│  └─options // 图表配置文件
│          bar.ts
│          gauge.ts
│          pie.ts
组件代码
v-charts.vue
<template>
  <div></div>
</template>
<script>
import { PropType } from "vue";
import * as echarts from "echarts/core";
import { useCharts, ChartType, ChartsEvents } from "./useCharts";

/**
 * echarts事件类型
 * 截至目前,vue3类型声明参数必须是以下内容之一,暂不支持外部引入类型参数
 * 1. 类型字面量
 * 2. 在同一文件中的接口或类型字面量的引用
 * // 文档中有说明:https://cn.vuejs.org/api/sfc-script-setup.html#typescript-only-features
 */
interface EventEmitsType {
  <T extends ChartsEvents.EventType>(e: `${T}`, event: ChartsEvents.Events[Uncapitalize<T>]): void;
}

defineOptions({
  name: "VCharts"
});

const props = defineProps({
  type: {
    type: String as PropType<ChartType>,
    default: "bar"
  },
  options: {
    type: Object as PropType<echarts.EChartsCoreOption>,
    default: () => ({})
  }
});

// 定义事件,提供ts支持,在组件使用时可获得友好提示
defineEmits<EventEmitsType>();

const { type, options } = toRefs(props);
const chartRef = shallowRef();
const { charts, setOptions, initChart } = useCharts({ type, el: chartRef });

onMounted(async () => {
  await initChart();
  setOptions(options.value);
});
watch(
  options,
  () => {
    setOptions(options.value);
  },
  {
    deep: true
  }
);
defineExpose({
  $charts: charts
});
</script>
<style>
.v-charts {
  width: 100%;
  height: 100%;
  min-height: 200px;
}
</style>useCharts.ts
import { ChartType } from "./type";
import * as echarts from "echarts/core";
import { ShallowRef, Ref } from "vue";

import {
  TitleComponent,
  LegendComponent,
  TooltipComponent,
  GridComponent,
  DatasetComponent,
  TransformComponent
} from "echarts/components";

import { BarChart, LineChart, PieChart, GaugeChart } from "echarts/charts";

import { LabelLayout, UniversalTransition } from "echarts/features";
import { CanvasRenderer } from "echarts/renderers";

const optionsModules = import.meta.glob("./options/**.ts");

interface ChartHookOption {
  type?: Ref<charttype>;
  el: ShallowRef<htmlelement>;
}

/**
 *  视口变化时echart图表自适应调整
 */
class ChartsResize {
  #charts = new Set<echarts.echarts>(); // 缓存已经创建的图表实例
  #timeId = null;
  constructor() {
    window.addEventListener("resize", this.handleResize.bind(this)); // 视口变化时调整图表
  }
  getCharts() {
    return [...this.#charts];
  }
  handleResize() {
    clearTimeout(this.#timeId);
    this.#timeId = setTimeout(() => {
      this.#charts.forEach(chart => {
        chart.resize();
      });
    }, 500);
  }
  add(chart: echarts.ECharts) {
    this.#charts.add(chart);
  }
  remove(chart: echarts.ECharts) {
    this.#charts.delete(chart);
  }
  removeListener() {
    window.removeEventListener("resize", this.handleResize);
  }
}

export const chartsResize = new ChartsResize();

export const useCharts = ({ type, el }: ChartHookOption) => {
  echarts.use([
    BarChart,
    LineChart,
    BarChart,
    PieChart,
    GaugeChart,
    TitleComponent,
    LegendComponent,
    TooltipComponent,
    GridComponent,
    DatasetComponent,
    TransformComponent,
    LabelLayout,
    UniversalTransition,
    CanvasRenderer
  ]);
  const charts = shallowRef<echarts.echarts>();
  let options!: echarts.EChartsCoreOption;
  const getOptions = async () => {
    const moduleKey = `./options/${type.value}.ts`;
    const { default: defaultOption } = await optionsModules[moduleKey]();
    return defaultOption;
  };

  const setOptions = (opt: echarts.EChartsCoreOption) => {
    charts.value.setOption(opt);
  };
  const initChart = async () => {
    charts.value = echarts.init(el.value);
    options = await getOptions();
    charts.value.setOption(options);
    chartsResize.add(charts.value); // 将图表实例添加到缓存中
    initEvent(); // 添加事件支持
  };

  /**
   * 初始化事件,按需绑定事件
   */
  const attrs = useAttrs();
  const initEvent = () => {
    Object.keys(attrs).forEach(attrKey => {
      if (/^on/.test(attrKey)) {
        const cb = attrs[attrKey];
        attrKey = attrKey.replace(/^on(Chart)?/, "");
        attrKey = `${attrKey[0]}${attrKey.substring(1)}`;
        typeof cb === "function" && charts.value?.on(attrKey, cb as () => void);
      }
    });
  };

  onBeforeUnmount(() => {
    chartsResize.remove(charts.value); // 移除缓存
  });

  return {
    charts,
    setOptions,
    initChart,
    initEvent
  };
};

export const chartsOptions = <t>(option: T) => shallowReactive<t>(option);

export * from "./type.d";</t></t></echarts.echarts></echarts.echarts></htmlelement></charttype>type.d.ts
/*
 * @Description:
 * @Version: 2.0
 * @Autor: GC
 * @Date: 2022-03-02 10:21:33
 * @LastEditors: GC
 * @LastEditTime: 2022-06-02 17:45:48
 */
// import * as echarts from 'echarts/core';
import * as echarts from 'echarts'
import { XAXisComponentOption, YAXisComponentOption } from 'echarts';

import { ECElementEvent, SelectChangedPayload, HighlightPayload,  } from 'echarts/types/src/util/types'

import {
  TitleComponentOption,
  TooltipComponentOption,
  GridComponentOption,
  DatasetComponentOption,
  AriaComponentOption,
  AxisPointerComponentOption,
  LegendComponentOption,
} from 'echarts/components';// 组件
import {
  // 系列类型的定义后缀都为 SeriesOption
  BarSeriesOption,
  LineSeriesOption,
  PieSeriesOption,
  FunnelSeriesOption,
  GaugeSeriesOption
} from 'echarts/charts';

type Options = LineECOption | BarECOption | PieECOption | FunnelOption

type BaseOptionType = XAXisComponentOption | YAXisComponentOption | TitleComponentOption | TooltipComponentOption | LegendComponentOption | GridComponentOption

type BaseOption = echarts.ComposeOption<baseoptiontype>

type LineECOption = echarts.ComposeOption<lineseriesoption>

type BarECOption = echarts.ComposeOption<barseriesoption>

type PieECOption = echarts.ComposeOption<pieseriesoption>

type FunnelOption = echarts.ComposeOption<funnelseriesoption>

type GaugeECOption = echarts.ComposeOption<gaugeseriesoption>

type EChartsOption = echarts.EChartsOption;

type ChartType = 'bar' | 'line' | 'pie' | 'gauge'

// echarts事件
namespace ChartsEvents {
  // 鼠标事件类型
  type MouseEventType = 'click' | 'dblclick' | 'mousedown' | 'mousemove' | 'mouseup' | 'mouseover' | 'mouseout' | 'globalout' | 'contextmenu' // 鼠标事件类型
  type MouseEvents = {
    [key in Exclude<mouseeventtype> as `chart${Capitalize<key>}`] :ECElementEvent
  }
  // 其他的事件类型极参数
  interface Events extends MouseEvents {
    globalout:ECElementEvent,
    contextmenu:ECElementEvent,
    selectchanged: SelectChangedPayload;
    highlight: HighlightPayload;
    legendselected: { // 图例选中后的事件
      type: 'legendselected',
      // 选中的图例名称
      name: string
      // 所有图例的选中状态表
      selected: {
        [name: string]: boolean
      }
    };
    // ... 其他类型的事件在这里定义
  }


  // echarts所有的事件类型
  type EventType = keyof Events
}

export {
  BaseOption,
  ChartType,
  LineECOption,
  BarECOption,
  Options,
  PieECOption,
  FunnelOption,
  GaugeECOption,
  EChartsOption,
  ChartsEvents
}</key></mouseeventtype></gaugeseriesoption></funnelseriesoption></pieseriesoption></barseriesoption></lineseriesoption></baseoptiontype>options/bar.ts
import { BarECOption } from "../type";
const options: BarECOption = {
  legend: {},
  tooltip: {},
  xAxis: {
    type: "category",
    axisLine: {
      lineStyle: {
        // type: "dashed",
        color: "#C8D0D7"
      }
    },
    axisTick: {
      show: false
    },
    axisLabel: {
      color: "#7D8292"
    }
  },
  yAxis: {
    type: "value",
    alignTicks: true,
    splitLine: {
      show: true,
      lineStyle: {
        color: "#C8D0D7",
        type: "dashed"
      }
    },
    axisLine: {
      lineStyle: {
        color: "#7D8292"
      }
    }
  },
  grid: {
    left: 60,
    bottom: "8%",
    top: "20%"
  },
  series: [
    {
      type: "bar",
      barWidth: 20,
      itemStyle: {
        color: {
          type: "linear",
          x: 0,
          x2: 0,
          y: 0,
          y2: 1,
          colorStops: [
            {
              offset: 0,
              color: "#62A5FF" // 0% 处的颜色
            },
            {
              offset: 1,
              color: "#3365FF" // 100% 处的颜色
            }
          ]
        }
      }
      // label: {
      //   show: true,
      //   position: "top"
      // }
    }
  ]
};
export default options;项目中使用
index.vue
<template>
  <div>
    <section>
      <div>
        <div>累计设备接入统计</div>
        <v-charts></v-charts>
      </div>
      <div>
        <div>坐标数据接入统计</div>
        <v-charts></v-charts>
      </div>
    </section>
  </div>
</template>
<script>
import {
  useStatisDeviceByUserObject,
} from "./hooks";
// 设备分类统计
const { options: statisDeviceByUserObjectOpts,selectchanged,handleChartClick } = useStatisDeviceByUserObject();
</script>/hooks/useStatisDeviceByUserObject.ts
export const useStatisDeviceByUserObject = () => {
  // 使用chartsOptions确保所有传入v-charts组件的options数据都是## shallowReactive浅层作用形式,避免大量数据导致性能问题
  const options = chartsOptions<barecoption>({
    yAxis: {},
    xAxis: {},
    series: []
  });
  const init = async () => {
    const xData = [];
    const sData = [];
    const dicts = useHashMapDics(["dev_user_object"]);
    const data = await statisDeviceByUserObject();
    dicts.dictionaryMap.dev_user_object.forEach(({ label, value }) => {
      if (value === "6") return; // 排除其他
      xData.push(label);
      const temp = data.find(({ name }) => name === value);
      sData.push(temp?.qty || 0);

      // 给options赋值时要注意options是浅层响应式
      options.xAxis = { data: xData };
      options.series = [{ ...options.series[0], data: sData }];
    });
  };

  // 事件
  const selectchanged = (params: ChartsEvents.Events["selectchanged"]) => {
    console.log(params, "选中图例了");
  };

  const handleChartClick = (params: ChartsEvents.Events["chartClick"]) => {
    console.log(params, "点击了图表");
  };

  onMounted(() => {
    init();
  });
  return {
    options,
    selectchanged,
    handleChartClick
  };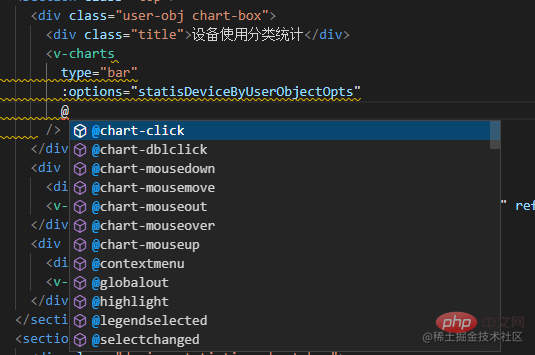
};</barecoption>使用时输入@可以看到组件支持的所有事件:
推荐学习:《vue.js视频教程》
The above is the detailed content of Let's talk about the best way to encapsulate echarts in vue3? (detailed code explanation). For more information, please follow other related articles on the PHP Chinese website!

Hot AI Tools

Undresser.AI Undress
AI-powered app for creating realistic nude photos

AI Clothes Remover
Online AI tool for removing clothes from photos.

Undress AI Tool
Undress images for free

Clothoff.io
AI clothes remover

AI Hentai Generator
Generate AI Hentai for free.

Hot Article
Hot Tools

Notepad++7.3.1
Easy-to-use and free code editor

SublimeText3 Chinese version
Chinese version, very easy to use

Zend Studio 13.0.1
Powerful PHP integrated development environment

Dreamweaver CS6
Visual web development tools

SublimeText3 Mac version
God-level code editing software (SublimeText3)
Hot Topics
 1386
1386
 52
52

 ECharts and Java interface: How to quickly implement statistical charts such as line charts, bar charts, pie charts, etc.
Dec 17, 2023 pm 10:37 PM
ECharts and Java interface: How to quickly implement statistical charts such as line charts, bar charts, pie charts, etc.
Dec 17, 2023 pm 10:37 PM
ECharts and Java interface: How to quickly implement statistical charts such as line charts, bar charts, and pie charts. Specific code examples are required. With the advent of the Internet era, data analysis has become more and more important. Statistical charts are a very intuitive and powerful display method. Charts can display data more clearly, allowing people to better understand the connotation and patterns of the data. In Java development, we can use ECharts and Java interfaces to quickly display various statistical charts. ECharts is a software developed by Baidu
 How to use php interface and ECharts to generate visual statistical charts
Dec 18, 2023 am 11:39 AM
How to use php interface and ECharts to generate visual statistical charts
Dec 18, 2023 am 11:39 AM
In today's context where data visualization is becoming more and more important, many developers hope to use various tools to quickly generate various charts and reports so that they can better display data and help decision-makers make quick judgments. In this context, using the Php interface and ECharts library can help many developers quickly generate visual statistical charts. This article will introduce in detail how to use the Php interface and ECharts library to generate visual statistical charts. In the specific implementation, we will use MySQL
 Steps to draw dashboard using ECharts and Python interface
Dec 18, 2023 am 08:40 AM
Steps to draw dashboard using ECharts and Python interface
Dec 18, 2023 am 08:40 AM
The steps to draw a dashboard using ECharts and Python interface require specific code examples. Summary: ECharts is an excellent data visualization tool that can easily perform data processing and graphics drawing through the Python interface. This article will introduce the specific steps to draw a dashboard using ECharts and Python interface, and provide sample code. Keywords: ECharts, Python interface, dashboard, data visualization Introduction Dashboard is a commonly used form of data visualization, which uses
 How to use map heat map to display city heat in ECharts
Dec 18, 2023 pm 04:00 PM
How to use map heat map to display city heat in ECharts
Dec 18, 2023 pm 04:00 PM
How to use a map heat map to display city heat in ECharts ECharts is a powerful visual chart library that provides various chart types for developers to use, including map heat maps. Map heat maps can be used to show the popularity of cities or regions, helping us quickly understand the popularity or density of different places. This article will introduce how to use the map heat map in ECharts to display city heat, and provide code examples for reference. First, we need a map file containing geographic information, EC
 How to use calendar charts to display time data in ECharts
Dec 18, 2023 am 08:52 AM
How to use calendar charts to display time data in ECharts
Dec 18, 2023 am 08:52 AM
How to use calendar charts to display time data in ECharts ECharts (Baidu’s open source JavaScript chart library) is a powerful and easy-to-use data visualization tool. It offers a variety of chart types, including line charts, bar charts, pie charts, and more. The calendar chart is a very distinctive and practical chart type in ECharts, which can be used to display time-related data. This article will introduce how to use calendar charts in ECharts and provide specific code examples. First, you need to use
 ECharts and golang technical guide: practical tips for creating various statistical charts
Dec 17, 2023 pm 09:56 PM
ECharts and golang technical guide: practical tips for creating various statistical charts
Dec 17, 2023 pm 09:56 PM
ECharts and golang technical guide: Practical tips for creating various statistical charts, specific code examples are required. Introduction: In the field of modern data visualization, statistical charts are an important tool for data analysis and visualization. ECharts is a powerful data visualization library, while golang is a fast, reliable and efficient programming language. This article will introduce you to how to use ECharts and golang to create various types of statistical charts, and provide code examples to help you master this skill. Preparation
 How to use ECharts and php interface to generate statistical charts
Dec 18, 2023 pm 01:47 PM
How to use ECharts and php interface to generate statistical charts
Dec 18, 2023 pm 01:47 PM
How to use ECharts and PHP interfaces to generate statistical charts Introduction: In modern web application development, data visualization is a very important link, which can help us display and analyze data intuitively. ECharts is a powerful open source JavaScript chart library. It provides a variety of chart types and rich interactive functions, and can easily generate various statistical charts. This article will introduce how to use ECharts and PHP interfaces to generate statistical charts, and give specific code examples. 1. Overview of ECha
 Does ECharts depend on jQuery? In-depth analysis
Feb 27, 2024 am 08:39 AM
Does ECharts depend on jQuery? In-depth analysis
Feb 27, 2024 am 08:39 AM
Does ECharts need to rely on jQuery? Detailed interpretation requires specific code examples. ECharts is an excellent data visualization library that provides a rich range of chart types and interactive functions and is widely used in web development. When using ECharts, many people will have a question: Does ECharts need to rely on jQuery? This article will explain this in detail and give specific code examples. First, to be clear, ECharts itself does not rely on jQuery;
