

Where is the linux crash log?

The Linux crash log is in "/var/log/"; the log log of "/var/log/" under Linux includes message, kernel error log demsg, etc.; the sa record records cpu, Performance files for memory and other operations; use the sa file to view the CPU and memory conditions during a crash.

#The operating environment of this tutorial: linux5.9.8 system, Dell G3 computer.
Where are the Linux crash logs?
Linux host downtime troubleshooting ideas
Cause analysis
Server classification, web server, database server, file server, middleware, Other servers.
Web server analysis: common web applications apache, nginx, IIS, etc.
There are many reasons for downtime, such as CPU, memory, IO disk, application BUG, kernel BUG, hardware, etc.
System and kernel version
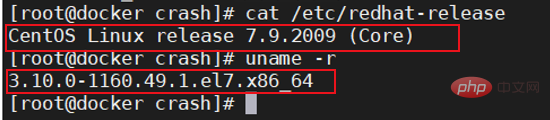
Process
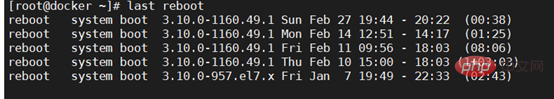
1. View the downtime time record, historical login and restart time
last reboot
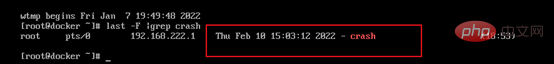
last -F | grep crash
Check the history login for any abnormal users
last

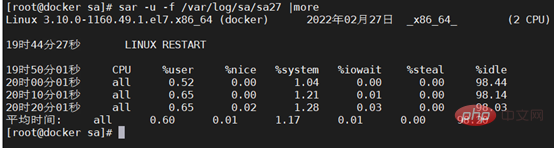
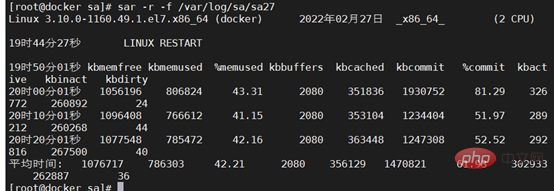
2. First Check the system log. For example, the log log under /var/log/ under Linux includes message, kernel error log demsg, etc. The sa record is a performance file that records the operation of CPU, memory, etc., and records the running status of the CPU during operation as shown in the figure. Show.
Use the sa file to check the CPU status during the crash
Use the sa file to check the memory status during the crash
The amount of logs is often very large
You can also perform fuzzy queries, such as
View error reports
tail -200 /var/log/messages |grep "Error"
cat /var/log/dmesg |grep "Error"
View kernel crash logs
tail -200 /car/log/messages |grep "crash"
Check whether When OOM occurs, the process will usually be killed by kill
cat /var/log/messages |grep -i "kill"
You can also check the logs during the downtime period, check the logs at 15:00 on December 11th
cat /vat/log/messages |grep "Feb 11 15*"
3. Check the memory usage
free -m, check the usage of swap, remaining memory and cache. If swap is used and available is not enough, you also need to check the parameter cat /proc/sys/vm/swappiness. If it is set to 0, it means there is not enough memory.

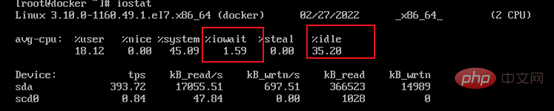
4. View io and file system using
to observe idle and iowait. The cache is used when reading and writing to the disk, which is generally 40% of the system memory. However, there is a buffering time of 120 seconds in the middle. When the cache is about to be used up, it will wait for 120 seconds before writing to the disk. When reading and writing are frequent, Sometimes it is easy to cause hanging.
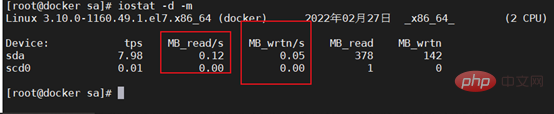
# Check the IO read and write speed. If it is very slow, it means there is a bottleneck in disk performance.
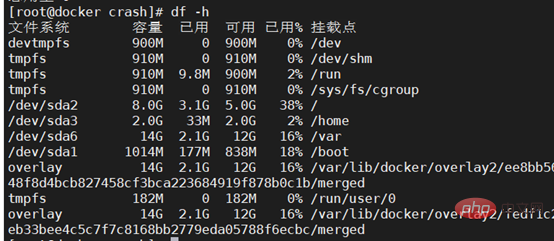
File system usage
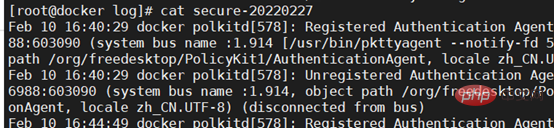
5. Check the security log
The security log is /var/ log/secure, check the history record to see if someone logged in to the host and took malicious actions, such as shutting down.
6. Use kdump and crash tools to analyze the kernel
Check that the kdump service is enabled on the server, and find the vmcore file generated that day in the /var/crash directory. Use the crash tool to analyze the vmcore file.
Kdump is used to dump memory images. It can not only dump the memory image to the local hard disk, but also dump the memory image to devices on different machines through NFS, SSH and other protocols.
Kdump is divided into two components: Kexec and Kdump.
Kexec is a quick startup tool for the kernel that allows a new kernel to be started in the context of a running kernel (production kernel) without going through time-consuming BIOS detection, making it easier for kernel developers to kernel for debugging.
Kdump is an effective memory dump tool. After enabling Kdump, the production kernel will reserve a part of the memory space for quickly booting to a new kernel through Kexec when the kernel crashes. This process does not require a restart. system so that a memory image of the crashed production kernel can be dumped.
7. Check service logs and monitoring software
If you can find the occupancy of the process during the downtime, you can check its logs based on the services with abnormal occupancy.
Service logs generally include databases and web services, middleware, frameworks, etc.
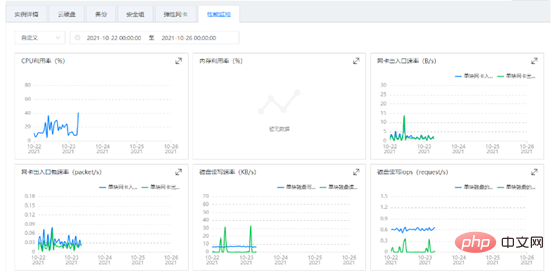
You can also view the historical record images of the monitoring software and find the image analysis of peak points and downtime points as shown below.
8. Summary
There are many reasons for system downtime, we need to carefully analyze according to the process,
Related recommendations: "Linux Video Tutorial"
The above is the detailed content of Where is the linux crash log?. For more information, please follow other related articles on the PHP Chinese website!

Hot AI Tools

Undresser.AI Undress
AI-powered app for creating realistic nude photos

AI Clothes Remover
Online AI tool for removing clothes from photos.

Undress AI Tool
Undress images for free

Clothoff.io
AI clothes remover

AI Hentai Generator
Generate AI Hentai for free.

Hot Article
Hot Tools

Notepad++7.3.1
Easy-to-use and free code editor

SublimeText3 Chinese version
Chinese version, very easy to use

Zend Studio 13.0.1
Powerful PHP integrated development environment

Dreamweaver CS6
Visual web development tools

SublimeText3 Mac version
God-level code editing software (SublimeText3)
Hot Topics
 1386
1386
 52
52

 Difference between centos and ubuntu
Apr 14, 2025 pm 09:09 PM
Difference between centos and ubuntu
Apr 14, 2025 pm 09:09 PM
The key differences between CentOS and Ubuntu are: origin (CentOS originates from Red Hat, for enterprises; Ubuntu originates from Debian, for individuals), package management (CentOS uses yum, focusing on stability; Ubuntu uses apt, for high update frequency), support cycle (CentOS provides 10 years of support, Ubuntu provides 5 years of LTS support), community support (CentOS focuses on stability, Ubuntu provides a wide range of tutorials and documents), uses (CentOS is biased towards servers, Ubuntu is suitable for servers and desktops), other differences include installation simplicity (CentOS is thin)
 How to use docker desktop
Apr 15, 2025 am 11:45 AM
How to use docker desktop
Apr 15, 2025 am 11:45 AM
How to use Docker Desktop? Docker Desktop is a tool for running Docker containers on local machines. The steps to use include: 1. Install Docker Desktop; 2. Start Docker Desktop; 3. Create Docker image (using Dockerfile); 4. Build Docker image (using docker build); 5. Run Docker container (using docker run).
 How to install centos
Apr 14, 2025 pm 09:03 PM
How to install centos
Apr 14, 2025 pm 09:03 PM
CentOS installation steps: Download the ISO image and burn bootable media; boot and select the installation source; select the language and keyboard layout; configure the network; partition the hard disk; set the system clock; create the root user; select the software package; start the installation; restart and boot from the hard disk after the installation is completed.
 Centos options after stopping maintenance
Apr 14, 2025 pm 08:51 PM
Centos options after stopping maintenance
Apr 14, 2025 pm 08:51 PM
CentOS has been discontinued, alternatives include: 1. Rocky Linux (best compatibility); 2. AlmaLinux (compatible with CentOS); 3. Ubuntu Server (configuration required); 4. Red Hat Enterprise Linux (commercial version, paid license); 5. Oracle Linux (compatible with CentOS and RHEL). When migrating, considerations are: compatibility, availability, support, cost, and community support.
 How to view the docker process
Apr 15, 2025 am 11:48 AM
How to view the docker process
Apr 15, 2025 am 11:48 AM
Docker process viewing method: 1. Docker CLI command: docker ps; 2. Systemd CLI command: systemctl status docker; 3. Docker Compose CLI command: docker-compose ps; 4. Process Explorer (Windows); 5. /proc directory (Linux).
 Detailed explanation of docker principle
Apr 14, 2025 pm 11:57 PM
Detailed explanation of docker principle
Apr 14, 2025 pm 11:57 PM
Docker uses Linux kernel features to provide an efficient and isolated application running environment. Its working principle is as follows: 1. The mirror is used as a read-only template, which contains everything you need to run the application; 2. The Union File System (UnionFS) stacks multiple file systems, only storing the differences, saving space and speeding up; 3. The daemon manages the mirrors and containers, and the client uses them for interaction; 4. Namespaces and cgroups implement container isolation and resource limitations; 5. Multiple network modes support container interconnection. Only by understanding these core concepts can you better utilize Docker.
 What to do if the docker image fails
Apr 15, 2025 am 11:21 AM
What to do if the docker image fails
Apr 15, 2025 am 11:21 AM
Troubleshooting steps for failed Docker image build: Check Dockerfile syntax and dependency version. Check if the build context contains the required source code and dependencies. View the build log for error details. Use the --target option to build a hierarchical phase to identify failure points. Make sure to use the latest version of Docker engine. Build the image with --t [image-name]:debug mode to debug the problem. Check disk space and make sure it is sufficient. Disable SELinux to prevent interference with the build process. Ask community platforms for help, provide Dockerfiles and build log descriptions for more specific suggestions.
 What computer configuration is required for vscode
Apr 15, 2025 pm 09:48 PM
What computer configuration is required for vscode
Apr 15, 2025 pm 09:48 PM
VS Code system requirements: Operating system: Windows 10 and above, macOS 10.12 and above, Linux distribution processor: minimum 1.6 GHz, recommended 2.0 GHz and above memory: minimum 512 MB, recommended 4 GB and above storage space: minimum 250 MB, recommended 1 GB and above other requirements: stable network connection, Xorg/Wayland (Linux)
