 Web Front-end
 JS Tutorial
 Detailed graphic explanation of the memory and GC of the Node V8 engine
Detailed graphic explanation of the memory and GC of the Node V8 engine
This article will give you an in-depth understanding of the memory and garbage collector (GC) of the NodeJS V8 engine. I hope it will be helpful to you!

1. Why GC is needed
Program applications need to use memory, and the two partitions of memory are what we often discuss. Concepts: stack area and heap area.
The stack area is a linear queue, which is automatically released as the function ends, while the heap area is a free dynamic memory space, and the heap memory is manually allocated and released or garbage collection program(Garbage Collection (hereinafter referred to as GC) is automatically allocated and released.
In the early days of software development or some languages, heap memory was allocated and released manually, such as C, C . Although it can accurately operate memory and achieve the best possible memory usage, the development efficiency is very low and it is prone to improper memory operation. [Related tutorial recommendations: nodejs video tutorial, Programming teaching]
With the development of technology, high-level languages (such as Java Node ) do not require developers to manually operate memory, and the programming language will automatically allocate and release space. At the same time, the GC (Garbage Collection) garbage collector was also born to help release and organize memory. In most cases, developers do not need to care about the memory itself and can focus on business development. The following article mainly discusses heap memory and GC.
2. GC Development
GC operation will consume CPU resources. The GC operation process will trigger STW (stop-the-world) to suspend the business code thread. Why? What about STW? This is to ensure that there will be no conflict with newly created objects during the GC process.
GC mainly develops and evolves with the increase in memory size. It is roughly divided into 3 major representative stages:
- Phase 1 single-threaded GC (represents: serial)
Single-threaded GC, in which garbage is performed When collecting, you mustcompletely pause all other worker threads, which is the initial stage of GC and has the worst performance
- Phase two parallel multi-thread GC (represents :Parallel Scavenge, ParNew)
Use multiple GC threads to run in parallel at the same time in a multi-CPU environment, thereby reducing the garbage collection time and user thread pause time. This algorithm also Will STW, Completely suspend all other working threads
- Phase three multi-thread concurrent concurrent GC (representative: CMS (Concurrent Mark Sweep) G1)
The concurrency here means: GC multi-thread execution can run concurrently with business code.
The GC algorithms in the previous two development stages will be completely STW, but in concurrent GC, some stages of GC threads can run concurrently with the business code, ensuring a shorter STW time. However, there will be marking errors in this mode, because new objects may come in during the GC process. Of course, the algorithm itself will correct and solve this problem.
The above three stages do not mean that GC must be as described above. One of three types. GCs in different programming languages are implemented using a variety of algorithm combinations according to different needs.
3. v8 memory partition and GC
Heap memory design and GC design are closely related. V8 divides the heap memory into several major areas and adopts a generational strategy.
Stealed pictures:
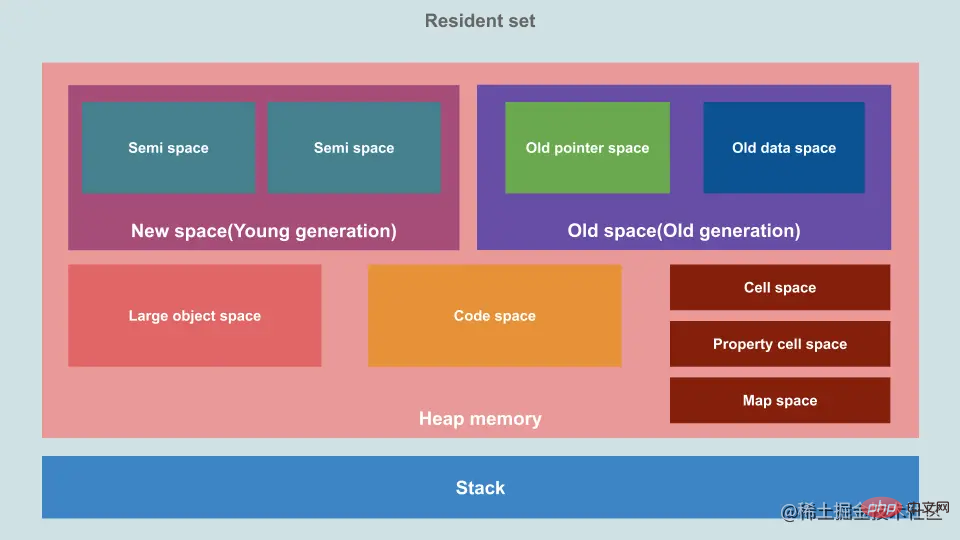
- New-space or young-generation: The space is small and divided into Two half-spaces (semi-space), where the data has a short lifetime.
- Old generation (old-space or old-generation): Large space, can be incremented, and the data survival period is long
- Large object space ( large-object-space) : Objects exceeding 256K will be in this space by default, explained below
- Code-space (code-space) : Just-in-time compiler (JIT) in Compiled code is stored here
- Metaspace (cell space): This space is used to store small, fixed-size JavaScript objects, such as numbers and Boolean values.
- Property cell space : This space is used to store special JavaScript objects, such as accessor properties and certain internal objects.
- Map Space: This space is used to store meta information and other internal data structures for JavaScript objects, such as Map and Set objects.
3.1 Generational strategy: new generation and old generation
In Node.js, GC adopts generational generation The strategy is divided into new and old generation areas, and most of the memory data is in these two areas.
3.1.1 The new generation
The new generation is a small, fast memory pool that stores objects with young age and is divided into two half-spaces (semi-space). Half of the space is free (called to space), and the other half of the space stores data (called from space).
When objects are first created, they are allocated to the young generation from half-space, which has an age of 1. When from is insufficient or exceeds a certain size, Minor GC (using the copy algorithm Scavenge) will be triggered. At this time, the GC will suspend the execution of the application. (STW, stop-the-world), mark all active objects in the (from space), and then organize and move them continuously to another free space (to space) in the new generation. Finally, all the memory in the original from space will be released and become free space. The two spaces will complete the swap of from and to. The copy algorithm is An algorithm that sacrifices space for time.
The space of the new generation is smaller, so this space will trigger GC more frequently. At the same time, the scanned space is smaller, the GC performance consumption is also smaller, and its GC execution time is also shorter.
Every time a Minor GC is completed, the age of the surviving objects is 1. Objects that have survived multiple Minor GCs (age greater than N) will be moved to the old generation memory pool.
3.1.2 Old generation
The old generation is a large memory pool used to store long-lived objects. Old generation memory uses Mark-Sweep and Mark-Compact algorithm. One execution of it is called Mayor GC. When the objects in the old generation fill a certain proportion, that is, the ratio of surviving objects to total objects exceeds a certain threshold, a mark clearing or marking compression will be triggered.
Because its space is larger, its GC execution time is also longer, and its frequency is lower than that of the new generation. If there is still insufficient space after the old generation completes GC recycling, V8 will apply for more memory from the system.
You can manually execute the global.gc() method, set different parameters, and actively trigger GC. However, it should be noted that this method is disabled by default in Node.js. If you want to enable it, you can enable it by adding the --expose-gc parameter when starting the Node.js application, for example:
node --expose-gc app.js
V8 Mark is mainly used in the old generation Garbage collection is performed by combining -Sweep and Mark-Compact.
Mark-Sweep means mark sweep, which is divided into two stages, mark and sweep. Mark-Sweep In the marking phase, all objects in the heap are traversed and live objects are marked. In the subsequent clearing phase, only unmarked objects are cleared.
Mark-Sweep The biggest problem is that after a mark sweep is performed, the memory space will become discontinuous. This kind of memory fragmentation will cause problems for subsequent memory allocation, because it is very likely that a large object needs to be allocated. At this time, all the fragmented space cannot complete the allocation, and garbage collection will be triggered in advance, and this recycling is unnecessary.
In order to solve the memory fragmentation problem of Mark-Sweep, Mark-Compact was proposed. Mark-Compact means mark compilation, which is based on Mark-Sweep. The difference between them is that after the object is marked as dead, during the cleaning process, the living objects are moved to one end. After the movement is completed, the memory outside the boundary is directly cleared. V8 It will also release a certain amount of free memory and return it to the system based on certain logic.
3.2 Large object space large object space
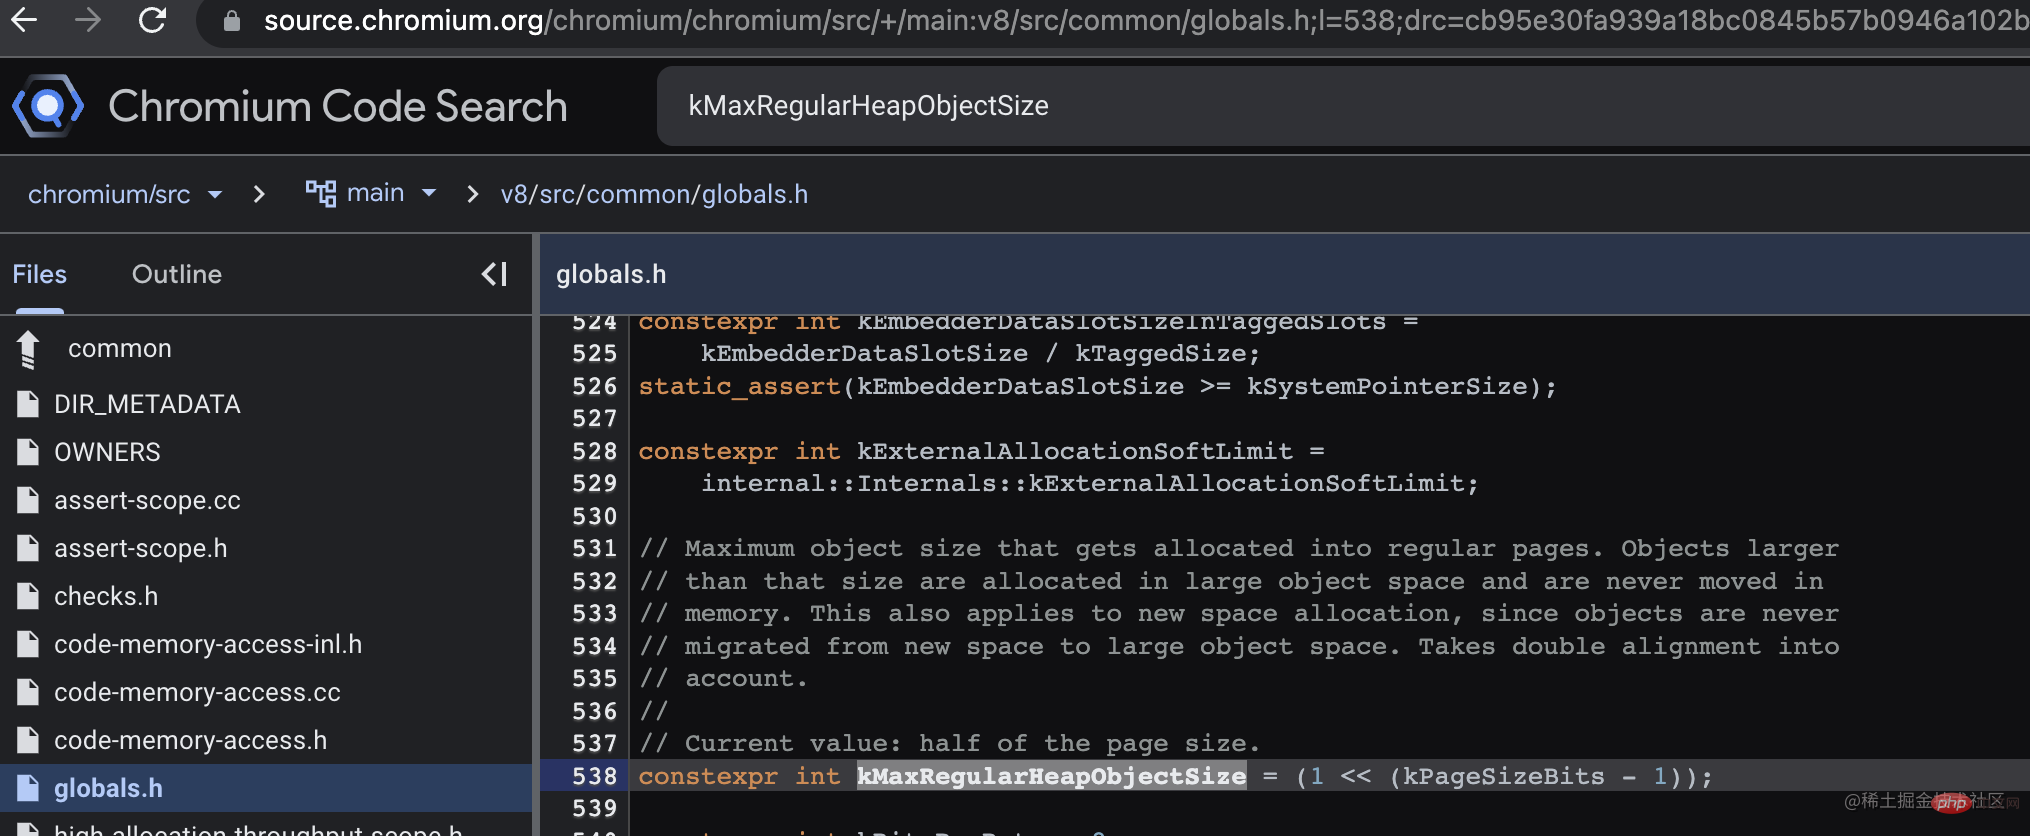
Large objects will be created directly in the large object space and will not be moved to other spaces. So how big an object will be created directly in the large object space instead of in the new generation from area? After consulting the information and source code, I finally found the answer. By default it is 256K, V8 does not seem to expose modification commands, the v8_enable_hugepage configuration in the source code should be set when packaging.
 // There is a separate large object space for objects larger than
 // Page::kMaxRegularHeapObjectSize, so that they do not have to move during
 // collection. The large object space is paged. Pages in large object space
 // may be larger than the page size.

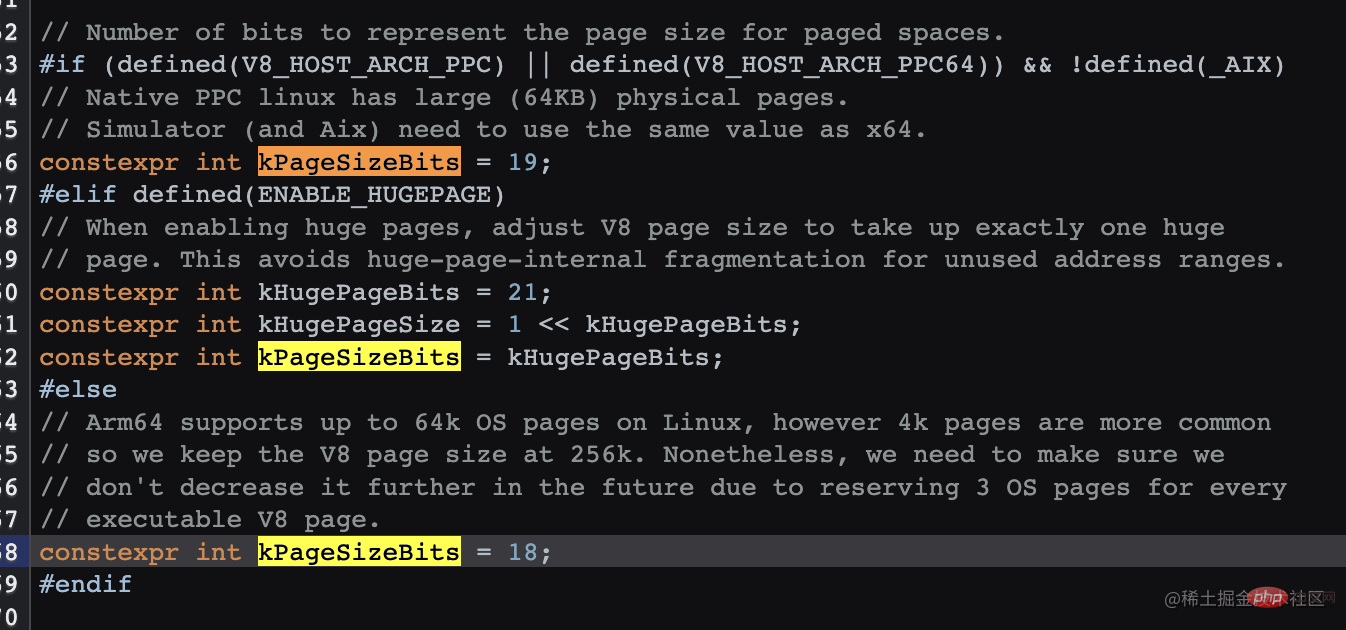
(1 << (18 - 1)) 的结果 256K
(1 << (19 - 1)) 的结果 256K
(1 << (21 - 1)) 的结果 1M(如果开启了hugPage)
四、V8 新老分区大小
4.1 老生代分区大小
在v12.x 之前:
为了保证 GC 的执行时间保持在一定范围内,V8 限制了最大内存空间,设置了一个默认老生代内存最大值,64位系统中为大约1.4G,32位为大约700M,超出会导致应用崩溃。
如果想加大内存,可以使用 --max-old-space-size 设置最大内存(单位:MB)
node --max_old_space_size=
在v12以后:
V8 将根据可用内存分配老生代大小,也可以说是堆内存大小,所以并没有限制堆内存大小。以前的限制逻辑,其实不合理,限制了 V8 的能力,总不能因为 GC 过程消耗的时间更长,就不让我继续运行程序吧,后续的版本也对 GC 做了更多优化,内存越来越大也是发展需要。
如果想要做限制,依然可以使用 --max-old-space-size 配置, v12 以后它的默认值是0,代表不限制。
参考文档:nodejs.medium.com/introducing…
4.2 新生代分区大小
新生代中的一个 semi-space 大小 64位系统的默认值是16M,32位系统是8M,因为有2个 semi-space,所以总大小是32M、16M。
--max-semi-space-size
--max-semi-space-size 设置新生代 semi-space 最大值,单位为MB。
此空间不是越大越好,空间越大扫描的时间就越长。这个分区大部分情况下是不需要做修改的,除非针对具体的业务场景做优化,谨慎使用。
--max-new-space-size
--max-new-space-size 设置新生代空间最大值,单位为KB(不存在)
有很多文章说到此功能,我翻了下 nodejs.org 网页中 v4 v6 v7 v8 v10的文档都没有看到有这个配置,使用 node --v8-options 也没有查到,也许以前的某些老版本有,而现在都应该使用 --max-semi-space-size。
五、 内存分析相关API
5.1 v8.getHeapStatistics()
执行 v8.getHeapStatistics(),查看 v8 堆内存信息,查询最大堆内存 heap_size_limit,当然这里包含了新、老生代、大对象空间等。我的电脑硬件内存是 8G,Node版本16x,查看到 heap_size_limit 是4G。
{
  total_heap_size: 6799360,
  total_heap_size_executable: 524288,
  total_physical_size: 5523584,
  total_available_size: 4340165392,
  used_heap_size: 4877928,
  heap_size_limit: 4345298944,
  malloced_memory: 254120,
  peak_malloced_memory: 585824,
  does_zap_garbage: 0,
  number_of_native_contexts: 2,
  number_of_detached_contexts: 0
}到 k8s 容器中查询 NodeJs 应用,分别查看了v12 v14 v16版本,如下表。看起来是本身系统当前的最大内存的一半。128M 的时候,为啥是 256M,因为容器中还有交换内存,容器内存实际最大内存限制是内存限制值 x2,有同等的交换内存。
所以结论是大部分情况下 heap_size_limit 的默认值是系统内存的一半。但是如果超过这个值且系统空间足够,V8 还是会申请更多空间。当然这个结论也不是一个最准确的结论。而且随着内存使用的增多,如果系统内存还足够,这里的最大内存还会增长。
| 容器最大内存 | heap_size_limit |
|---|---|
| 4G | 2G |
| 2G | 1G |
| 1G | 0.5G |
| 1.5G | 0.7G |
| 256M | 256M |
| 128M | 256M |
5.2 process.memoryUsage
process.memoryUsage()
{
  rss: 35438592,
  heapTotal: 6799360,
  heapUsed: 4892976,
  external: 939130,
  arrayBuffers: 11170
}通过它可以查看当前进程的内存占用和使用情况 heapTotal、heapUsed,可以定时获取此接口,然后绘画出折线图帮助分析内存占用情况。以下是 Easy-Monitor 提供的功能:
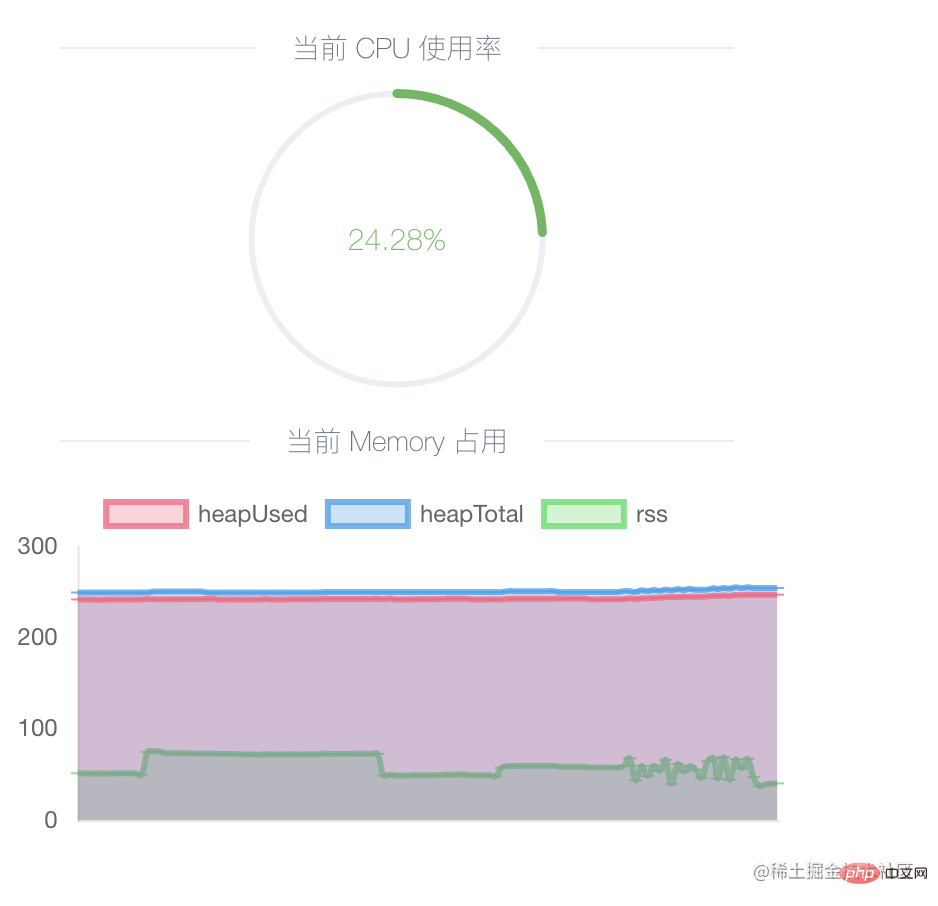
建议本地开发环境使用,开启后,尝试大量请求,会看到内存曲线增长,到请求结束之后,GC触发后会看到内存曲线下降,然后再尝试多次发送大量请求,这样往复下来,如果发现内存一直在增长低谷值越来越高,就可能是发生了内存泄漏。
5.3 开启打印GC事件
使用方法
node --trace_gc app.js
// 或者
v8.setFlagsFromString('--trace_gc');
- --trace_gc
[40807:0x148008000]   235490 ms: Scavenge 247.5 (259.5) -> 244.7 (260.0) MB, 0.8 / 0.0 ms  (average mu = 0.971, current mu = 0.908) task
[40807:0x148008000]   235521 ms: Scavenge 248.2 (260.0) -> 245.2 (268.0) MB, 1.2 / 0.0 ms  (average mu = 0.971, current mu = 0.908) allocation failure
[40807:0x148008000]   235616 ms: Scavenge 251.5 (268.0) -> 245.9 (268.8) MB, 1.9 / 0.0 ms  (average mu = 0.971, current mu = 0.908) task
[40807:0x148008000]   235681 ms: Mark-sweep 249.7 (268.8) -> 232.4 (268.0) MB, 7.1 / 0.0 ms  (+ 46.7 ms in 170 steps since start of marking, biggest step 4.2 ms, walltime since start of marking 159 ms) (average mu = 1.000, current mu = 1.000) finalize incremental marking via task GC in old space requested
GCType <heapUsed before> (<heapTotal before>) -> <heapUsed after> (<heapTotal after>) MB
上面的 Scavenge 和 Mark-sweep 代表GC类型,Scavenge 是新生代中的清除事件,Mark-sweep 是老生代中的标记清除事件。箭头符号前是事件发生前的实际使用内存大小,箭头符号后是事件结束后的实际使用内存大小,括号内是内存空间总值。可以看到新生代中事件发生的频率很高,而后触发的老生代事件会释放总内存空间。
- --trace_gc_verbose
展示堆空间的详细情况
v8.setFlagsFromString('--trace_gc_verbose');

[44729:0x130008000] Fast promotion mode: false survival rate: 19%
[44729:0x130008000]    97120 ms: [HeapController] factor 1.1 based on mu=0.970, speed_ratio=1000 (gc=433889, mutator=434)
[44729:0x130008000]    97120 ms: [HeapController] Limit: old size: 296701 KB, new limit: 342482 KB (1.1)
[44729:0x130008000]    97120 ms: [GlobalMemoryController] Limit: old size: 296701 KB, new limit: 342482 KB (1.1)
[44729:0x130008000]    97120 ms: Scavenge 302.3 (329.9) -> 290.2 (330.4) MB, 8.4 / 0.0 ms  (average mu = 0.998, current mu = 0.999) task
[44729:0x130008000] Memory allocator,       used: 338288 KB, available: 3905168 KB
[44729:0x130008000] Read-only space,        used:    166 KB, available:      0 KB, committed:    176 KB
[44729:0x130008000] New space,              used:    444 KB, available:  15666 KB, committed:  32768 KB
[44729:0x130008000] New large object space, used:      0 KB, available:  16110 KB, committed:      0 KB
[44729:0x130008000] Old space,              used: 253556 KB, available:   1129 KB, committed: 259232 KB
[44729:0x130008000] Code space,             used:  10376 KB, available:    119 KB, committed:  12944 KB
[44729:0x130008000] Map space,              used:   2780 KB, available:      0 KB, committed:   2832 KB
[44729:0x130008000] Large object space,     used:  29987 KB, available:      0 KB, committed:  30336 KB
[44729:0x130008000] Code large object space,     used:      0 KB, available:      0 KB, committed:      0 KB
[44729:0x130008000] All spaces,             used: 297312 KB, available: 3938193 KB, committed: 338288 KB
[44729:0x130008000] Unmapper buffering 0 chunks of committed:      0 KB
[44729:0x130008000] External memory reported:  20440 KB
[44729:0x130008000] Backing store memory:  22084 KB
[44729:0x130008000] External memory global 0 KB
[44729:0x130008000] Total time spent in GC  : 199.1 ms
- --trace_gc_nvp
每次GC事件的详细信息,GC类型,各种时间消耗,内存变化等
v8.setFlagsFromString('--trace_gc_nvp');

[45469:0x150008000]  8918123 ms: pause=0.4 mutator=83.3 gc=s reduce_memory=0 time_to_safepoint=0.00 heap.prologue=0.00 heap.epilogue=0.00 heap.epilogue.reduce_new_space=0.00 heap.external.prologue=0.00 heap.external.epilogue=0.00 heap.external_weak_global_handles=0.00 fast_promote=0.00 complete.sweep_array_buffers=0.00 scavenge=0.38 scavenge.free_remembered_set=0.00 scavenge.roots=0.00 scavenge.weak=0.00 scavenge.weak_global_handles.identify=0.00 scavenge.weak_global_handles.process=0.00 scavenge.parallel=0.08 scavenge.update_refs=0.00 scavenge.sweep_array_buffers=0.00 background.scavenge.parallel=0.00 background.unmapper=0.04 unmapper=0.00 incremental.steps_count=0 incremental.steps_took=0.0 scavenge_throughput=1752382 total_size_before=261011920 total_size_after=260180920 holes_size_before=838480 holes_size_after=838480 allocated=831000 promoted=0 semi_space_copied=4136 nodes_died_in_new=0 nodes_copied_in_new=0 nodes_promoted=0 promotion_ratio=0.0% average_survival_ratio=0.5% promotion_rate=0.0% semi_space_copy_rate=0.5% new_space_allocation_throughput=887.4 unmapper_chunks=124
[45469:0x150008000]  8918234 ms: pause=0.6 mutator=110.9 gc=s reduce_memory=0 time_to_safepoint=0.00 heap.prologue=0.00 heap.epilogue=0.00 heap.epilogue.reduce_new_space=0.04 heap.external.prologue=0.00 heap.external.epilogue=0.00 heap.external_weak_global_handles=0.00 fast_promote=0.00 complete.sweep_array_buffers=0.00 scavenge=0.50 scavenge.free_remembered_set=0.00 scavenge.roots=0.08 scavenge.weak=0.00 scavenge.weak_global_handles.identify=0.00 scavenge.weak_global_handles.process=0.00 scavenge.parallel=0.08 scavenge.update_refs=0.00 scavenge.sweep_array_buffers=0.00 background.scavenge.parallel=0.00 background.unmapper=0.04 unmapper=0.00 incremental.steps_count=0 incremental.steps_took=0.0 scavenge_throughput=1766409 total_size_before=261207856 total_size_after=260209776 holes_size_before=838480 holes_size_after=838480 allocated=1026936 promoted=0 semi_space_copied=3008 nodes_died_in_new=0 nodes_copied_in_new=0 nodes_promoted=0 promotion_ratio=0.0% average_survival_ratio=0.5% promotion_rate=0.0% semi_space_copy_rate=0.3% new_space_allocation_throughput=888.1 unmapper_chunks=124
5.4 内存快照
const { writeHeapSnapshot } = require('node:v8');
v8.writeHeapSnapshot()打印快照,将会STW,服务停止响应,内存占用越大,时间越长。此方法本身就比较费时间,所以生成的过程预期不要太高,耐心等待。
注意:生成内存快照的过程,会STW(程序将暂停)几乎无任何响应,如果容器使用了健康检测,这时无法响应的话,容器可能被重启,导致无法获取快照,如果需要生成快照、建议先关闭健康检测。
兼容性问题:此 API arm64 架构不支持,执行就会卡住进程 生成空快照文件 再无响应, 如果使用库 heapdump,会直接报错:
(mach-o file, but is an incompatible architecture (have (arm64), need (x86_64))
此 API 会生成一个 .heapsnapshot 后缀快照文件,可以使用 Chrome 调试器的“内存”功能,导入快照文件,查看堆内存具体的对象数和大小,以及到GC根结点的距离等。也可以对比两个不同时间快照文件的区别,可以看到它们之间的数据量变化。
六、利用内存快照分析内存泄漏
一个 Node 应用因为内存超过容器限制经常发生重启,通过容器监控后台看到应用内存的曲线是一直上升的,那应该是发生了内存泄漏。
使用 Chrome 调试器对比了不同时间的快照。发现对象增量最多的是闭包函数,继而展开查看整个列表,发现数据量较多的是 mongo 文档对象,其实就是闭包函数内的数据没有被释放,再通过查看 Object 列表,发现同样很多对象,最外层的详情显示的是 Mongoose 的 Connection 对象。

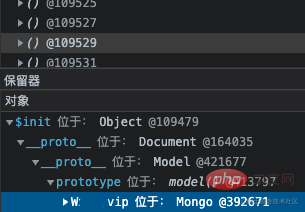
到此为止,已经大概定位到一个类的 mongo 数据存储逻辑附近有内存泄漏。
再看到 Timeout 对象也比较多,从 GC 根节点距离来看,这些对象距离非常深。点开详情,看到这一层层的嵌套就定位到了代码中准确的位置。因为那个类中有个定时任务使用 setInterval 定时器去分批处理一些不紧急任务,当一个 setInterval 把事情做完之后就会被 clearInterval 清除。

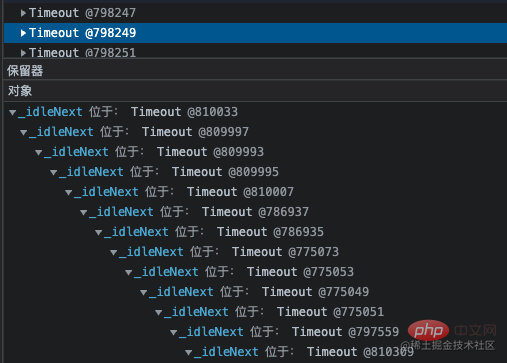
Leak resolution and optimization
Through code logic analysis, we finally found the problem. It was the trigger condition of clearInterval that caused the timer to not be cleared. The cycle continues. The timer keeps executing. This code and the data in it are still in the closure and cannot be recycled by GC, so the memory will become larger and larger until it reaches the upper limit and crashes.
The method of using setInterval here is unreasonable. By the way, it was changed to use for await queue sequential execution, so as to avoid a large number of concurrency at the same time. The code is also Much clearer. Since this piece of code is relatively old, I won’t consider why setInterval was used in the first place.
After more than ten days of observation after the new version was released, the average memory remained at just over 100M. The GC normally recycled the temporarily increased memory, showing a wavy curve, and no more leaks occurred.

So far, the memory leak has been analyzed and resolved using memory snapshots. Of course, the actual analysis requires a bit of twists and turns. The content of this memory snapshot is not easy to understand and not so straightforward. The display of snapshot data is type aggregation. You need to look at different constructors and internal data details, combined with comprehensive analysis of your own code, to find some clues. For example, judging from the memory snapshot I got at that time, there was a large amount of data including closures, strings, mongo model classes, Timeout, Object, etc. In fact, these incremental data all came from the problematic code. , and cannot be recycled by GC.
6. Finally
Different languages have different GC implementations, such as Java and Go:
Java: Understand JVM (corresponding to Node V8). Java also adopts the generational strategy. There is also an eden area in its new generation. , new objects are created in this area. The V8 new generation does not have the eden area.
Go: Using mark removal, three-color marking algorithm
Different languages have different GC implementations, but essentially they are all implemented using a combination of different algorithms. In terms of performance, different combinations bring different performance efficiencies in all aspects, but they all trade off and are just biased towards different application scenarios.
For more node-related knowledge, please visit: nodejs tutorial!
The above is the detailed content of Detailed graphic explanation of the memory and GC of the Node V8 engine. For more information, please follow other related articles on the PHP Chinese website!

Hot AI Tools

Undresser.AI Undress
AI-powered app for creating realistic nude photos

AI Clothes Remover
Online AI tool for removing clothes from photos.

Undress AI Tool
Undress images for free

Clothoff.io
AI clothes remover

AI Hentai Generator
Generate AI Hentai for free.

Hot Article

Hot Tools

Notepad++7.3.1
Easy-to-use and free code editor

SublimeText3 Chinese version
Chinese version, very easy to use

Zend Studio 13.0.1
Powerful PHP integrated development environment

Dreamweaver CS6
Visual web development tools

SublimeText3 Mac version
God-level code editing software (SublimeText3)

Hot Topics
 An article about memory control in Node
Apr 26, 2023 pm 05:37 PM
The Node service built based on non-blocking and event-driven has the advantage of low memory consumption and is very suitable for handling massive network requests. Under the premise of massive requests, issues related to "memory control" need to be considered. 1. V8’s garbage collection mechanism and memory limitations Js is controlled by the garbage collection machine
 Detailed graphic explanation of the memory and GC of the Node V8 engine
Mar 29, 2023 pm 06:02 PM
This article will give you an in-depth understanding of the memory and garbage collector (GC) of the NodeJS V8 engine. I hope it will be helpful to you!
 Let's talk in depth about the File module in Node
Apr 24, 2023 pm 05:49 PM
The file module is an encapsulation of underlying file operations, such as file reading/writing/opening/closing/delete adding, etc. The biggest feature of the file module is that all methods provide two versions of **synchronous** and **asynchronous**, with Methods with the sync suffix are all synchronization methods, and those without are all heterogeneous methods.
 12 points to note when sharing interface design documents
Apr 24, 2023 am 10:58 AM
Recently, when I was reviewing the interface document, I found that the parameter defined by a small partner was an enumeration value, but the interface document did not give the corresponding specific enumeration value. In fact, how to write interface documents well is really important. Today, Brother Tianluo brings you 12 points to pay attention to in interface design documents~
 In-depth understanding of generics in golang (Generic)
Apr 11, 2023 pm 07:20 PM
What this article brings to you is an in-depth understanding of generics in golang? How to use generics? It has certain reference value. Friends in need can refer to it. I hope it will be helpful to you.
 Let's talk about the event loop in Node
Apr 11, 2023 pm 07:08 PM
The event loop is a fundamental part of Node.js and enables asynchronous programming by ensuring that the main thread is not blocked. Understanding the event loop is crucial to building efficient applications. The following article will give you an in-depth understanding of the event loop in Node. I hope it will be helpful to you!
 Learn about the unsafe package in Golang
Apr 02, 2023 am 08:30 AM
In some low-level libraries, you often see the use of the unsafe package. This article will take you to understand the unsafe package in Golang, introduce the role of the unsafe package and how to use Pointer. I hope it will be helpful to you!
 Learn more about Buffers in Node
Apr 25, 2023 pm 07:49 PM
At the beginning, JS only ran on the browser side. It was easy to process Unicode-encoded strings, but it was difficult to process binary and non-Unicode-encoded strings. And binary is the lowest level data format of the computer, video/audio/program/network package


