
 Development Tools
VSCode
How to debug React source code? Introduction to debugging methods using multiple tools
Development Tools
VSCode
How to debug React source code? Introduction to debugging methods using multiple tools
How to debug React source code? Introduction to debugging methods using multiple tools

How to debug React source code? The following article will talk about how to debug React source code under various tools, and introduce how to debug the real source code of React in contributors, create-react-app, and vite projects. I hope it will be helpful to everyone!
clone React
Clone React locally and install dependencies.
git clone https://github.com/facebook/react.git
Compile project
If you just run a simple yarn build, the sourcemap will not be generated. This is not what we want. We need to compile the sourcemap## required by the modern editor. #Map to actual source code for debugging.
scripts/rollup/build.js [Recommended learning: vscode tutorial ,Programming Teaching】
②: The comment part cannot generate the sourcemap plug-in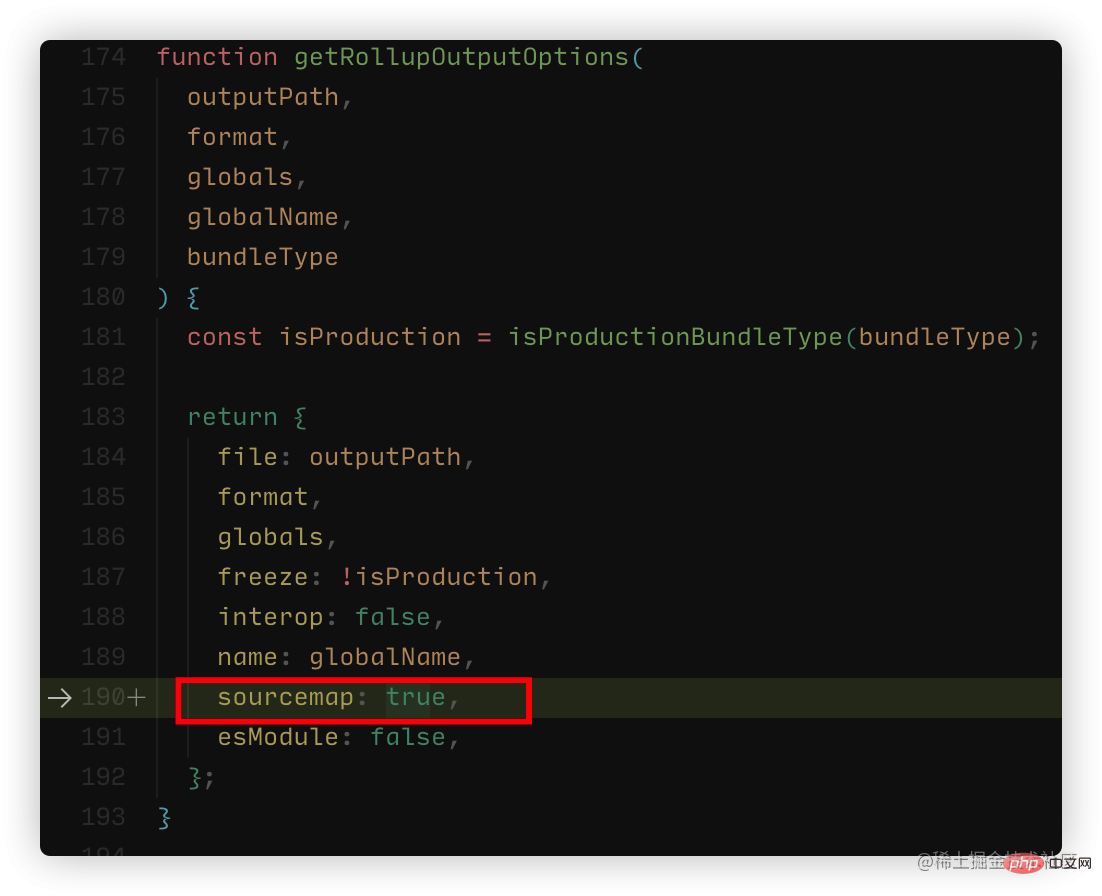
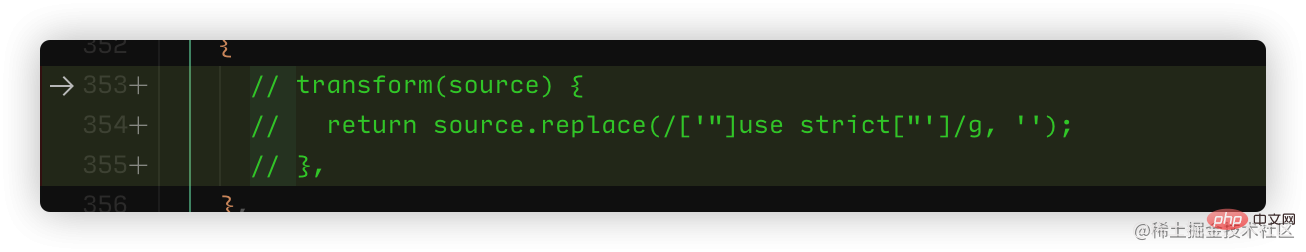
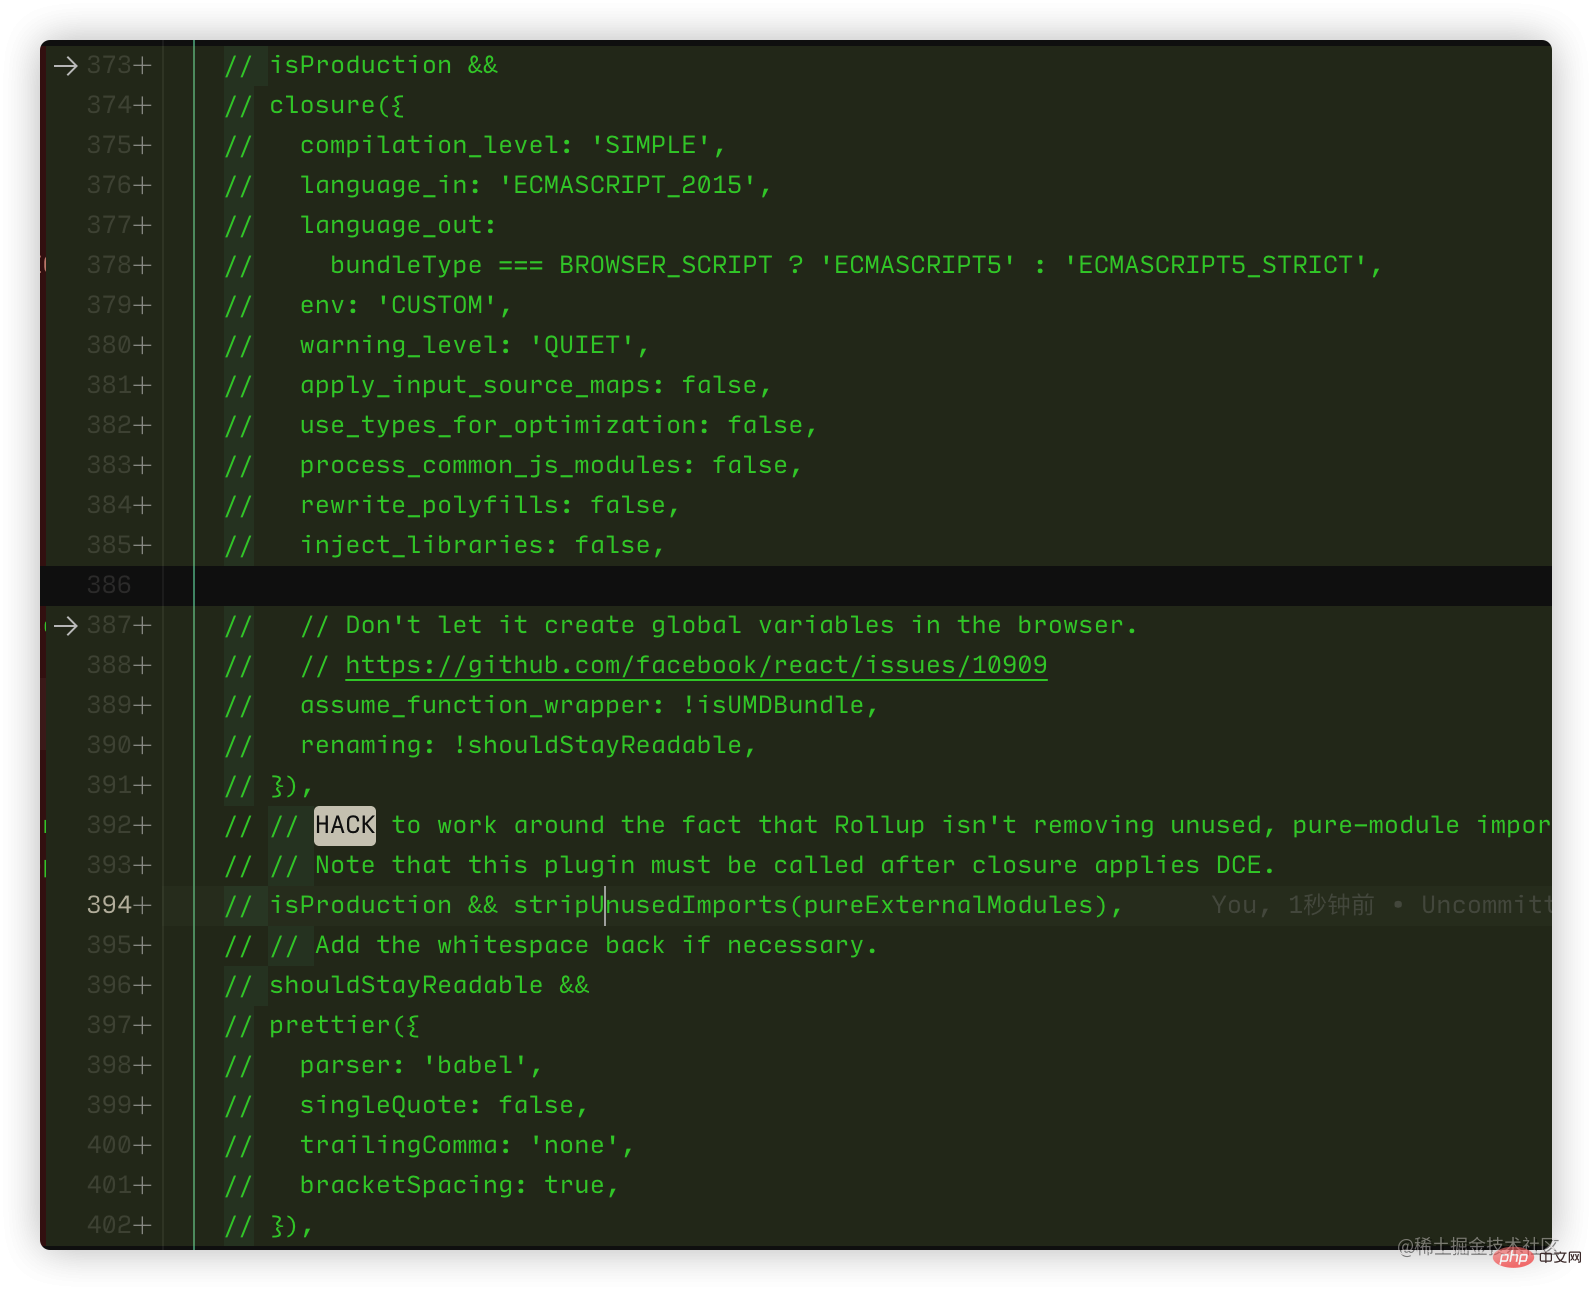 ok , it looks like a lot, but in fact they are all roughly connected together (353-355, 387-415). Several plug-ins have been commented out. At this time we can build
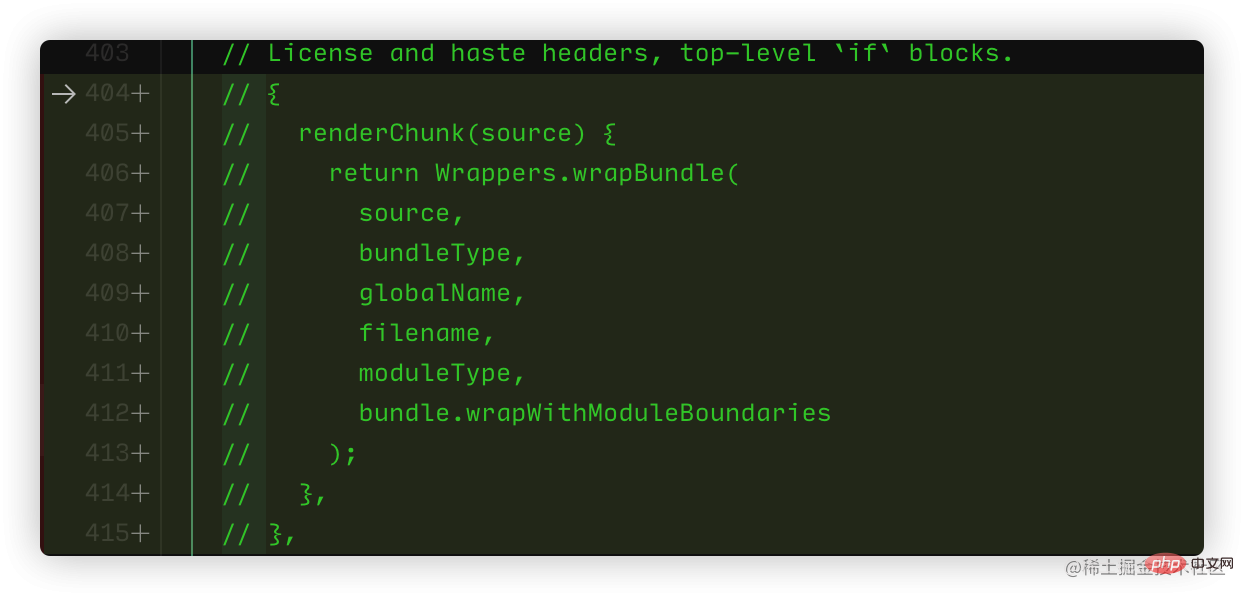
yarn build
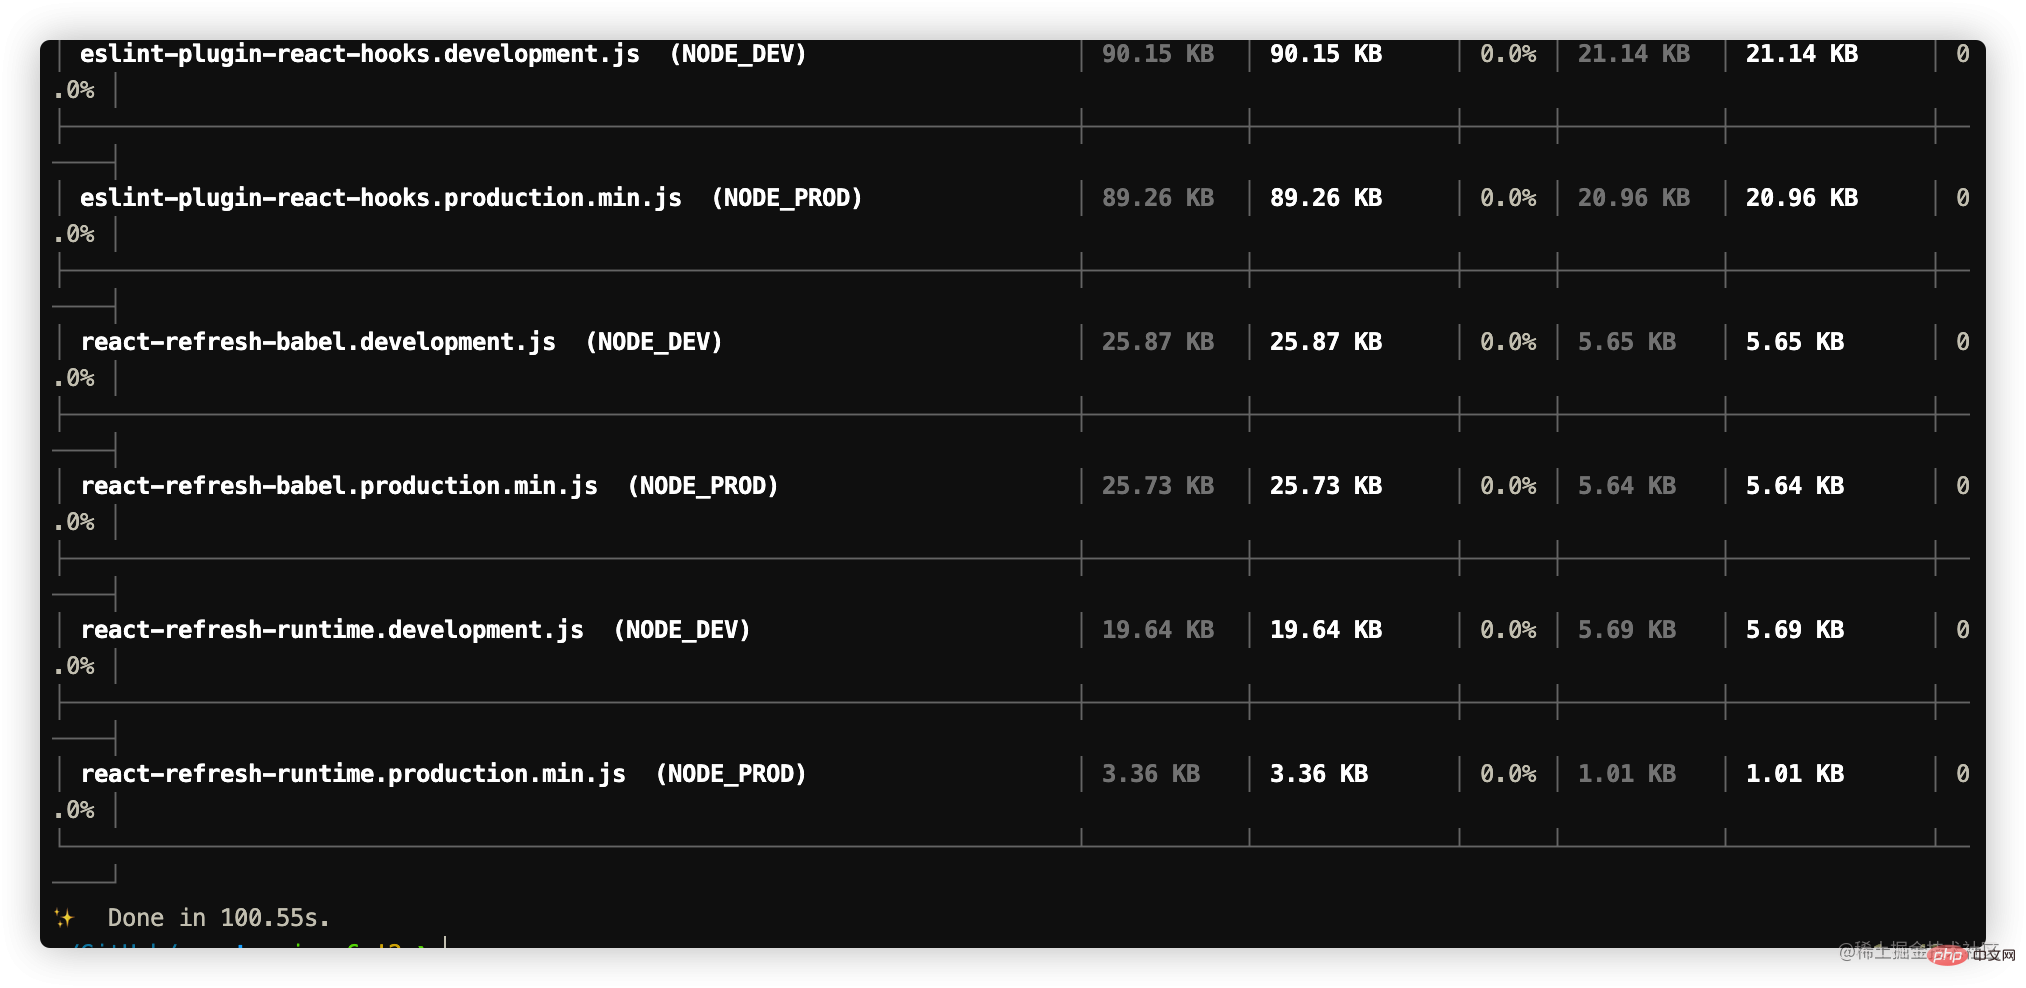
Note: If build If it fails, you will be prompted to install jdk. Just install it according to the error message.The successful results are as follows:
Perform debugger
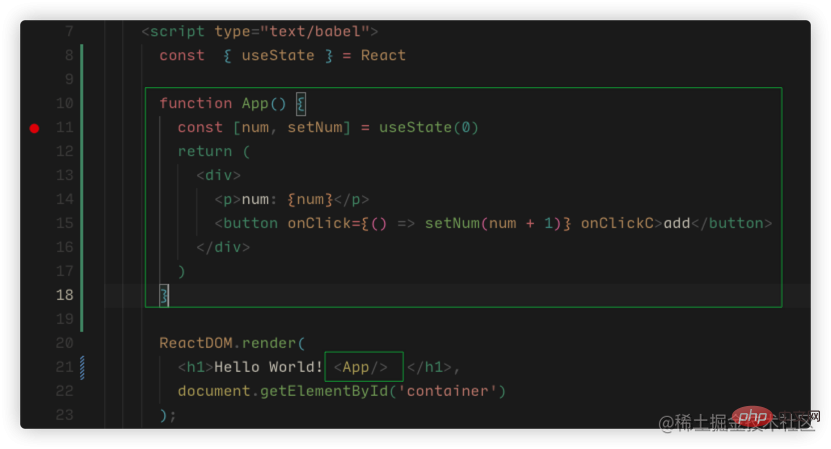
We followOfficial DocumentWe learned that the basic development file directory is in /fixtures/packaging/babel-standalone/dev.html, so we first performed a simple debug configuration based on the html.
vscode
1. Create alaunch.json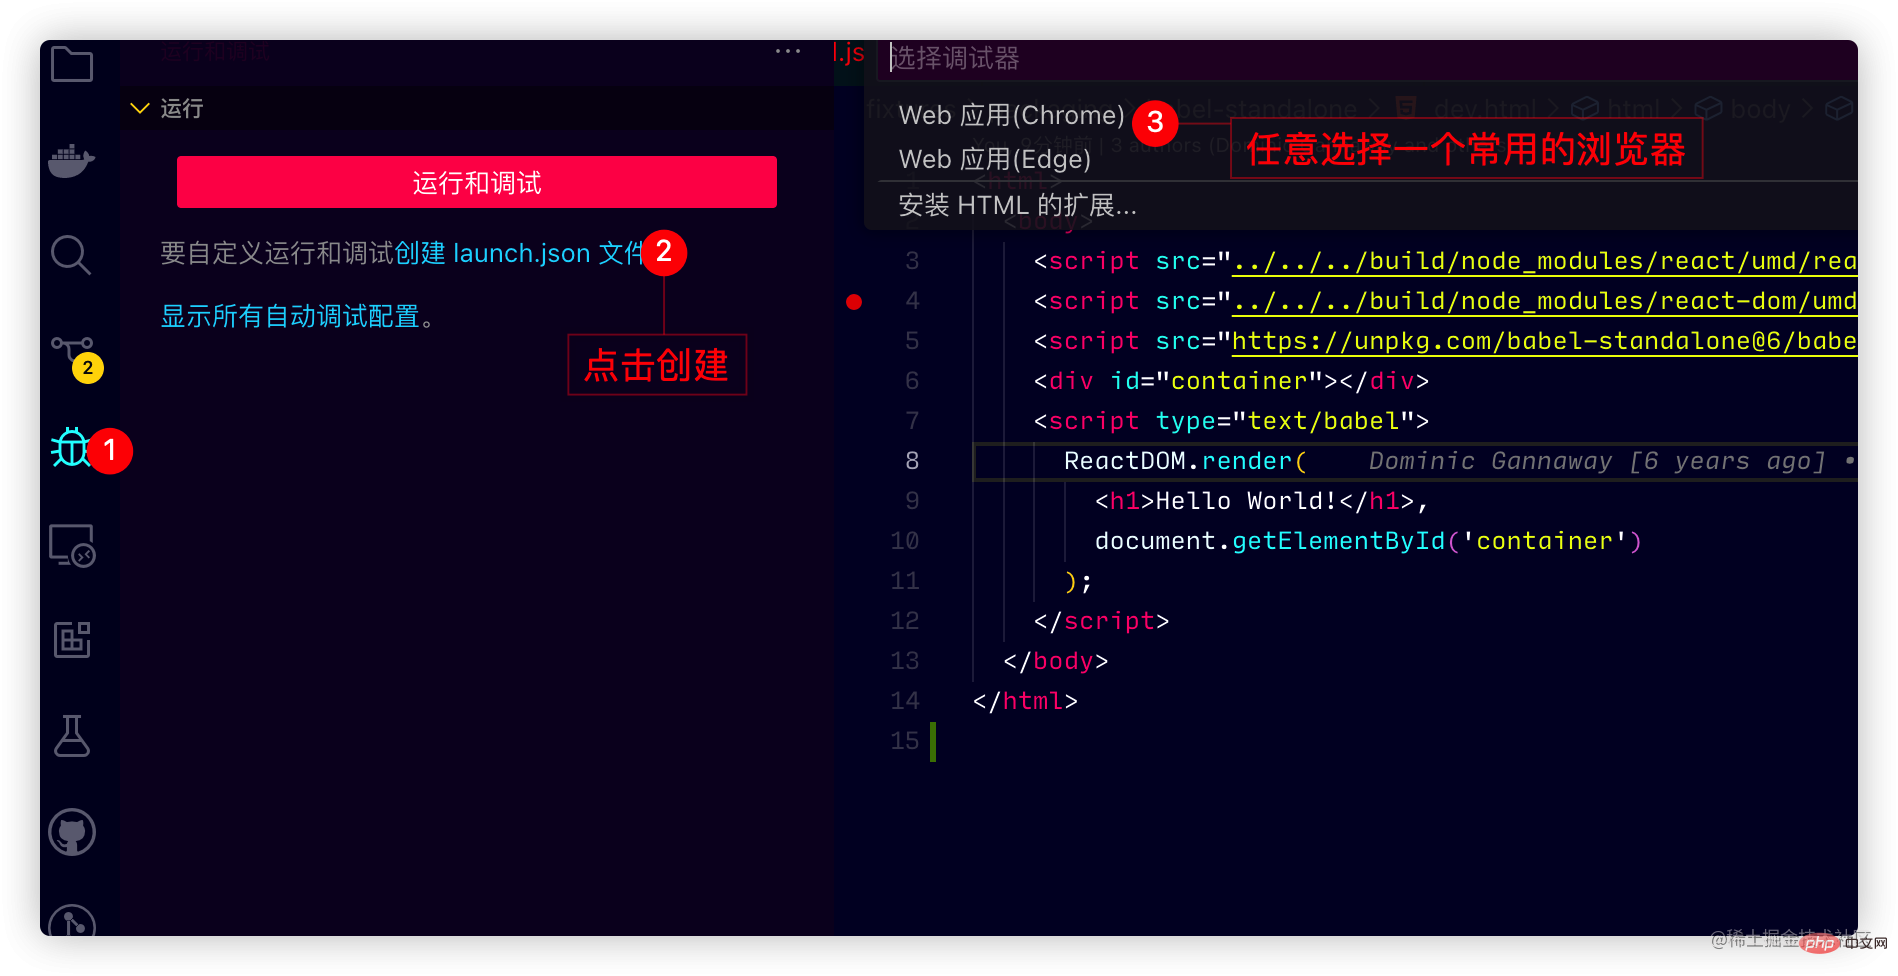
launch.json Configuration
{
  // 使用 IntelliSense 了解相关属性。
  // 悬停以查看现有属性的描述。
  // 欲了解更多信息,请访问: https://go.microsoft.com/fwlink/?linkid=830387
  "version": "0.2.0",
  "configurations": [
    {
      "type": "chrome",
      "request": "launch",
      "name": "Open dev.html",
      // 这里路径可能不一样 做统一调整 修改为如下
      "file": "${workspaceFolder}/fixtures/packaging/babel-standalone/dev.html"
    }
  ]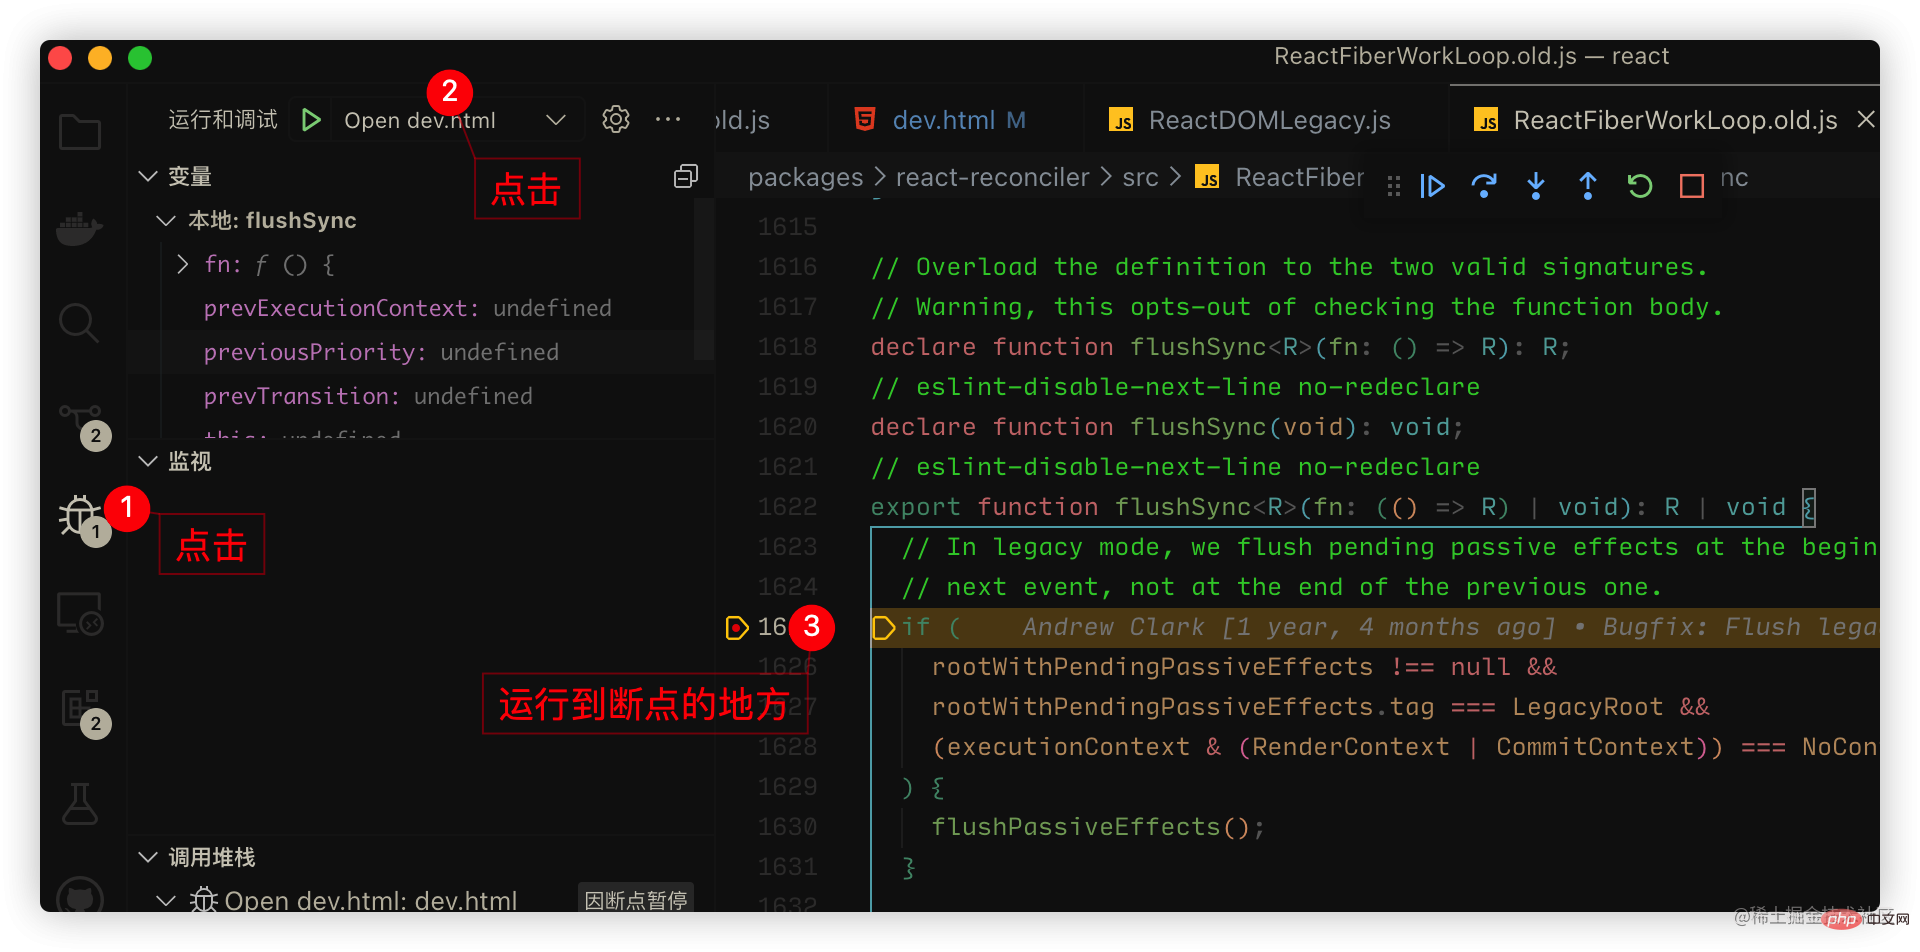
}Note: We already have the sourcemap at this time, directly In/packages/react-dom
or/packages/react, the code will run until the breakpoint is set
webstrom
webstrom is very simple. Just right-click on dev.html to debugdev.html: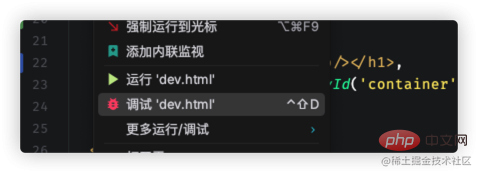
Debug in create-react-app
We usually run projects based on create-react-app or vite, we can use npm link to debug Source code link. The above case is suitable for react developers and has met a small part of your needs. However, most of us usually run projects based on create-react-app or vite. We can link it through npm link. . ①: Create a create-react-app project ②: Linkreact,react-dom to the global in the React project.
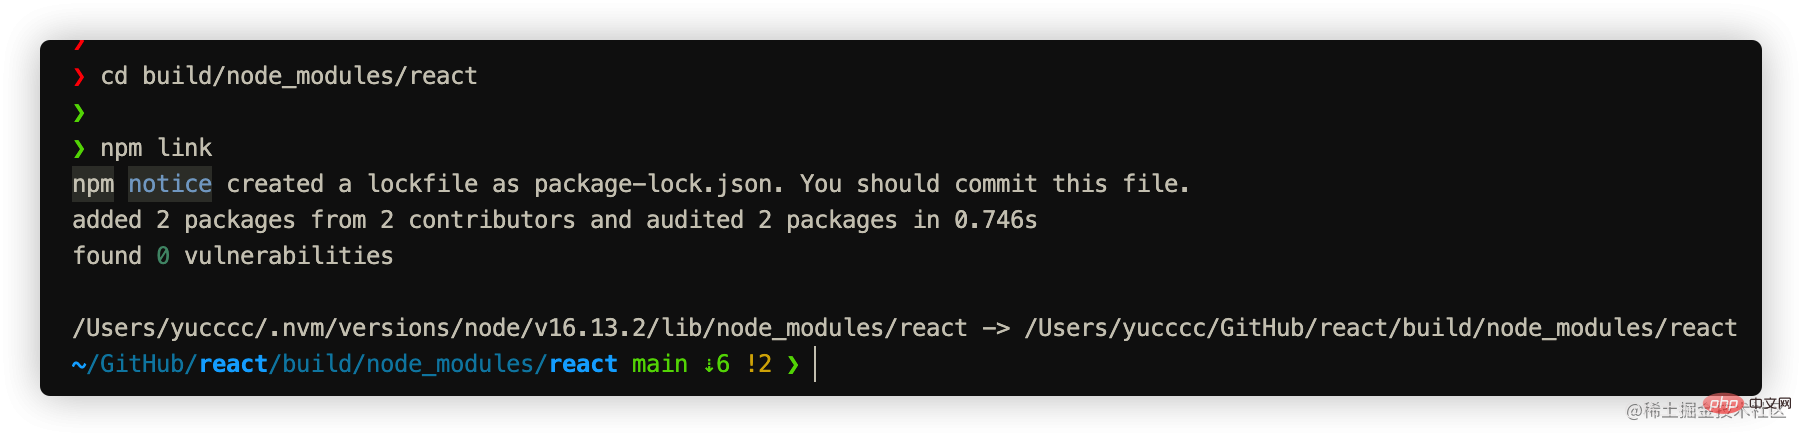
Note: You need to execute it according to your actual current location. In short, go toThe following is a successful one:build/node_modules/react
andbuild/node_modules/react-domJust executenpm linkseparately.cd build/node_modules/react && npm linkCopy after login
cd .. && cd react-dom && npm link
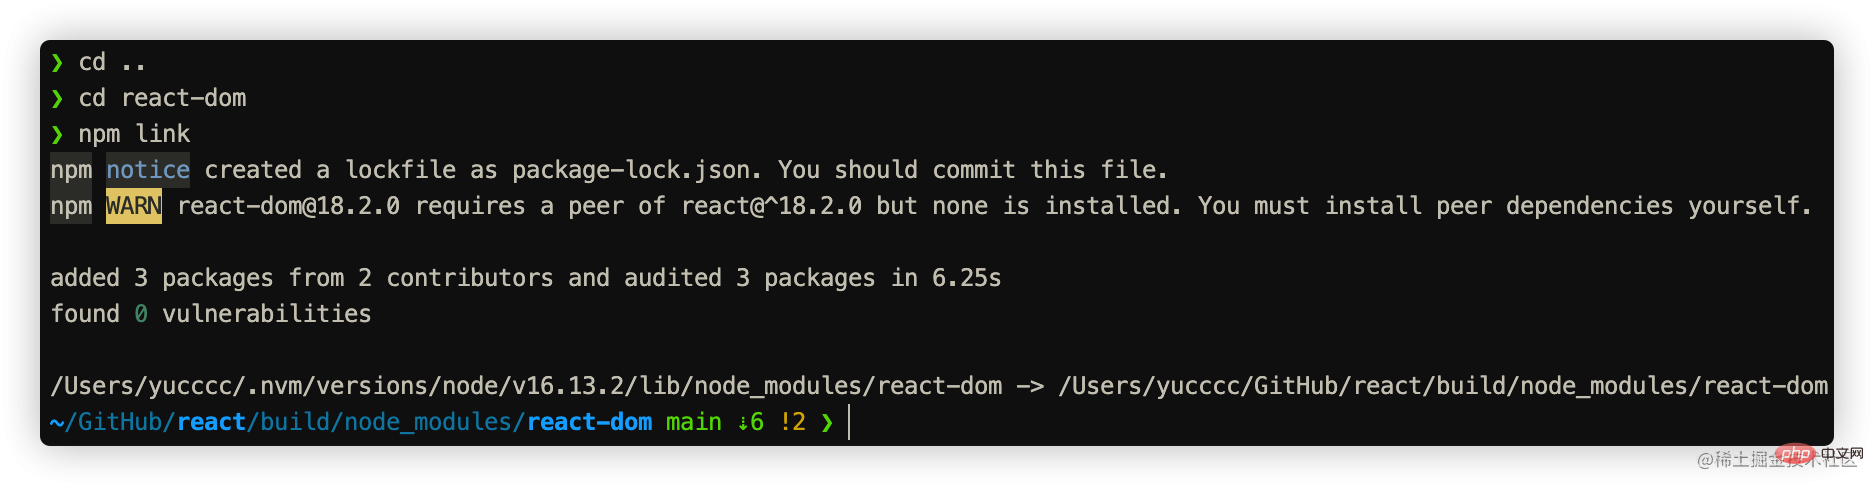
③: 在create-react-app的项目中link react与react-dom
npm link react react-dom
大功小成,接下来开始正式的debugger.
vscode如何debugger
官方已经给出部分文档, 参考文档: 文档
- 先启动项目
yarn start - 增加launch.json配置: 文档
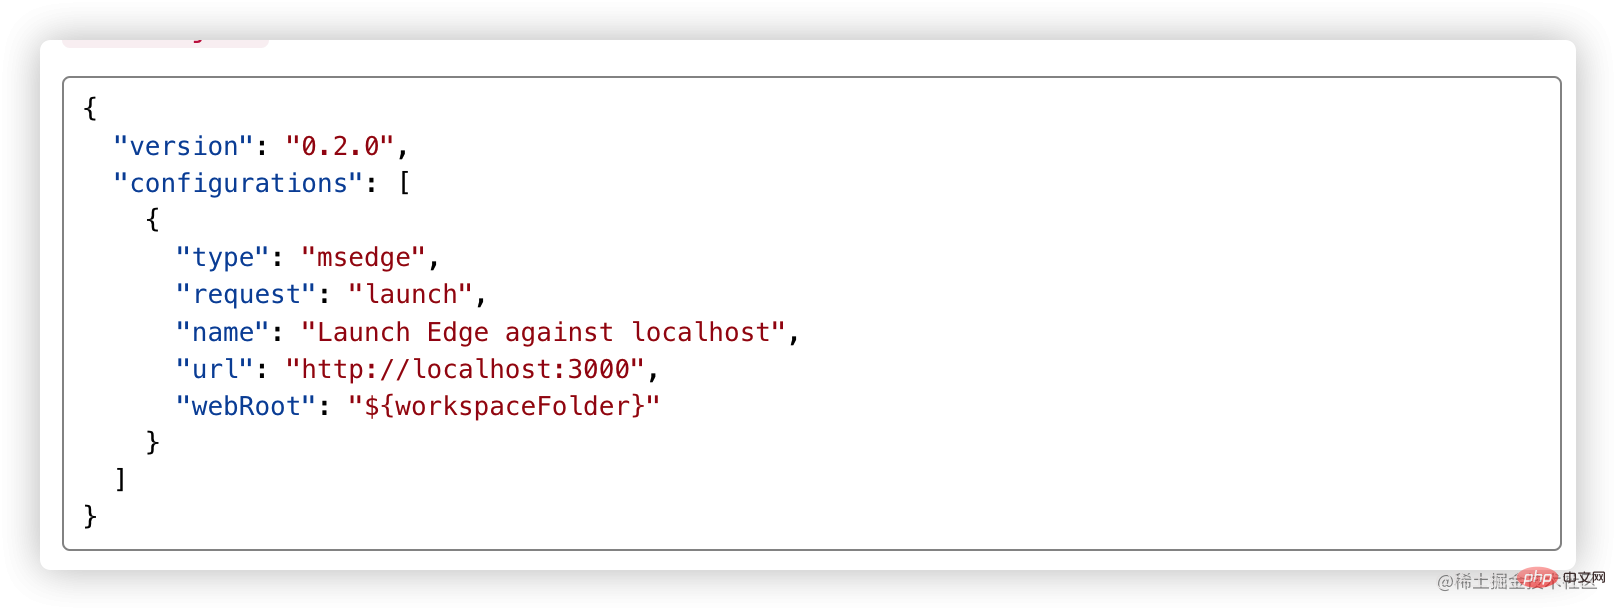
注意:
1、如果你项目端口进行了修改,需要把上方的端口也做修改.
2、官方提供的是edge浏览器,如果你想改谷歌浏览器只需要把type修改为chrome
笔者的配置如下:
{
  "version": "0.2.0",
  "configurations": [
    {
      "type": "chrome",
      "request": "launch",
      "name": "调试creat-react-app源码",
      "url": "http://localhost:3000",
      "webRoot": "${workspaceFolder}"
    }
  ]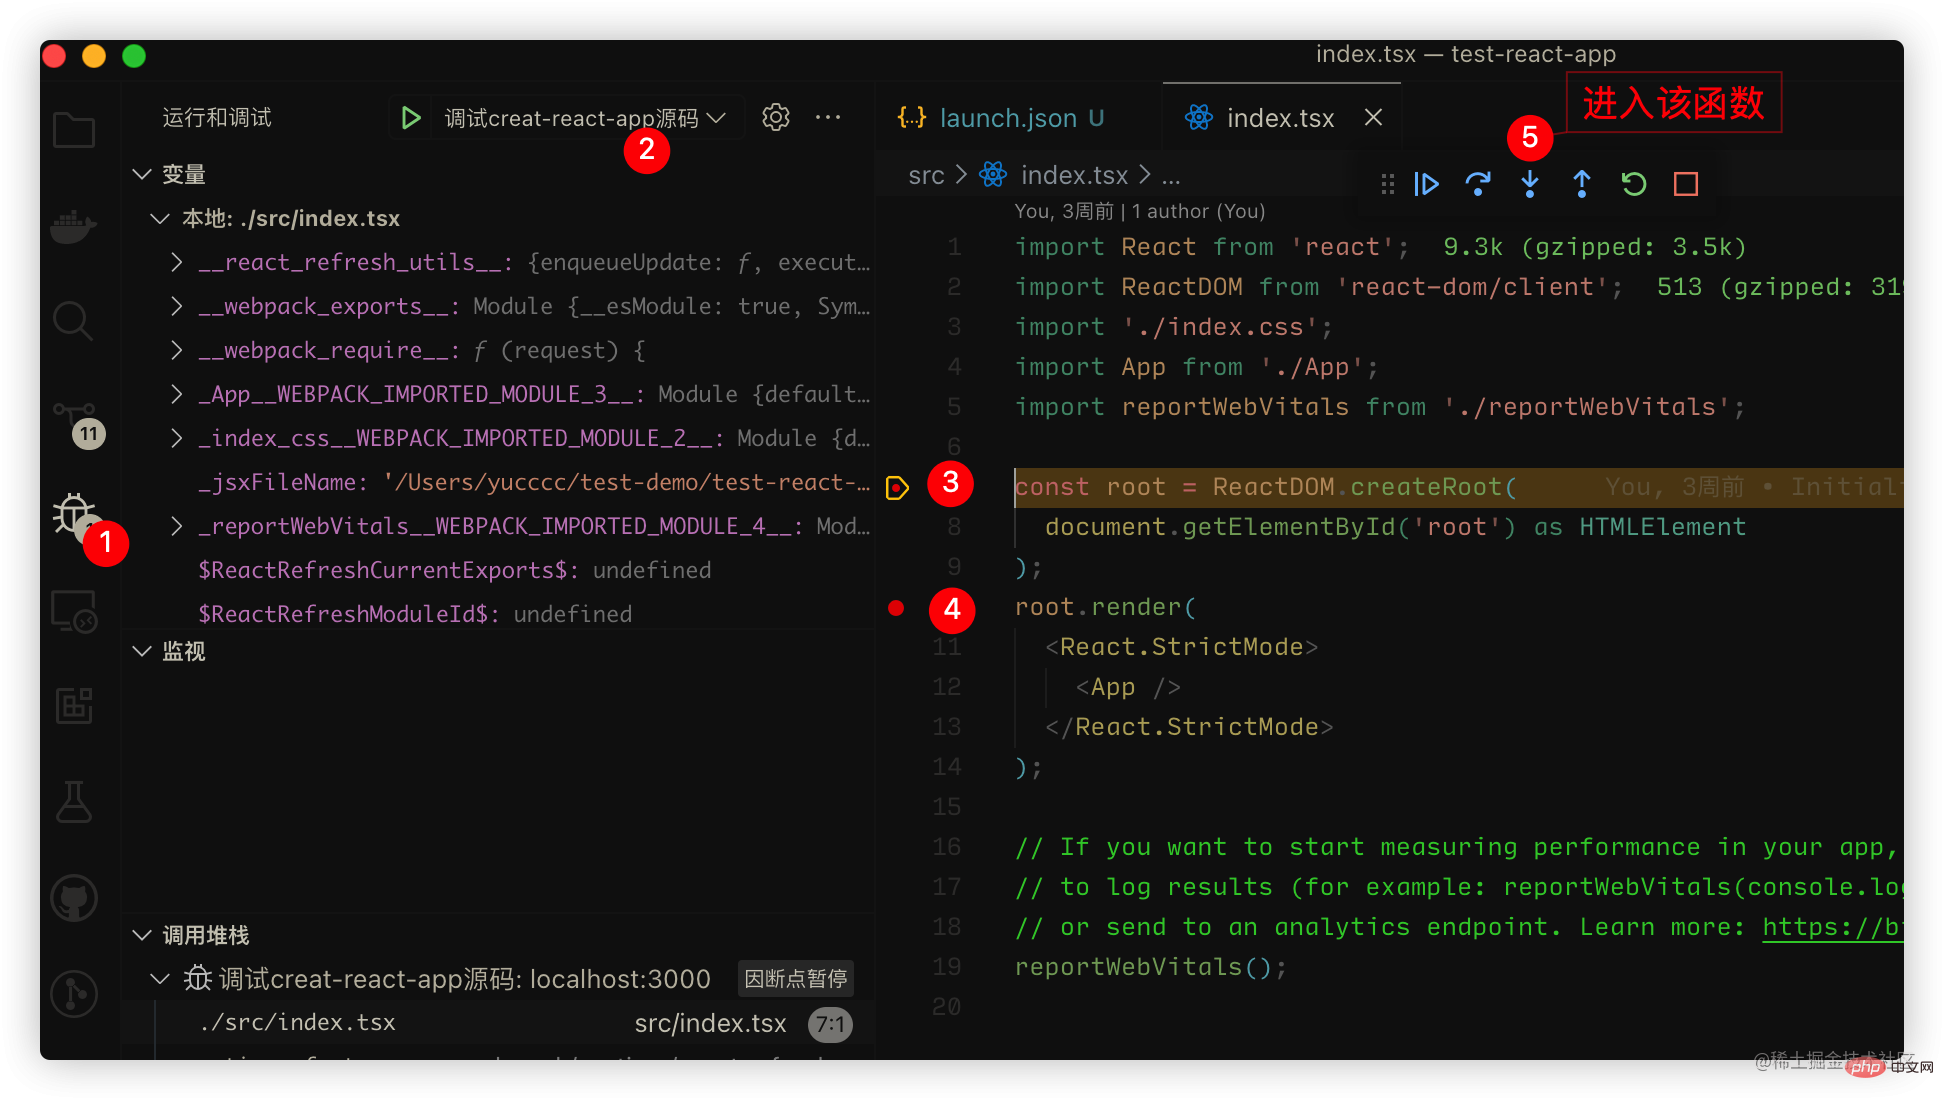
}- 找个位置打上断点进行调试
 ③、④为我打上断点的位置,点击 ⑤ 即可看到进入源码啦(可能要多点几下)
 ③、④为我打上断点的位置,点击 ⑤ 即可看到进入源码啦(可能要多点几下)
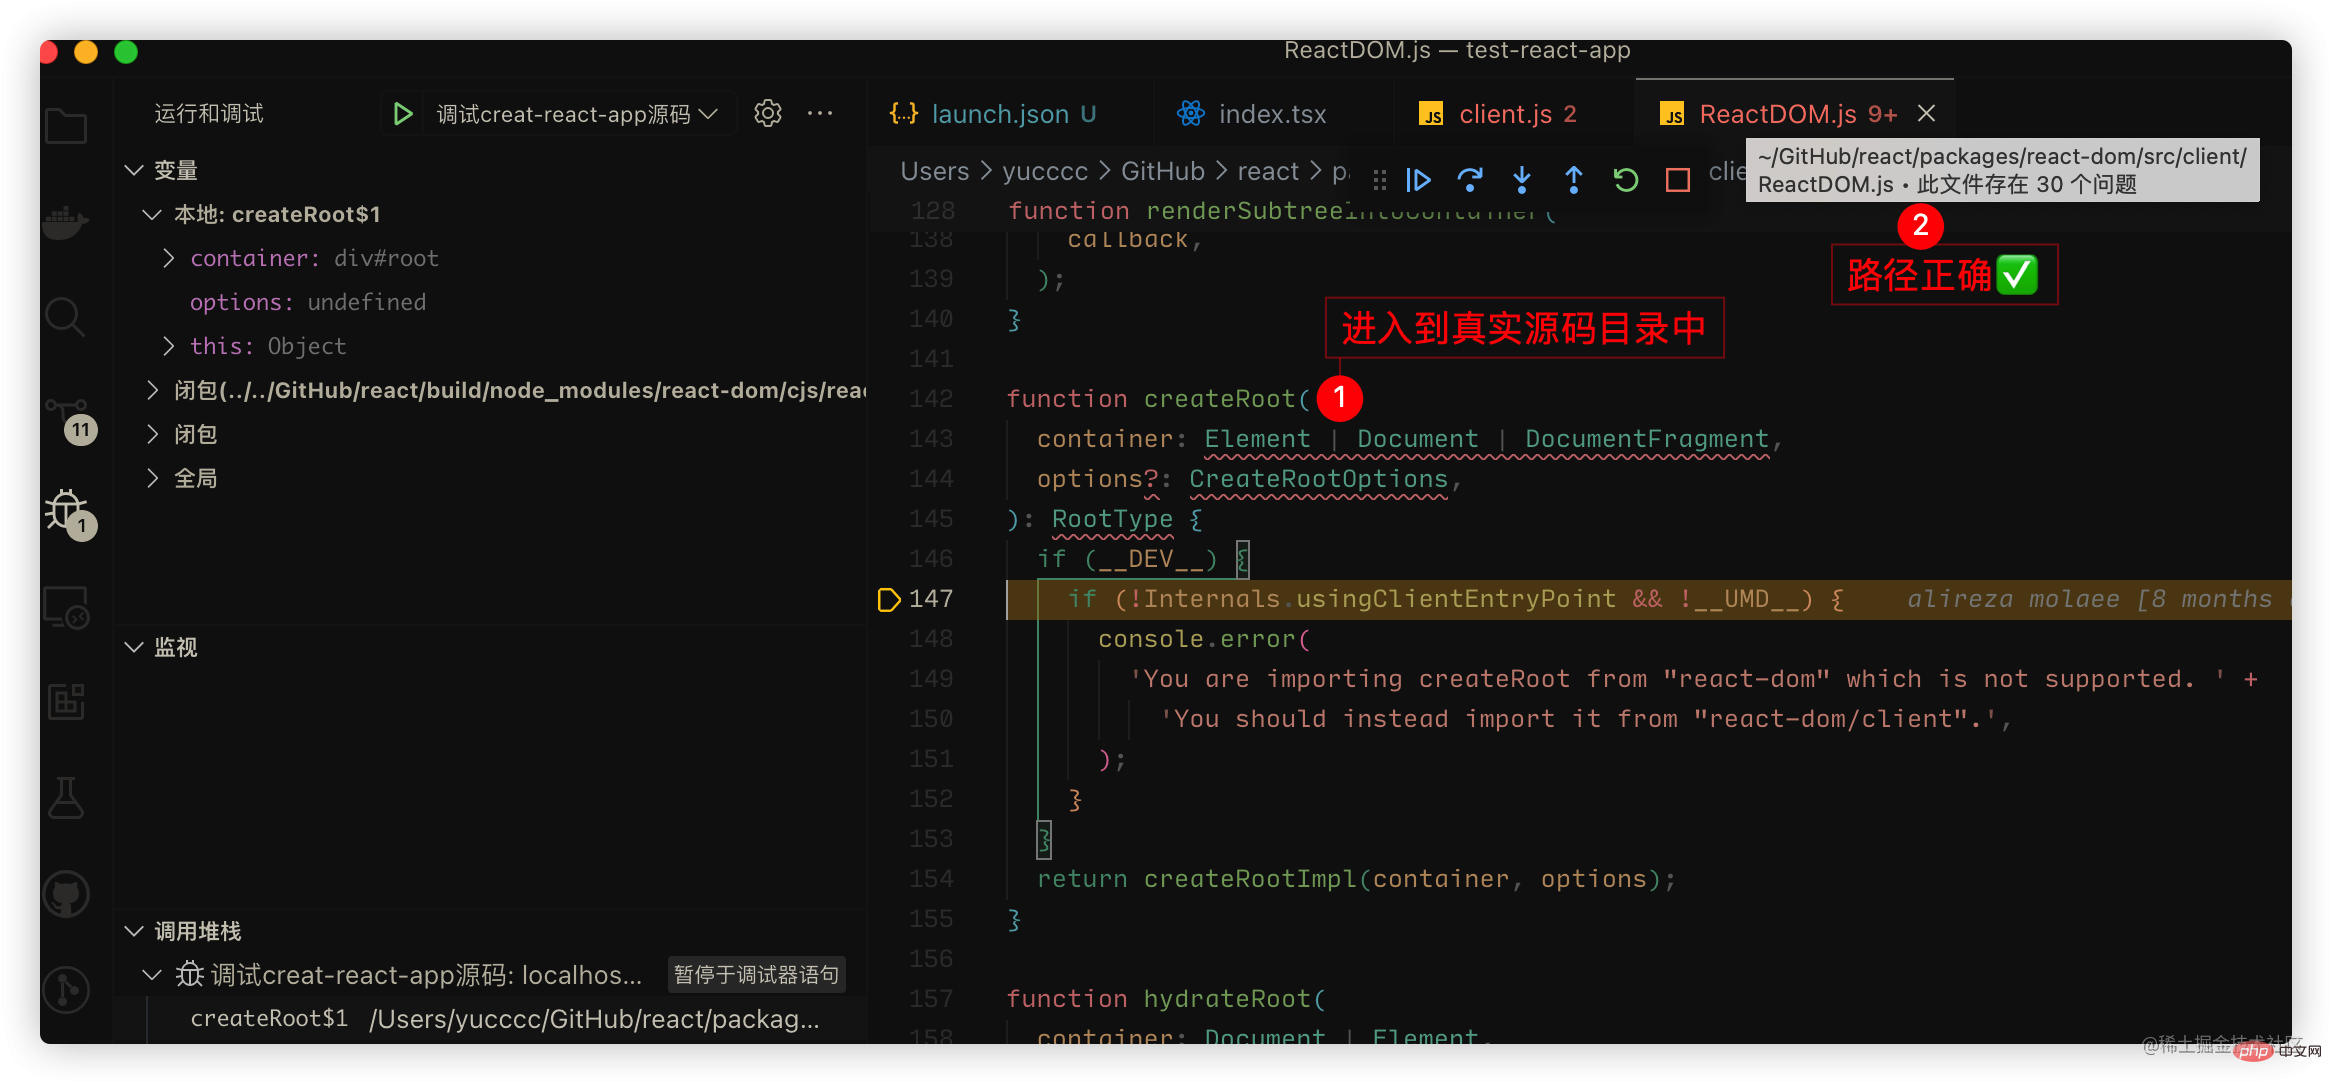
至此:我们已经大功告成,可以进行源码调试。
webstrom如何debugger
webstorm就显得十分简单,参考官方文档: 文档
- 打上断点
- 启动项目 yarn start
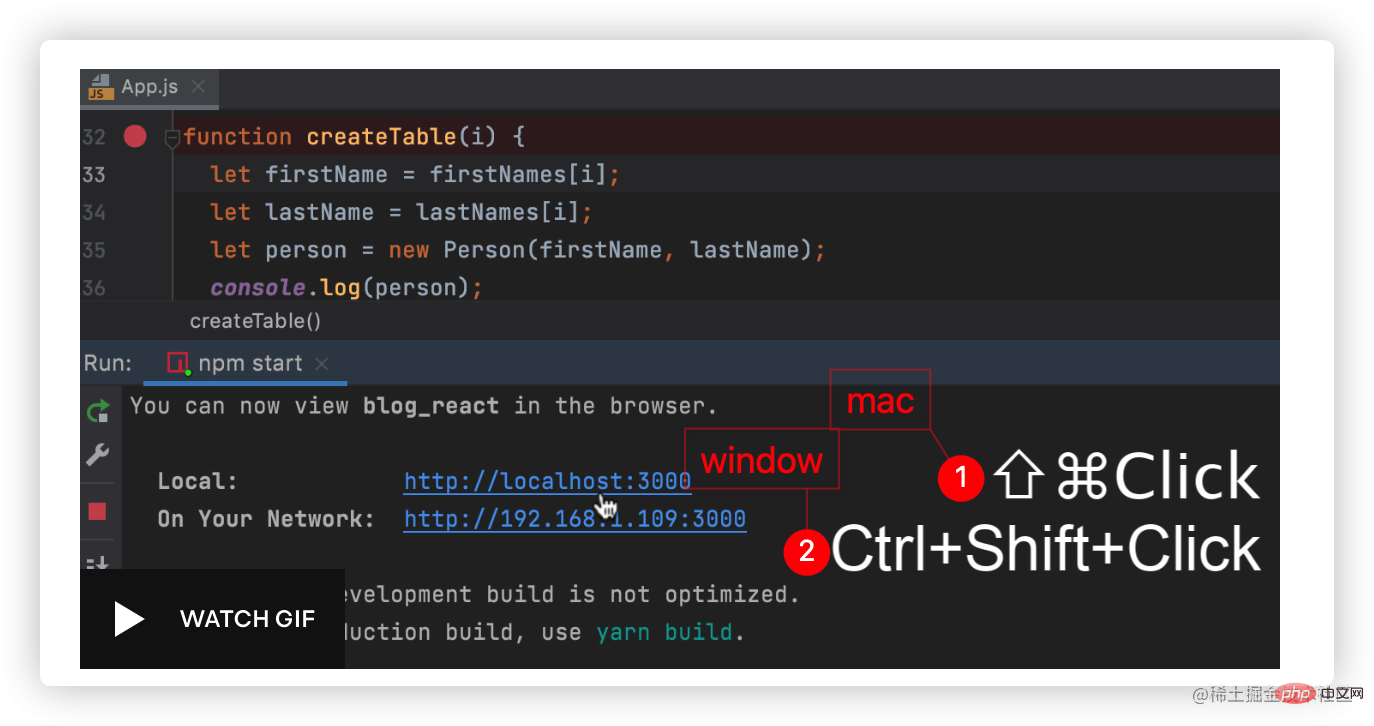
- 使用按键打开调试面板, 文档
调试React vite项目
和上方一致,也是通过link
总结:
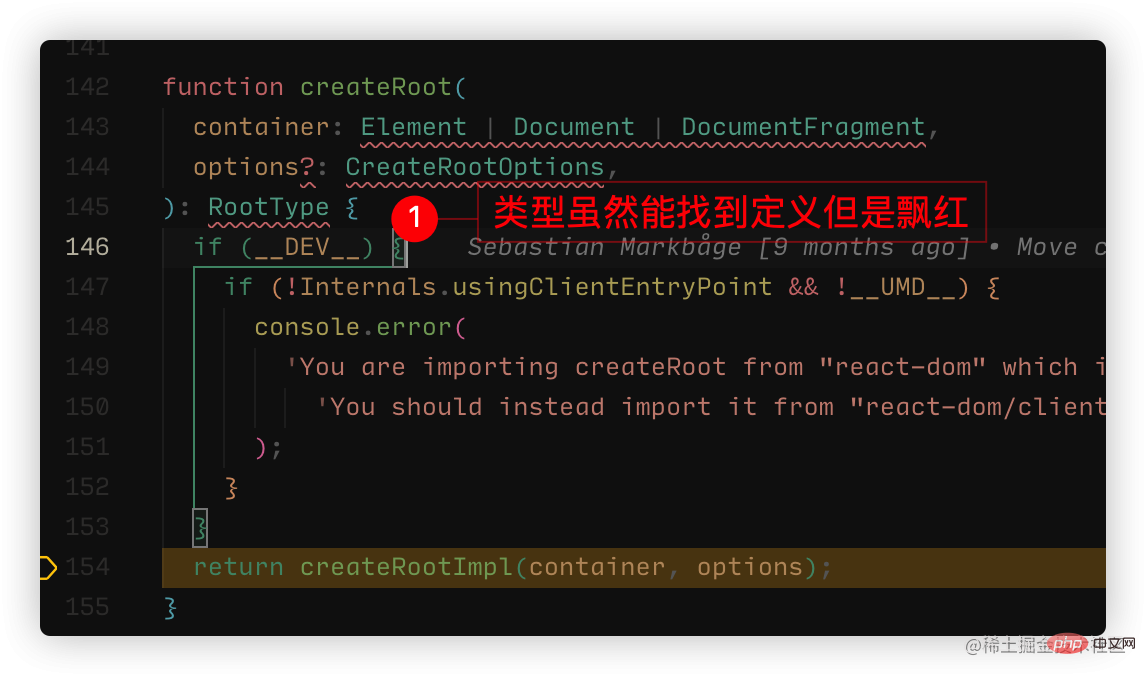
调试源码的逻辑核心在于sourcemap,但是我们不难发现其中存在一些问题:
1、当前我们跨项目进行调试(源码在react项目中,我们的项目在另外一个文件中),导致类型管理出现问题, 这是基于开发项目的定义管理,不同编辑器表现不同.
- vscode这是因为vscode默认解析ts的,但是不会默认识别flow的语法,所以这种的代码会解析成ts语法,就会报错,我们在项目增加
.vscode/settings.json增加配置:
 这是因为vscode默认解析ts的,但是不会默认识别flow的语法,所以这种的代码会解析成ts语法,就会报错,我们在项目增加
 {
"javascript.validate.enable": false
}即表现正常,不再报错: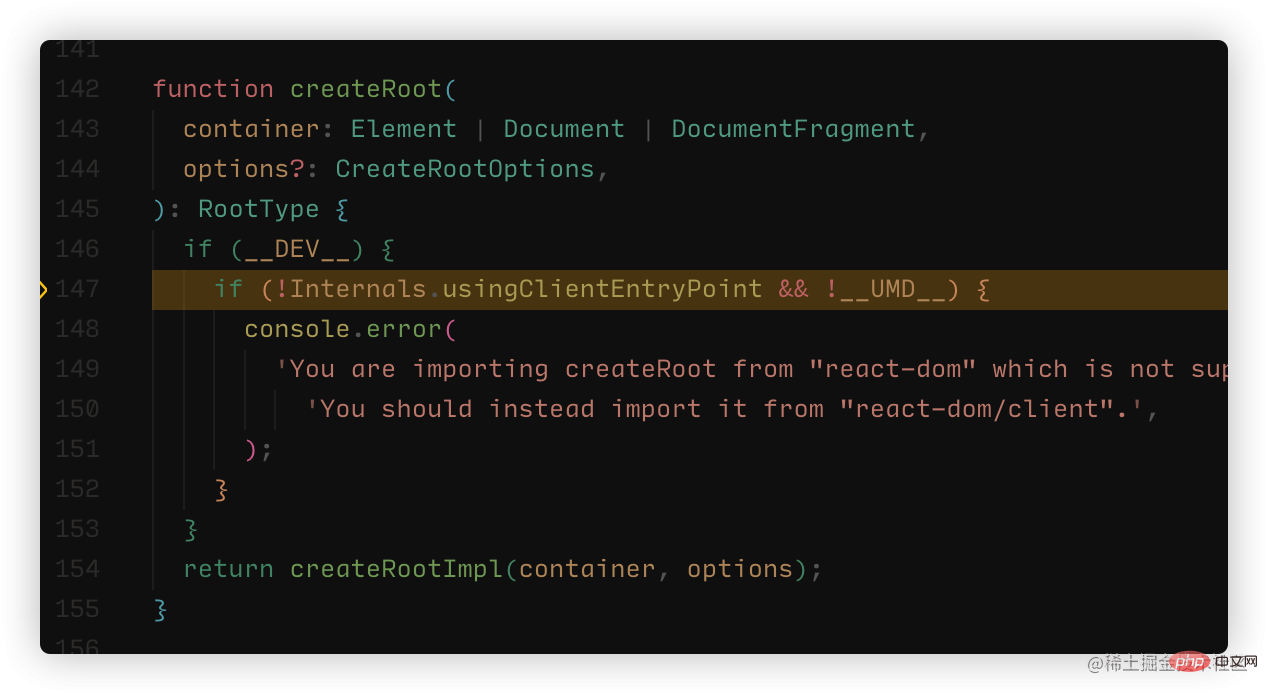
- webstorm
webstrom则是无法找到定义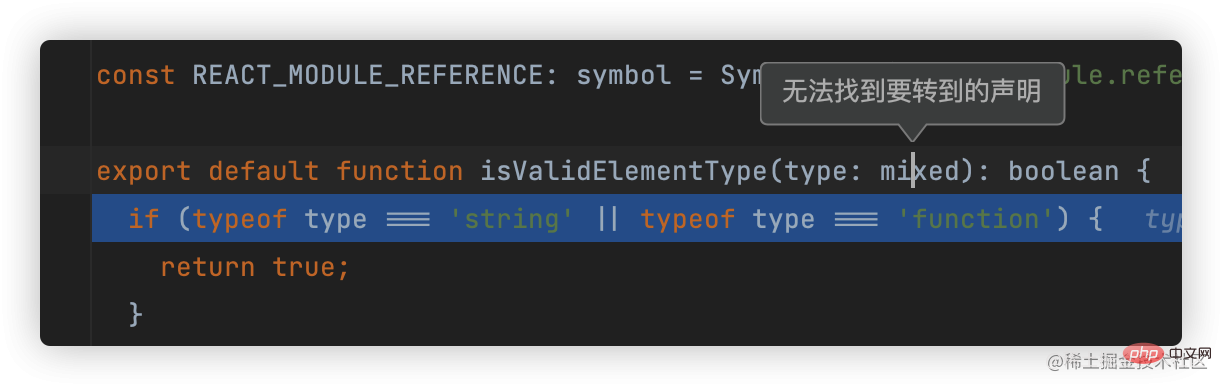
更多关于VSCode的相关知识,请访问:vscode基础教程!
The above is the detailed content of How to debug React source code? Introduction to debugging methods using multiple tools. For more information, please follow other related articles on the PHP Chinese website!

Hot AI Tools

Undresser.AI Undress
AI-powered app for creating realistic nude photos

AI Clothes Remover
Online AI tool for removing clothes from photos.

Undress AI Tool
Undress images for free

Clothoff.io
AI clothes remover

Video Face Swap
Swap faces in any video effortlessly with our completely free AI face swap tool!

Hot Article
Hot Tools

Notepad++7.3.1
Easy-to-use and free code editor

SublimeText3 Chinese version
Chinese version, very easy to use

Zend Studio 13.0.1
Powerful PHP integrated development environment

Dreamweaver CS6
Visual web development tools

SublimeText3 Mac version
God-level code editing software (SublimeText3)
Hot Topics
 1386
1386
 52
52

 How to solve webstorm crash
Apr 08, 2024 pm 02:24 PM
How to solve webstorm crash
Apr 08, 2024 pm 02:24 PM
Steps to resolve WebStorm crash issues: Check for updates; Restart your computer; Disable plugins; Reset settings; Clear cache; Check firewall and antivirus software; Reinstall WebStorm; Contact support.
 How to run jsp project in webstorm
Apr 08, 2024 pm 03:39 PM
How to run jsp project in webstorm
Apr 08, 2024 pm 03:39 PM
You can run a JSP project in WebStorm by following these steps: Create a Java Web project. Configure the project and add Web and Java EE facets. Create the JSP file in the "src/main/webapp" directory. Write JSP code including HTML, Java and JSP tags. Deploy and run the project. Access the JSP page by entering the application context root in your browser.
 How to connect to the database in webstorm
Apr 08, 2024 pm 03:42 PM
How to connect to the database in webstorm
Apr 08, 2024 pm 03:42 PM
You can use WebStorm to connect to the database through the following steps: 1. Open the database tool window; 2. Create a data source; 3. Connect to the data source; 4. Query the database; 5. Browse tables and data; 6. Edit database objects; 7. Manage Users and permissions.
 Where is webstorm's automatic line wrapping?
Apr 08, 2024 pm 08:09 PM
Where is webstorm's automatic line wrapping?
Apr 08, 2024 pm 08:09 PM
Automatic line wrapping can be set in WebStorm by following these steps: Check the "Wrap lines" checkbox and set the maximum line width. Select automatic line wrapping rules: None, line wrapping at any position, or line wrapping after keywords. Optional settings: retain manual line wrapping and automatic line wrapping after carriage return. Apply the settings and close the settings window. Note: This setting applies to all file types and can be set individually for specific file types.
 How to restart webstorm
Apr 08, 2024 pm 07:15 PM
How to restart webstorm
Apr 08, 2024 pm 07:15 PM
To restart WebStorm, follow these steps: Use the shortcut keys: Windows/Linux: Ctrl + Shift + A, macOS: Cmd + Shift + A. Enter "restart" in the search field and select "Restart". Using the menu: Click the File menu and select Restart under Reload. Using Task Manager: In Task Manager or Force Quit the application window, select the WebStorm process and click Restart or Restart.
 How to automatically wrap lines in webstorm
Apr 08, 2024 pm 03:48 PM
How to automatically wrap lines in webstorm
Apr 08, 2024 pm 03:48 PM
WebStorm provides automatic line wrapping, which breaks code into separate lines to improve readability. Its rules include: 1. Branch long expressions and statements; 2. Branch method calls; 3. Branch functions and class definitions. User-customizable settings such as maximum line length, indentation type, and shortcut keys. However, word wrapping may not work with single-line comments or string literals and will affect code formatting, so careful review is recommended before application.
 Which one is easier to use, webstorm or vscode?
Apr 08, 2024 pm 07:33 PM
Which one is easier to use, webstorm or vscode?
Apr 08, 2024 pm 07:33 PM
For developers who focus on web development and pursue deep functionality, WebStorm is a better choice; while users who value customizability, lightweightness, and multi-language support are more suitable for VSCode.
 How to return to the login interface in webstorm
Apr 08, 2024 pm 02:12 PM
How to return to the login interface in webstorm
Apr 08, 2024 pm 02:12 PM
To return to the WebStorm login screen, follow these steps: Click the File menu and select Log Out. Confirm logout and enter login credentials.
