Image algorithm helps improve efficiency and transfer product review
1. Product review background introduction
Zhuanzhuan is an e-commerce platform that mainly engages in second-hand commodity transactions. Depending on the transaction entities, C2C, C2B, B2C and other transaction relationships can be formed. For example, it is a C2C model for individual users to publish products for sale in the free market of Zhuanzhuan app. Zhuanzhuan company provides C2B services of mailing and door-to-door recycling of mobile phones and other electronic products. Zhuanzhuan app also provides second-hand B2C products with official inspection and warranty and after-sales service. . This article will focus on the application of image algorithms in the review process of product listings in Zhuanzhuan B2C stores.
Due to the non-standard nature of second-hand goods, there are differences in quality even among different inventory goods under the same sku. In order to improve the user experience and increase the transparency of product information, the platform uses real-shot product images when displaying second-hand products and avoids the use of rendered images of standard products. This involves reviewing the relevant display pictures of each product on the shelves in various aspects such as information accuracy and picture quality.
In the early stage of business development, the relevant display pictures of the products on the shelves are manually reviewed to ensure the quality and accuracy of the pictures. The review content mainly includes the following aspects:
- Display pictures Whether it is consistent with the actual product to avoid the situation of "the goods are not on the board";
- Whether the photos of the display pictures are clear, camera focus errors may occasionally occur during the shooting of product pictures in streamlined operations;
- Electronic products such as mobile phones and tablets need to be guaranteed to be free of dirt and have anti-tampering labels attached to key parts;
- In order to display the product images in the app, the product images must be appropriately cropped so that the products can be displayed in the app. Centered in the picture.
With the development of business, more and more products are put on the shelves every day, and manual review gradually exposes some problems in review efficiency and accuracy:
- The review work is boring , prone to fatigue, and the probability of errors in manual review is high;
- The judgment of picture clarity is subjective, and it is difficult to align the review standards between different reviewers;
- The amount of manual review processing has gradually It lags behind the number of products on shelves, creating a bottleneck for the release of products in stores.
In view of the repetitive work in the review content, we use classification, regression, detection and other technologies related to the image field, and use algorithm model output to assist manual judgment, while improving the accuracy of the review results At the same time, the efficiency of the review process has been greatly improved.
2. Automatic review plan
The content that needs to be reviewed during the shelf review includes the following points:
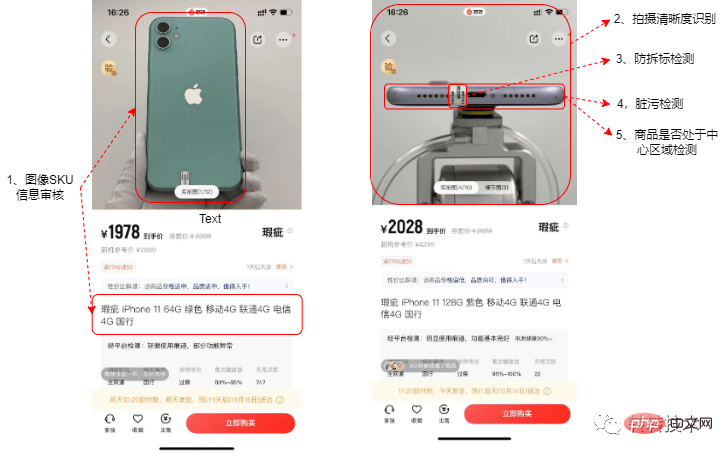
- Whether the product display picture is consistent with the corresponding SKU information.
- Whether the product photography is clear.
- Whether the product has an anti-tampering label.
- Whether the product is dirty.
- Whether the product is in the center area of the image.
In view of the need for review, we have designed the following solutions:
Project solutions that require review Whether the product display picture and the corresponding SKU are consistent Whether the image matches the product photo Clear return plan Whether the product has an anti-tampering label Detection plan Whether the product is dirty Detection plan Whether the product is in the center area of the image Detection plan
The following figure gives a schematic diagram of the main review items for B2C product shelf review:

Audit sample pictures
2.1. Whether the product display picture and the corresponding SKU information are consistent
All goods sold in the mall need to be reviewed The actual product is photographed and displayed, but during the process of putting the product on the shelves in the mall, due to manual errors and other circumstances, the product display image and the corresponding SKU information may not match. To give a simple example, the SKU information of the product is iphone11-red, but the display picture is iphoneX-green. This problem can correspond to the image classification problem, which is equivalent to determining the product category based on image information. However, simply using the classification algorithm cannot solve our problem well. There are the following problems in using classification directly:
The categories are limited. Regardless of whether the input image is in the category, a category will be output.
Due to the fixed category, newly added sku cannot be processed.
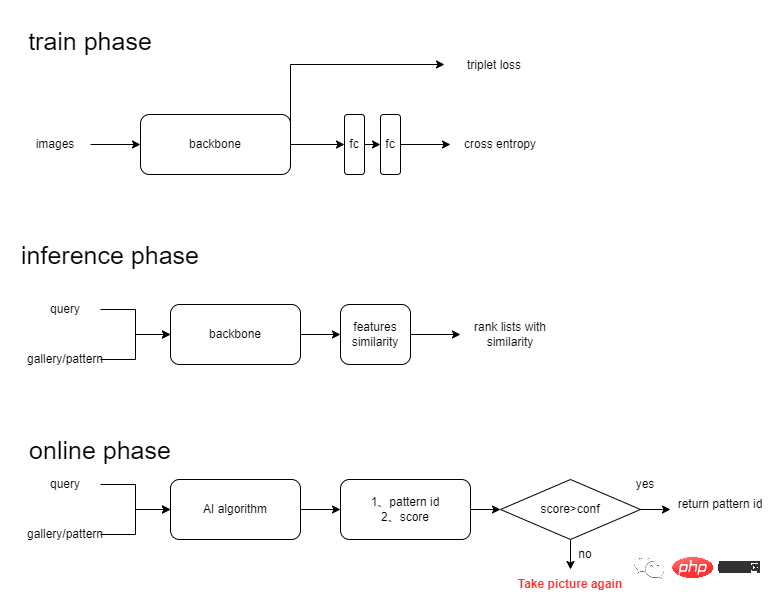
Due to the above problems with the classification method, we changed the strategy and used an image matching scheme. By training a better feature extractor and then using the image matching scheme, we can better solve the problem of adding new categories. The solution we selected is basically consistent with the academic solutions in Face Recognition, Person Re-Identification, Image Retrieval and other directions. The main process includes image feature extraction, image similarity calculation, sorting, and output results. Among them, image feature extraction is the focus of our research. Traditional image matching features include SIFT, SURF, ORB features, etc. Image feature extraction based on deep learning mainly uses CNN neural network for feature extraction. The picture below shows our plan:

Commodity suk review plan
Training phase: The training phase mainly uses cross-entropy loss combined with triplet loss to train a classification network. The backbone network has tried MobileNet, ResNet, ShuffleNet, OSNet, etc. Our experimental results show that the accuracy of the ResNet model is slightly higher, so ResNet is selected as our backbone network.

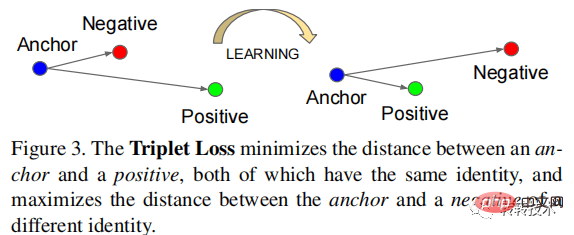
Triple example
Formula 1 gives the binary cross-entropy loss function, where represents the output value of the sample and represents the label corresponding to the sample. Formula 2 gives the triplet loss function, which represents the feature vector corresponding to the anchor sample, represents the feature vector corresponding to the sample of the same category as the anchor sample, and represents the feature vector corresponding to the sample of a different category than the anchor sample. In the feature space, the distance between the negative sample and the anchor point sample minus the distance between the positive sample and the anchor point should be greater than .
The cross-entropy loss function is a common classification loss function, and the triplet loss function is a commonly used loss function in face recognition and pedestrian re-identification. The triplet loss function can make the features appear in clusters in the feature space. The benefit is that more robust features can be obtained. If the triplet loss function is used alone, the model converges slowly, so we use cross-entropy loss and triplet loss for joint supervised learning to accelerate model convergence and improve model accuracy.
Testing phase: In the testing phase, the trained backbone is selected as the feature extractor to extract embedding features. Extract the query image features and calculate the cosine similarity with the features in the gallery library to obtain a similarity sorted list, and then select the category corresponding to the top1 image in the sorted list as the category output of the query image. But when we were building the gallery, one SKU stored three images, corresponding to different shooting scenes, so we performed knn on the top5 output and obtained the SKU corresponding to the query image.
Online operation: In order to ensure that the SKU output by the matching algorithm must be accurate, we output the top1 similarity in the sorted list. When the similarity is less than a certain value threshold, an alarm message will be output for manual review. This strategy ensures the accuracy of the SKU information output by the algorithm.
2.2. Is the product photographed clear?
During the process of photographing the product, the product moves or the focus is not correct, resulting in the product being photographed blurry. In order to provide users with a better shopping experience, we will return these products during the review process and re-take pictures of the products that meet the requirements before they can be put on the shelves. Simply focusing on whether the image is clear or not can be understood as an image classification problem. Since the labeling of whether an image is blurry is subjective, and the binary classification cannot describe the blurriness of the image well, in the actual review process, front-line reviewers often give different judgment results for slightly blurry images. This Such situations greatly affect the consistency of the review results, resulting in good or bad product display effects in the mall.
In order to solve the above problem, we divide the blurriness of the image into three levels. From high to low, the blurriness is obviously blurred, slightly blurred, and clear. And give the corresponding points, which are 2, 1, and 0 points respectively. Multiple people rate the same image, and remove images that are both clearly blurry and clear at the same time. The remaining images are numerically normalized to obtain the blur score of the image. Of course, we can subdivide the degree of blur into four categories, such as obvious blur, slight blur, subtle blur, and clear, and let more annotators mark the same picture, so that we can get more detailed label values, which can also bring better prediction results. However, in view of limited resources, we only divided the fuzziness into three levels and asked three students to annotate them. From this, we transform the binary classification problem into a regression problem, and can well isolate the business standards. The table below shows how we turn a classification task into a regression task.
Picture name: Classmate 1 points Classmate 2 points Classmate 3 points Total score (0-6) Normalized score Picture 1 is obviously blurred, slightly blurred, obviously blurred 55/6=0.83 Picture 2, slightly blurred, slightly blurred Obvious blur 44/6=0.67 Picture 3 clear Slightly blurry clear 10.17.............
Same, We still use convolutional neural networks, and then change the classification loss function into a regression loss function. We choose MSE as the loss function for the regression task, which represents the predicted value of the sample and represents the label of the sample.
The output value of the model represents the blur degree of the image. After we turn the binary classification task into a regression task, it can bring many benefits. The first is the decoupling of algorithm development and business, so that the algorithm model will not be invalidated due to changes in business standards; at the same time, the business side can set different fuzziness thresholds according to business needs to control the clarity of the mall image.
2.3. Whether the product has an anti-tampering label, whether it is dirty, and whether it is in the central area.
We use a detection solution to address whether the product has an anti-tampering label, whether it is dirty, and whether it is in the central area. . Among these three items, the detection of anti-tamper labels and items is relatively simple. In the detection of anti-tamper labels, the features of anti-tamper labels are single, so it is relatively easy to train a model with a high detection accuracy; if the product is centered during detection, the items are large, and the data is easy to collect, it is also possible to train a product with a high accuracy. Detection model.
The detection of contamination is more difficult because some contamination targets are small and samples are not easy to obtain. To address this problem, we choose an active learning strategy during the data collection process to find more positive samples (the positive samples in the detection task refer to the sample class we need to detect). The method is also very simple. We use a batch of data to train the detection model in the early stage, and then use the model to select suspicious positive samples from a large batch of unlabeled data with very low confidence, and then let the batch of data be manually labeled. Then the training model is updated with new data, which is a cycle. We can repeat this step multiple times and finally get a detection model that is comparable to manual detection.
2.4. Algorithm application strategy
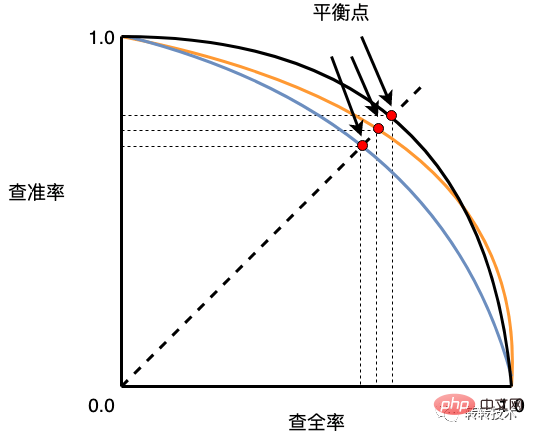
For common classification, detection and other tasks in computer vision, we cannot guarantee that the recall and precision of the model reach 100% indicators at the same time. Therefore, in actual practice During the application process, it is necessary to consider whether the model should be selected in a high-precision or high-recall state based on the actual business. The figure below shows the curve chart of the relationship between recall rate and precision (the picture comes from the book by Teacher Zhou Zhihua)

PR Curve Chart
For our review business, we adopt a high-recall strategy, which means to ensure that the model can find as many product images as possible that do not meet the requirements. The cost is that the accuracy will be reduced accordingly. After we recall products with photographic issues, we will manually intervene and review them, so those examples that are mistakenly recalled will not have an impact on our business.
With the assistance of the algorithm, the workload of students currently reviewing items has been reduced by 50%. Among the product images that have been processed by the algorithm, 50% of the products pass the algorithm and can be directly put on the mall app. The remaining products that are suspected of being problematic will be identified by the algorithm and then reviewed manually.
3. Summary
In the first section, we introduced the background of product review, why we need to review and the content of the review, and also analyzed some problems faced by manual review in the current business. Then the benefits brought by algorithm-empowered business are given.
In Section 2, we introduce the algorithm module in detail. Depending on the items listed for review, we have adopted three methods to solve three different tasks. It also introduces the solution of high recall rate and sacrificing prediction accuracy for the implementation of the algorithm, as well as the feasibility of this solution. Finally, the results achieved by the algorithm are given.
The above is the detailed content of Image algorithm helps improve efficiency and transfer product review. For more information, please follow other related articles on the PHP Chinese website!

Hot AI Tools

Undresser.AI Undress
AI-powered app for creating realistic nude photos

AI Clothes Remover
Online AI tool for removing clothes from photos.

Undress AI Tool
Undress images for free

Clothoff.io
AI clothes remover

Video Face Swap
Swap faces in any video effortlessly with our completely free AI face swap tool!

Hot Article

Hot Tools

Notepad++7.3.1
Easy-to-use and free code editor

SublimeText3 Chinese version
Chinese version, very easy to use

Zend Studio 13.0.1
Powerful PHP integrated development environment

Dreamweaver CS6
Visual web development tools

SublimeText3 Mac version
God-level code editing software (SublimeText3)

Hot Topics
 1386
1386
 52
52
 CLIP-BEVFormer: Explicitly supervise the BEVFormer structure to improve long-tail detection performance
Mar 26, 2024 pm 12:41 PM
Written above & the author’s personal understanding: At present, in the entire autonomous driving system, the perception module plays a vital role. The autonomous vehicle driving on the road can only obtain accurate perception results through the perception module. The downstream regulation and control module in the autonomous driving system makes timely and correct judgments and behavioral decisions. Currently, cars with autonomous driving functions are usually equipped with a variety of data information sensors including surround-view camera sensors, lidar sensors, and millimeter-wave radar sensors to collect information in different modalities to achieve accurate perception tasks. The BEV perception algorithm based on pure vision is favored by the industry because of its low hardware cost and easy deployment, and its output results can be easily applied to various downstream tasks.
 Implementing Machine Learning Algorithms in C++: Common Challenges and Solutions
Jun 03, 2024 pm 01:25 PM
Common challenges faced by machine learning algorithms in C++ include memory management, multi-threading, performance optimization, and maintainability. Solutions include using smart pointers, modern threading libraries, SIMD instructions and third-party libraries, as well as following coding style guidelines and using automation tools. Practical cases show how to use the Eigen library to implement linear regression algorithms, effectively manage memory and use high-performance matrix operations.
 Explore the underlying principles and algorithm selection of the C++sort function
Apr 02, 2024 pm 05:36 PM
The bottom layer of the C++sort function uses merge sort, its complexity is O(nlogn), and provides different sorting algorithm choices, including quick sort, heap sort and stable sort.
 Can artificial intelligence predict crime? Explore CrimeGPT's capabilities
Mar 22, 2024 pm 10:10 PM
The convergence of artificial intelligence (AI) and law enforcement opens up new possibilities for crime prevention and detection. The predictive capabilities of artificial intelligence are widely used in systems such as CrimeGPT (Crime Prediction Technology) to predict criminal activities. This article explores the potential of artificial intelligence in crime prediction, its current applications, the challenges it faces, and the possible ethical implications of the technology. Artificial Intelligence and Crime Prediction: The Basics CrimeGPT uses machine learning algorithms to analyze large data sets, identifying patterns that can predict where and when crimes are likely to occur. These data sets include historical crime statistics, demographic information, economic indicators, weather patterns, and more. By identifying trends that human analysts might miss, artificial intelligence can empower law enforcement agencies
 Improved detection algorithm: for target detection in high-resolution optical remote sensing images
Jun 06, 2024 pm 12:33 PM
01 Outlook Summary Currently, it is difficult to achieve an appropriate balance between detection efficiency and detection results. We have developed an enhanced YOLOv5 algorithm for target detection in high-resolution optical remote sensing images, using multi-layer feature pyramids, multi-detection head strategies and hybrid attention modules to improve the effect of the target detection network in optical remote sensing images. According to the SIMD data set, the mAP of the new algorithm is 2.2% better than YOLOv5 and 8.48% better than YOLOX, achieving a better balance between detection results and speed. 02 Background & Motivation With the rapid development of remote sensing technology, high-resolution optical remote sensing images have been used to describe many objects on the earth’s surface, including aircraft, cars, buildings, etc. Object detection in the interpretation of remote sensing images
 How to edit photos on iPhone using iOS 17
Nov 30, 2023 pm 11:39 PM
Mobile photography has fundamentally changed the way we capture and share life’s moments. The advent of smartphones, especially the iPhone, played a key role in this shift. Known for its advanced camera technology and user-friendly editing features, iPhone has become the first choice for amateur and experienced photographers alike. The launch of iOS 17 marks an important milestone in this journey. Apple's latest update brings an enhanced set of photo editing features, giving users a more powerful toolkit to turn their everyday snapshots into visually engaging and artistically rich images. This technological development not only simplifies the photography process but also opens up new avenues for creative expression, allowing users to effortlessly inject a professional touch into their photos
 Application of algorithms in the construction of 58 portrait platform
May 09, 2024 am 09:01 AM
1. Background of the Construction of 58 Portraits Platform First of all, I would like to share with you the background of the construction of the 58 Portrait Platform. 1. The traditional thinking of the traditional profiling platform is no longer enough. Building a user profiling platform relies on data warehouse modeling capabilities to integrate data from multiple business lines to build accurate user portraits; it also requires data mining to understand user behavior, interests and needs, and provide algorithms. side capabilities; finally, it also needs to have data platform capabilities to efficiently store, query and share user profile data and provide profile services. The main difference between a self-built business profiling platform and a middle-office profiling platform is that the self-built profiling platform serves a single business line and can be customized on demand; the mid-office platform serves multiple business lines, has complex modeling, and provides more general capabilities. 2.58 User portraits of the background of Zhongtai portrait construction
 Add SOTA in real time and skyrocket! FastOcc: Faster inference and deployment-friendly Occ algorithm is here!
Mar 14, 2024 pm 11:50 PM
Written above & The author’s personal understanding is that in the autonomous driving system, the perception task is a crucial component of the entire autonomous driving system. The main goal of the perception task is to enable autonomous vehicles to understand and perceive surrounding environmental elements, such as vehicles driving on the road, pedestrians on the roadside, obstacles encountered during driving, traffic signs on the road, etc., thereby helping downstream modules Make correct and reasonable decisions and actions. A vehicle with self-driving capabilities is usually equipped with different types of information collection sensors, such as surround-view camera sensors, lidar sensors, millimeter-wave radar sensors, etc., to ensure that the self-driving vehicle can accurately perceive and understand surrounding environment elements. , enabling autonomous vehicles to make correct decisions during autonomous driving. Head


