
 Technology peripherals
AI
Research on complex quantification method of expected functional safety scenario library
Technology peripherals
AI
Research on complex quantification method of expected functional safety scenario library
Research on complex quantification method of expected functional safety scenario library

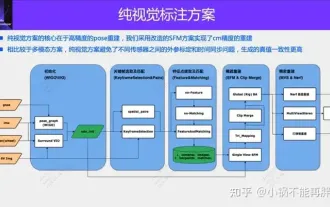
Based on the Pegasus scene layering system, a quantitative method for scene complexity is proposed to evaluate the quality of scene data. This method determines the determinants of elements at each layer, determines the complexity of elements at each layer based on the determinants, and obtains the total complexity of the scene data by calculating the sum of the complexity of elements at each layer. In addition, in order to prevent the "over-complexity" phenomenon, the "mother-child library" method and the "system scenario probability" method are proposed. The complexity of the scene element is multiplied by the occurrence probability of the element to obtain the corrected complexity. The research results show that a reasonable and usable scene library can be constructed through this method.
The main reasons for the hazards caused by safety issues of self-driving cars include two aspects: (1) Harms caused by electronic and electrical failures or software system failures. For this reason, ISO proposed ISO26262 "Road Vehicles—Functional Safety Standard", and China proposed the corresponding GB/T 34590 "Road Vehicles—Functional Safety Standard". (2) Harm caused by insufficient system performance or reasonably foreseeable human misuse. For this reason, ISO proposed the ISO/PAS 21448 Safety of the Intended Functionality, referred to as the SOTIF standard.
In the SOTIF standard, the scenarios faced by autonomous vehicles when driving are divided into 4 categories: known safe scenarios, known unsafe scenarios, unknown safe scenarios and unknown unsafe scenarios. As shown in Figure 1. For known security scenarios and unknown security scenarios, no attention is given in the SOTIF standard. For known hazardous scenarios, the SOTIF standard proposes a methodology. The purpose is to improve the performance of autonomous vehicle-related systems or reduce the operating area of related systems, and to conduct testing and verification based on the relevant scenario library, that is, to convert known dangerous scenarios into known safe scenarios.
For unknown dangerous scenarios, a large number of experiments can be conducted based on the scenario library to discover and detect potential safety hazard scenarios in related systems, that is, convert unknown dangerous scenarios into known ones. Dangerous scene. Finally, based on the above methodology, the known dangerous scenarios are transformed into known safe scenarios. In short, the goal of the SOTIF standard is to expand as much as possible the range of known safety and unknown safety scenarios that autonomous vehicle-related systems face when running, thereby narrowing the range of known hazards and unknown hazard scenarios as much as possible, as shown in Figure 2 shown. To achieve the above goals, one of the key factors is to build a high-quality library of expected functional safety scenarios.


Currently, many enterprises and organizations have built their own libraries of expected functional safety scenarios. For example: Kitti scene library, NuScenes[6] scene library, Lyft self-driving car scene library, etc. Most enterprises and organizations focus on the collection of scene library data during the construction process of the scene library, but lack reasonable quantitative indicators for the quality of the collected scene data.
This undoubtedly brings about two problems:
(1) The scene library may contain a large amount of duplicate and low-quality scene data , resulting in the test time based on the scene library being too long, and even the performance defects of the self-driving car cannot be found, which reduces the credibility of the test results.
(2) The advantages and disadvantages of different scene libraries cannot be compared, resulting in the inability to select the optimal scene library data for the autonomous vehicle scene library test. Therefore, it is very necessary to adopt a scientific and reasonable method to quantify the quality of scene library. The more complex the scene data, the greater the challenge to the relevant system, and the greater the possibility of detecting performance defects of the relevant system. Therefore, it can be considered that the complexity of scene data is one of the key factors affecting the quality of the scene library.
This article proposes a method to quantify the complexity of scene data. This method is based on the scene layering system of the German Pegasus project. It classifies and counts the elements in the scene to calculate the complexity of the elements in the scene data and evaluates the quality of the scene data.
1 Pegasus scene layering system
The Pegasus project was jointly initiated by relevant companies and research institutions in the German automotive industry to develop a series of test standards related to autonomous vehicles for purpose. This project proposes a scene layering system, that is, the scene is divided into six layers of scenes according to different scene elements, see Table 1.


##The scene data is shown in Figure 3. Based on the Pegasus scene layering system, scene data can be layered, as shown in Table 2.

2 Scene data complexity quantification method
Pegasus scene layering The system layers scene elements. This article further analyzes the elements of each layer and quantifies the complexity of each layer of elements.
The complexity of the road layer is mainly determined by the visibility of the lane lines, see Table 3. For clear lane lines, the complexity is set as 1; blocked or worn lane lines will affect lane line recognition, and the complexity is 2; road water accumulation and ice covering lane lines will not only affect lane line recognition, It will also cause driving difficulties, with a complexity of 3; irregular lane lines may cause misrecognition of lane lines, causing the vehicle to travel in the wrong direction, with a complexity of 4; a scenario without lane lines may affect the direction of vehicle travel, with a complexity of 4 is 5.
The complexity of the transportation facilities layer is mainly determined by the visibility of the transportation facilities, see Table 4. A scene with no transportation facilities has a complexity of 1; a scene with clear transportation facilities has a complexity of 2; a scene with transportation facilities that are too far away and cannot be clearly identified has a complexity of 3; transportation facilities are reflective, dirty, etc. Scenarios that are difficult to identify have a complexity level of 4; traffic facilities are irregular, which may cause misidentification and lead to dangerous behaviors such as running red lights, and the complexity level is 5.


The complexity of the temporary traffic event layer is mainly determined by the contingency and predictability of its events, see table 5. If there is no temporary traffic incident, the complexity is 1; if there are temporary traffic incidents such as traffic control and there are dedicated personnel to maintain the scene, the complexity is 2; if there are temporary traffic incidents such as road construction with warning signs, the complexity is 3; traffic accidents, etc. Temporary traffic events that have a greater impact on driving have a complexity of 4; temporary traffic events that are highly sporadic and difficult to foresee, such as falling rocks and falling wheels, have a complexity of 5.
The complexity of the traffic participant layer is determined by the commonness and compliance of the participants, see Table 6. If there are no traffic participants, the complexity is 1; if the scene contains only vehicles, the complexity is 2; if it contains common participants such as pedestrians and bicycles and is located in a location specified by regulations (such as sidewalks, bicycle lanes, etc.), the complexity is 3 ; Contains common participants such as pedestrians and bicycles and is not located in a position specified by regulations (pedestrians crossing the road, bicycles driving on motor vehicle lanes, etc.), its complexity is 4; Uncommon traffic participants (such as trucks dragging elephants) , pedestrians on horses, etc.), its complexity is 5.
The complexity of the environmental condition layer is mainly determined by visibility, see Table 7. High visibility on sunny days has a complexity of 1; medium visibility on rainy days and evenings has a complexity of 2; there is ambient light at night, and its complexity is 3; there is no ambient light at night, and visibility is low, and its complexity is 4; dense fog Sky visibility is very low and its complexity is 5.


##The complexity of the information layer is mainly determined by whether there is traffic information, see Table 8. If there is a high-precision map or V2X provides traffic information, the complexity is 1; if there is no high-precision map or V2X provides traffic information, the complexity is 2.
Through the above layering method and the complexity quantification method of each layer, the complexity of a single scene data can be calculated, that is, the sum of the complexity of each layer. For example: the scene data in Figure 3 has a complexity of 18 (see Table 9 for the complexity of each layer)
For the entire scene library, add the complexity of each scene data Then divide it by the total number of scene data in the scene library to get the complexity of the entire scene library. The quality of different scene libraries can be compared based on the complexity of the scene library.
It is worth noting that due to space limitations, not all elements are listed and covered in the above complexity table at each level. For elements that are not enumerated or covered, their complexity should be determined based on the factors that determine the complexity of the layer at which they are located. For example: the determinant of the complexity of the environmental conditions layer is visibility, then for foggy days with lower concentrations that are not listed, the visibility is equivalent to the visibility of ambient lights at night, so the complexity is 3.
3 Scene data complexity correction
When using the above complex quantification method to build a scene library, the phenomenon of "over-complexity" is prone to occur. That is, in order to pursue the complexity of the scene library, the scene library only collects high-complexity scenes. As a result, although the complexity of the scene library is very high, the probability of occurrence is very low. In the end, the performance defects of the system cannot be discovered. In order to avoid the "over-complexity" phenomenon, this article proposes two concepts: "mother-child library" and "system scenario probability".
3.1 Mother-child libraryIn the actual scene library collection process, the data collected by random collection methods such as random locations, random time periods, random climates, etc. constitute " Mother library". Then, based on the characteristics and operating domain of the relevant system, the "sub-library" is extracted from the "mother library". For example: For an autonomous driving system that is only applicable to highways, the scene data of highways is extracted from the "parent library" and formed into a "sub-library". For example: for an autonomous driving system developed for a specific city, the scene data of that city is extracted from the "mother database" to form a "sub-database" for the system.
It is worth noting: Theoretically, you can either build the "mother library" first and then extract the "sub-library", or you can build the "sub-library" first and then collect it into the "mother library". Library". However, this article recommends the “mother first, son second” approach. Because the construction of the "mother library" is random, the "child libraries" extracted from the "mother library" also have random attributes. If the "sub-library" is built first, and because the "sub-library" is system-specific, it is difficult to achieve complete randomness in the construction process.
3.2 System Scenario ProbabilityFor the "sub-library" extracted from the "mother library", further analyze the elements of each layer in the scenario during the system operation. The probability of occurrence is the system scenario probability. For example: For an autonomous driving system that is only suitable for highways, the probability of the traffic participant layer containing only vehicles (complexity 2) is much higher than the probability of pedestrians and bicycles (complexity 3). Therefore, when evaluating the complexity of elements in this layer, it is also necessary to multiply the complexity by a probability coefficient to obtain the final complexity of this layer. The formula is:

In the formula: C is the final complexity of the scene data;  is the complexity of the
  layer scene elements;
  is the probability coefficient of scene elements of the
  layer appearing when the relevant system is running.
3.3 Preventing the "over-complexity" phenomenon
The "over-complexity" phenomenon can be avoided through "mother and child libraries" and "system scenario probability". The main reasons are: (1) When constructing the "mother library", a random collection method of random location, random time period, random climate, etc. is used to reduce human factors in the collection process of the "mother library". (2) For a specific system, the relevant "sub-library" is extracted from the "mother library", which indirectly avoids human factors in the "sub-library". (3) Calculate the final scene complexity based on the scene occurrence probability and complexity when the system is running. Combining the objective factors of complexity and probability avoids the influence of human factors. For example: for high-complexity, low-probability scene elements or for low-complexity, high-probability scene elements, the final scene complexity value may be lower.
3.4 Probability coefficient value
The probability coefficient is different for different systems. For example: for a system that is limited to highway use, the probability coefficient of only vehicles appearing in the traffic participant layer is greater than the probability coefficient of pedestrians and bicycles; for a system that can be used in urban traffic scenarios, the probability coefficient of pedestrians and bicycles appearing in the traffic participant layer The probability coefficient of is greater than the probability coefficient of only vehicles. In addition, for the same system, at different stages of the autonomous driving development process, its probability coefficients may also be different. For example: At this stage, the probability coefficient of a system with high-precision maps or V2X in the information layer is lower than that of a system without high-precision maps or V2X. In the later stages of the development of autonomous driving, the probability coefficient of a system with high-precision maps or V2X may be higher than that of a system without high-precision maps or V2X.
Therefore, for different systems, it is necessary to consider many aspects such as its operating scope, location, time, target market, and overall market level to determine the probabilities of its different scenario elements. coefficient.
4 Conclusion
In order to meet the requirements of ISO/PAS 21448, a library of expected functional safety scenarios needs to be built. However, the construction quality of the scene library lacks corresponding quantitative indicators. Based on the Pegasus scene layering system, this article quantifies the complexity of each layer of elements to evaluate the quality of the scene library. At the same time, in order to avoid the phenomenon of "over-complexity", the two concepts of "mother-child library" and "system scenario probability" are proposed, and how to construct the "mother-child library" and how to calculate the "system scenario probability" is explained, and based on this, the final How to calculate complexity. The quantification methods mentioned in this article and the methods to prevent "excessive complexity" play an indicative role in the establishment and promotion of the expected functional safety scenario library.
The above is the detailed content of Research on complex quantification method of expected functional safety scenario library. For more information, please follow other related articles on the PHP Chinese website!

Hot AI Tools

Undresser.AI Undress
AI-powered app for creating realistic nude photos

AI Clothes Remover
Online AI tool for removing clothes from photos.

Undress AI Tool
Undress images for free

Clothoff.io
AI clothes remover

AI Hentai Generator
Generate AI Hentai for free.

Hot Article
Hot Tools

Notepad++7.3.1
Easy-to-use and free code editor

SublimeText3 Chinese version
Chinese version, very easy to use

Zend Studio 13.0.1
Powerful PHP integrated development environment

Dreamweaver CS6
Visual web development tools

SublimeText3 Mac version
God-level code editing software (SublimeText3)
Hot Topics
 1386
1386
 52
52

 How to solve the long tail problem in autonomous driving scenarios?
Jun 02, 2024 pm 02:44 PM
How to solve the long tail problem in autonomous driving scenarios?
Jun 02, 2024 pm 02:44 PM
Yesterday during the interview, I was asked whether I had done any long-tail related questions, so I thought I would give a brief summary. The long-tail problem of autonomous driving refers to edge cases in autonomous vehicles, that is, possible scenarios with a low probability of occurrence. The perceived long-tail problem is one of the main reasons currently limiting the operational design domain of single-vehicle intelligent autonomous vehicles. The underlying architecture and most technical issues of autonomous driving have been solved, and the remaining 5% of long-tail problems have gradually become the key to restricting the development of autonomous driving. These problems include a variety of fragmented scenarios, extreme situations, and unpredictable human behavior. The "long tail" of edge scenarios in autonomous driving refers to edge cases in autonomous vehicles (AVs). Edge cases are possible scenarios with a low probability of occurrence. these rare events
 nuScenes' latest SOTA | SparseAD: Sparse query helps efficient end-to-end autonomous driving!
Apr 17, 2024 pm 06:22 PM
nuScenes' latest SOTA | SparseAD: Sparse query helps efficient end-to-end autonomous driving!
Apr 17, 2024 pm 06:22 PM
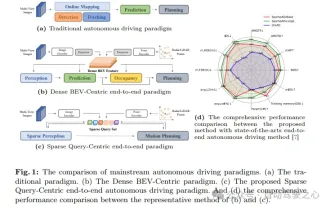
Written in front & starting point The end-to-end paradigm uses a unified framework to achieve multi-tasking in autonomous driving systems. Despite the simplicity and clarity of this paradigm, the performance of end-to-end autonomous driving methods on subtasks still lags far behind single-task methods. At the same time, the dense bird's-eye view (BEV) features widely used in previous end-to-end methods make it difficult to scale to more modalities or tasks. A sparse search-centric end-to-end autonomous driving paradigm (SparseAD) is proposed here, in which sparse search fully represents the entire driving scenario, including space, time, and tasks, without any dense BEV representation. Specifically, a unified sparse architecture is designed for task awareness including detection, tracking, and online mapping. In addition, heavy
 FisheyeDetNet: the first target detection algorithm based on fisheye camera
Apr 26, 2024 am 11:37 AM
FisheyeDetNet: the first target detection algorithm based on fisheye camera
Apr 26, 2024 am 11:37 AM
Target detection is a relatively mature problem in autonomous driving systems, among which pedestrian detection is one of the earliest algorithms to be deployed. Very comprehensive research has been carried out in most papers. However, distance perception using fisheye cameras for surround view is relatively less studied. Due to large radial distortion, standard bounding box representation is difficult to implement in fisheye cameras. To alleviate the above description, we explore extended bounding box, ellipse, and general polygon designs into polar/angular representations and define an instance segmentation mIOU metric to analyze these representations. The proposed model fisheyeDetNet with polygonal shape outperforms other models and simultaneously achieves 49.5% mAP on the Valeo fisheye camera dataset for autonomous driving
 LLM is all done! OmniDrive: Integrating 3D perception and reasoning planning (NVIDIA's latest)
May 09, 2024 pm 04:55 PM
LLM is all done! OmniDrive: Integrating 3D perception and reasoning planning (NVIDIA's latest)
May 09, 2024 pm 04:55 PM
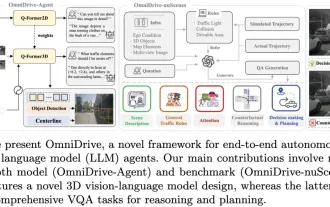
Written above & the author’s personal understanding: This paper is dedicated to solving the key challenges of current multi-modal large language models (MLLMs) in autonomous driving applications, that is, the problem of extending MLLMs from 2D understanding to 3D space. This expansion is particularly important as autonomous vehicles (AVs) need to make accurate decisions about 3D environments. 3D spatial understanding is critical for AVs because it directly impacts the vehicle’s ability to make informed decisions, predict future states, and interact safely with the environment. Current multi-modal large language models (such as LLaVA-1.5) can often only handle lower resolution image inputs (e.g.) due to resolution limitations of the visual encoder, limitations of LLM sequence length. However, autonomous driving applications require
 The first pure visual static reconstruction of autonomous driving
Jun 02, 2024 pm 03:24 PM
The first pure visual static reconstruction of autonomous driving
Jun 02, 2024 pm 03:24 PM
A purely visual annotation solution mainly uses vision plus some data from GPS, IMU and wheel speed sensors for dynamic annotation. Of course, for mass production scenarios, it doesn’t have to be pure vision. Some mass-produced vehicles will have sensors like solid-state radar (AT128). If we create a data closed loop from the perspective of mass production and use all these sensors, we can effectively solve the problem of labeling dynamic objects. But there is no solid-state radar in our plan. Therefore, we will introduce this most common mass production labeling solution. The core of a purely visual annotation solution lies in high-precision pose reconstruction. We use the pose reconstruction scheme of Structure from Motion (SFM) to ensure reconstruction accuracy. But pass
 Take a look at the past and present of Occ and autonomous driving! The first review comprehensively summarizes the three major themes of feature enhancement/mass production deployment/efficient annotation.
May 08, 2024 am 11:40 AM
Take a look at the past and present of Occ and autonomous driving! The first review comprehensively summarizes the three major themes of feature enhancement/mass production deployment/efficient annotation.
May 08, 2024 am 11:40 AM
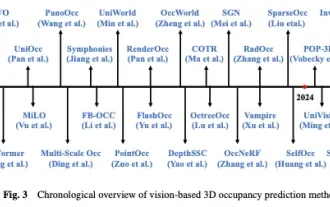
Written above & The author’s personal understanding In recent years, autonomous driving has received increasing attention due to its potential in reducing driver burden and improving driving safety. Vision-based three-dimensional occupancy prediction is an emerging perception task suitable for cost-effective and comprehensive investigation of autonomous driving safety. Although many studies have demonstrated the superiority of 3D occupancy prediction tools compared to object-centered perception tasks, there are still reviews dedicated to this rapidly developing field. This paper first introduces the background of vision-based 3D occupancy prediction and discusses the challenges encountered in this task. Next, we comprehensively discuss the current status and development trends of current 3D occupancy prediction methods from three aspects: feature enhancement, deployment friendliness, and labeling efficiency. at last
 Towards 'Closed Loop' | PlanAgent: New SOTA for closed-loop planning of autonomous driving based on MLLM!
Jun 08, 2024 pm 09:30 PM
Towards 'Closed Loop' | PlanAgent: New SOTA for closed-loop planning of autonomous driving based on MLLM!
Jun 08, 2024 pm 09:30 PM
The deep reinforcement learning team of the Institute of Automation, Chinese Academy of Sciences, together with Li Auto and others, proposed a new closed-loop planning framework for autonomous driving based on the multi-modal large language model MLLM - PlanAgent. This method takes a bird's-eye view of the scene and graph-based text prompts as input, and uses the multi-modal understanding and common sense reasoning capabilities of the multi-modal large language model to perform hierarchical reasoning from scene understanding to the generation of horizontal and vertical movement instructions, and Further generate the instructions required by the planner. The method is tested on the large-scale and challenging nuPlan benchmark, and experiments show that PlanAgent achieves state-of-the-art (SOTA) performance on both regular and long-tail scenarios. Compared with conventional large language model (LLM) methods, PlanAgent
 Beyond BEVFusion! DifFUSER: Diffusion model enters autonomous driving multi-task (BEV segmentation + detection dual SOTA)
Apr 22, 2024 pm 05:49 PM
Beyond BEVFusion! DifFUSER: Diffusion model enters autonomous driving multi-task (BEV segmentation + detection dual SOTA)
Apr 22, 2024 pm 05:49 PM
Written above & the author’s personal understanding At present, as autonomous driving technology becomes more mature and the demand for autonomous driving perception tasks increases, the industry and academia very much hope for an ideal perception algorithm model that can simultaneously complete three-dimensional target detection and based on Semantic segmentation task in BEV space. For a vehicle capable of autonomous driving, it is usually equipped with surround-view camera sensors, lidar sensors, and millimeter-wave radar sensors to collect data in different modalities. This makes full use of the complementary advantages between different modal data, making the data complementary advantages between different modalities. For example, 3D point cloud data can provide information for 3D target detection tasks, while color image data can provide more information for semantic segmentation tasks. accurate information. Needle
