
 Technology peripherals
AI
Graph-DETR3D: Rethinking overlapping regions in multi-view 3D object detection
Technology peripherals
AI
Graph-DETR3D: Rethinking overlapping regions in multi-view 3D object detection
Graph-DETR3D: Rethinking overlapping regions in multi-view 3D object detection

arXiv paper "Graph-DETR3D: Rethinking Overlapping Regions for Multi-View 3D Object Detection", June 22, work of the University of Science and Technology of China, Harbin Institute of Technology and SenseTime.
Detecting 3-D objects from multiple image views is a fundamental yet challenging task in visual scene understanding. Due to its low cost and high efficiency, multi-view 3-D object detection shows broad application prospects. However, due to the lack of depth information, it is extremely difficult to accurately detect objects through perspective in 3-D space. Recently, DETR3D introduces a new 3D-2D query paradigm for aggregating multi-view images for 3D object detection and achieves state-of-the-art performance.
Through intensive guided experiments, this paper quantifies targets located in different areas and finds that "truncated instances" (i.e., the boundary areas of each image) are the main bottleneck hindering DETR3D performance. Despite merging multiple features from two adjacent views in overlapping regions, DETR3D still suffers from insufficient feature aggregation and therefore misses the opportunity to fully improve detection performance.
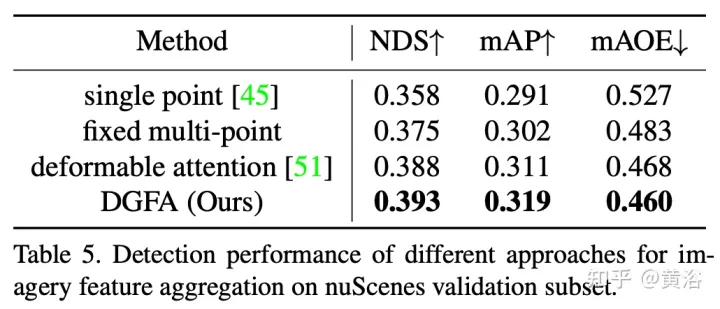
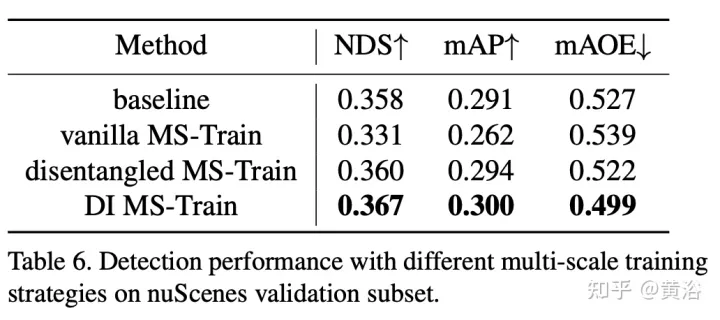
In order to solve this problem, Graph-DETR3D is proposed to automatically aggregate multi-view image information through graph structure learning (GSL). A dynamic 3D map is constructed between each target query and 2-D feature map to enhance target representation, especially in boundary regions. In addition, Graph-DETR3D benefits from a new depth-invariant multi-scale training strategy, which maintains visual depth consistency by simultaneously scaling the image size and target depth.
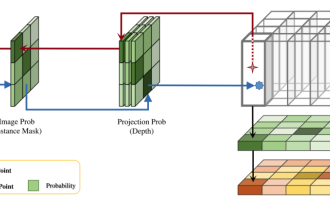
The difference of Graph-DETR3D lies in two points, as shown in the figure: (1) aggregation module of dynamic graph features; (2) depth-invariant multi-scale training strategy. It follows the basic structure of DETR3D and consists of three components: image encoder, transformer decoder and target prediction head. Given a set of images I = {I1, I2,…,IK} (captured by N peri-view cameras), Graph-DETR3D aims to predict the location and category of the bounding box of interest. First, use an image encoder (including ResNet and FPN) to turn these images into a set of relatively L feature map-level features F. Then, a dynamic 3-D graph is constructed to extensively aggregate 2-D information through the dynamic graph feature aggregation (DGFA) module to optimize the representation of the target query. Finally, the enhanced target query is utilized to output the final prediction.
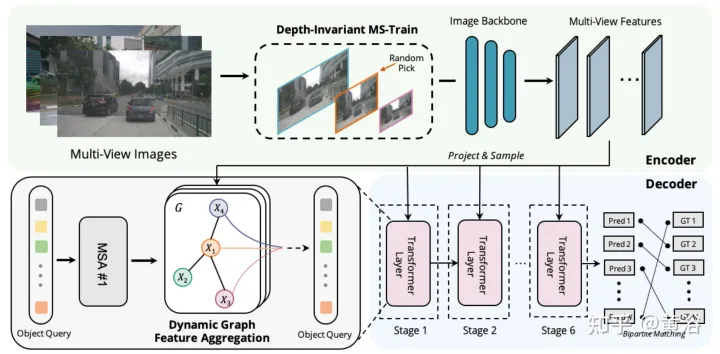
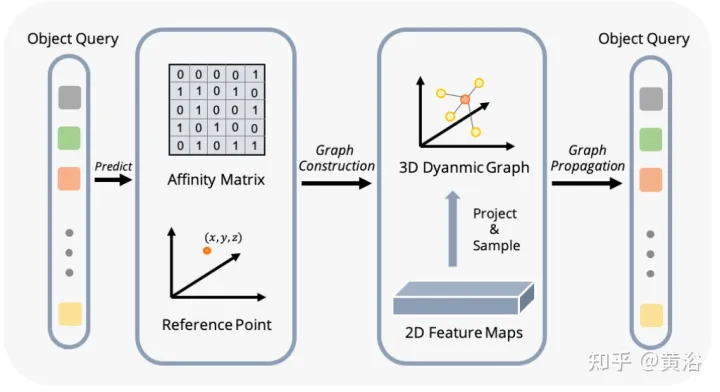
The figure shows the dynamic graph feature aggregation (DFGA) process: first construct a learnable 3-D graph for each target query, and then construct a learnable 3-D graph from the 2-D image plane Sampling characteristics. Finally, the representation of the target query is enhanced through graph connections. This interconnected message propagation scheme supports iterative refinement of graph structure construction and feature enhancement.
Multi-scale training is a commonly used data augmentation strategy in 2D and 3D object detection tasks, which is proven to be effective and low-cost inference. However, it rarely appears in vision-based 3-D inspection methods. Taking into account different input image sizes can improve the robustness of the model, while adjusting the image size and modifying the camera internal parameters to implement a common multi-scale training strategy.
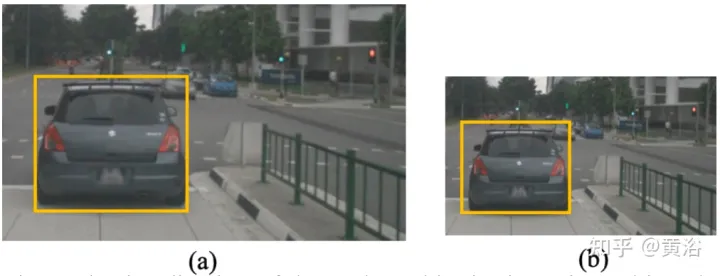
An interesting phenomenon is that the final performance drops sharply. By carefully analyzing the input data, we found that simply rescaling the image leads to a perspective-ambiguity problem: when the target is resized to a larger/smaller scale, its absolute properties (i.e. the size of the target, the distance to the ego point) do not Change.
As a concrete example, the figure shows this ambiguous problem: although the absolute 3D position of the selected area in (a) and (b) is the same, the number of image pixels is different. Depth prediction networks tend to estimate depth based on the occupied area of the image. Therefore, this training pattern in the figure may confuse the depth prediction model and further deteriorate the final performance.
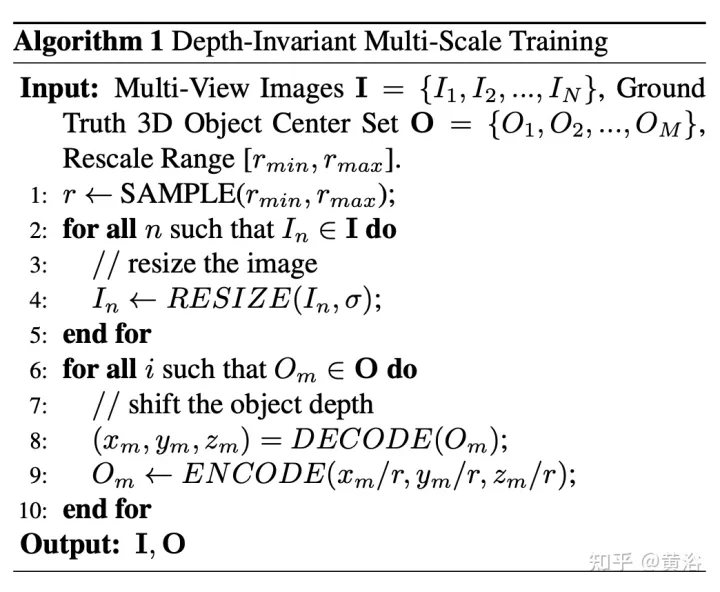
Recalculate depth from pixel perspective for this purpose. The pseudocode of the algorithm is as follows:
The following is the decoding operation:
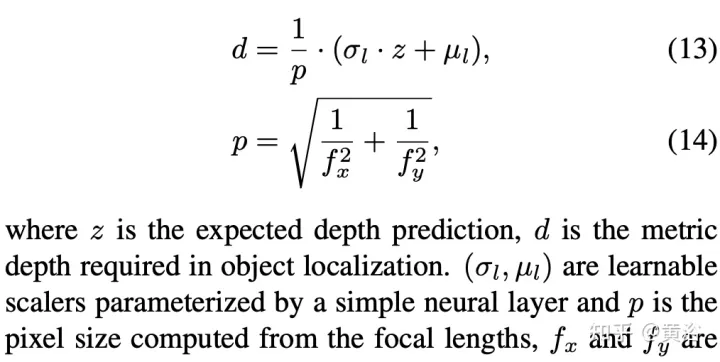
The recalculated pixel size is:

Assume the scale factor r = rx = ry, then simplify to get:

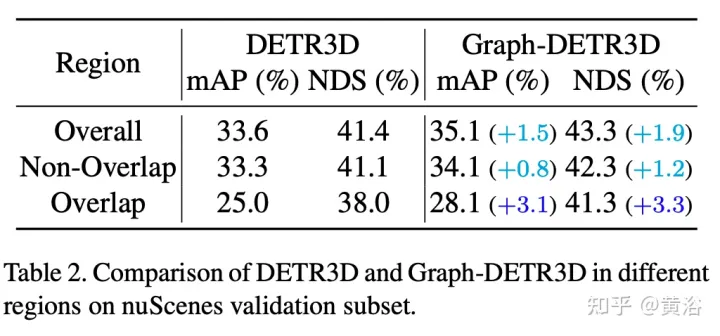
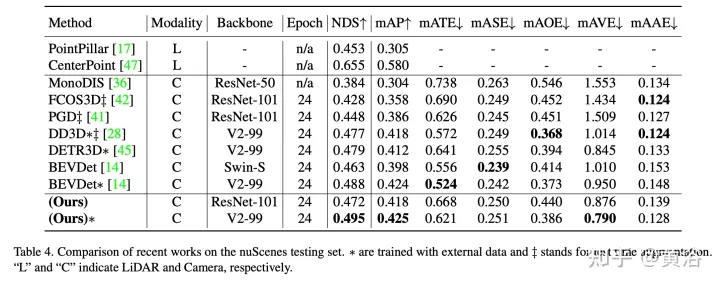
The experimental results are as follows:
The above is the detailed content of Graph-DETR3D: Rethinking overlapping regions in multi-view 3D object detection. For more information, please follow other related articles on the PHP Chinese website!

Hot AI Tools

Undresser.AI Undress
AI-powered app for creating realistic nude photos

AI Clothes Remover
Online AI tool for removing clothes from photos.

Undress AI Tool
Undress images for free

Clothoff.io
AI clothes remover

AI Hentai Generator
Generate AI Hentai for free.

Hot Article
Hot Tools

Notepad++7.3.1
Easy-to-use and free code editor

SublimeText3 Chinese version
Chinese version, very easy to use

Zend Studio 13.0.1
Powerful PHP integrated development environment

Dreamweaver CS6
Visual web development tools

SublimeText3 Mac version
God-level code editing software (SublimeText3)
Hot Topics
 1376
1376
 52
52

 The Stable Diffusion 3 paper is finally released, and the architectural details are revealed. Will it help to reproduce Sora?
Mar 06, 2024 pm 05:34 PM
The Stable Diffusion 3 paper is finally released, and the architectural details are revealed. Will it help to reproduce Sora?
Mar 06, 2024 pm 05:34 PM
StableDiffusion3’s paper is finally here! This model was released two weeks ago and uses the same DiT (DiffusionTransformer) architecture as Sora. It caused quite a stir once it was released. Compared with the previous version, the quality of the images generated by StableDiffusion3 has been significantly improved. It now supports multi-theme prompts, and the text writing effect has also been improved, and garbled characters no longer appear. StabilityAI pointed out that StableDiffusion3 is a series of models with parameter sizes ranging from 800M to 8B. This parameter range means that the model can be run directly on many portable devices, significantly reducing the use of AI
 Have you really mastered coordinate system conversion? Multi-sensor issues that are inseparable from autonomous driving
Oct 12, 2023 am 11:21 AM
Have you really mastered coordinate system conversion? Multi-sensor issues that are inseparable from autonomous driving
Oct 12, 2023 am 11:21 AM
The first pilot and key article mainly introduces several commonly used coordinate systems in autonomous driving technology, and how to complete the correlation and conversion between them, and finally build a unified environment model. The focus here is to understand the conversion from vehicle to camera rigid body (external parameters), camera to image conversion (internal parameters), and image to pixel unit conversion. The conversion from 3D to 2D will have corresponding distortion, translation, etc. Key points: The vehicle coordinate system and the camera body coordinate system need to be rewritten: the plane coordinate system and the pixel coordinate system. Difficulty: image distortion must be considered. Both de-distortion and distortion addition are compensated on the image plane. 2. Introduction There are four vision systems in total. Coordinate system: pixel plane coordinate system (u, v), image coordinate system (x, y), camera coordinate system () and world coordinate system (). There is a relationship between each coordinate system,
 This article is enough for you to read about autonomous driving and trajectory prediction!
Feb 28, 2024 pm 07:20 PM
This article is enough for you to read about autonomous driving and trajectory prediction!
Feb 28, 2024 pm 07:20 PM
Trajectory prediction plays an important role in autonomous driving. Autonomous driving trajectory prediction refers to predicting the future driving trajectory of the vehicle by analyzing various data during the vehicle's driving process. As the core module of autonomous driving, the quality of trajectory prediction is crucial to downstream planning control. The trajectory prediction task has a rich technology stack and requires familiarity with autonomous driving dynamic/static perception, high-precision maps, lane lines, neural network architecture (CNN&GNN&Transformer) skills, etc. It is very difficult to get started! Many fans hope to get started with trajectory prediction as soon as possible and avoid pitfalls. Today I will take stock of some common problems and introductory learning methods for trajectory prediction! Introductory related knowledge 1. Are the preview papers in order? A: Look at the survey first, p
 Multi-grid redundant bounding box annotation for accurate object detection
Jun 01, 2024 pm 09:46 PM
Multi-grid redundant bounding box annotation for accurate object detection
Jun 01, 2024 pm 09:46 PM
1. Introduction Currently, the leading object detectors are two-stage or single-stage networks based on the repurposed backbone classifier network of deep CNN. YOLOv3 is one such well-known state-of-the-art single-stage detector that receives an input image and divides it into an equal-sized grid matrix. Grid cells with target centers are responsible for detecting specific targets. What I’m sharing today is a new mathematical method that allocates multiple grids to each target to achieve accurate tight-fit bounding box prediction. The researchers also proposed an effective offline copy-paste data enhancement for target detection. The newly proposed method significantly outperforms some current state-of-the-art object detectors and promises better performance. 2. The background target detection network is designed to use
 New SOTA for target detection: YOLOv9 comes out, and the new architecture brings traditional convolution back to life
Feb 23, 2024 pm 12:49 PM
New SOTA for target detection: YOLOv9 comes out, and the new architecture brings traditional convolution back to life
Feb 23, 2024 pm 12:49 PM
In the field of target detection, YOLOv9 continues to make progress in the implementation process. By adopting new architecture and methods, it effectively improves the parameter utilization of traditional convolution, which makes its performance far superior to previous generation products. More than a year after YOLOv8 was officially released in January 2023, YOLOv9 is finally here! Since Joseph Redmon, Ali Farhadi and others proposed the first-generation YOLO model in 2015, researchers in the field of target detection have updated and iterated it many times. YOLO is a prediction system based on global information of images, and its model performance is continuously enhanced. By continuously improving algorithms and technologies, researchers have achieved remarkable results, making YOLO increasingly powerful in target detection tasks.
 DualBEV: significantly surpassing BEVFormer and BEVDet4D, open the book!
Mar 21, 2024 pm 05:21 PM
DualBEV: significantly surpassing BEVFormer and BEVDet4D, open the book!
Mar 21, 2024 pm 05:21 PM
This paper explores the problem of accurately detecting objects from different viewing angles (such as perspective and bird's-eye view) in autonomous driving, especially how to effectively transform features from perspective (PV) to bird's-eye view (BEV) space. Transformation is implemented via the Visual Transformation (VT) module. Existing methods are broadly divided into two strategies: 2D to 3D and 3D to 2D conversion. 2D-to-3D methods improve dense 2D features by predicting depth probabilities, but the inherent uncertainty of depth predictions, especially in distant regions, may introduce inaccuracies. While 3D to 2D methods usually use 3D queries to sample 2D features and learn the attention weights of the correspondence between 3D and 2D features through a Transformer, which increases the computational and deployment time.
 The first multi-view autonomous driving scene video generation world model | DrivingDiffusion: New ideas for BEV data and simulation
Oct 23, 2023 am 11:13 AM
The first multi-view autonomous driving scene video generation world model | DrivingDiffusion: New ideas for BEV data and simulation
Oct 23, 2023 am 11:13 AM
Some of the author’s personal thoughts In the field of autonomous driving, with the development of BEV-based sub-tasks/end-to-end solutions, high-quality multi-view training data and corresponding simulation scene construction have become increasingly important. In response to the pain points of current tasks, "high quality" can be decoupled into three aspects: long-tail scenarios in different dimensions: such as close-range vehicles in obstacle data and precise heading angles during car cutting, as well as lane line data. Scenes such as curves with different curvatures or ramps/mergings/mergings that are difficult to capture. These often rely on large amounts of data collection and complex data mining strategies, which are costly. 3D true value - highly consistent image: Current BEV data acquisition is often affected by errors in sensor installation/calibration, high-precision maps and the reconstruction algorithm itself. this led me to
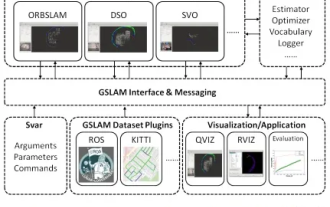 GSLAM | A general SLAM architecture and benchmark
Oct 20, 2023 am 11:37 AM
GSLAM | A general SLAM architecture and benchmark
Oct 20, 2023 am 11:37 AM
Suddenly discovered a 19-year-old paper GSLAM: A General SLAM Framework and Benchmark open source code: https://github.com/zdzhaoyong/GSLAM Go directly to the full text and feel the quality of this work ~ 1 Abstract SLAM technology has achieved many successes recently and attracted many attracted the attention of high-tech companies. However, how to effectively perform benchmarks on speed, robustness, and portability with interfaces to existing or emerging algorithms remains a problem. In this paper, a new SLAM platform called GSLAM is proposed, which not only provides evaluation capabilities but also provides researchers with a useful way to quickly develop their own SLAM systems.
