

When it comes to creativity, everyone will first think of advertising creativity. In fact, insurance creativity is recommended It is also a vertical application product for advertising creativity.
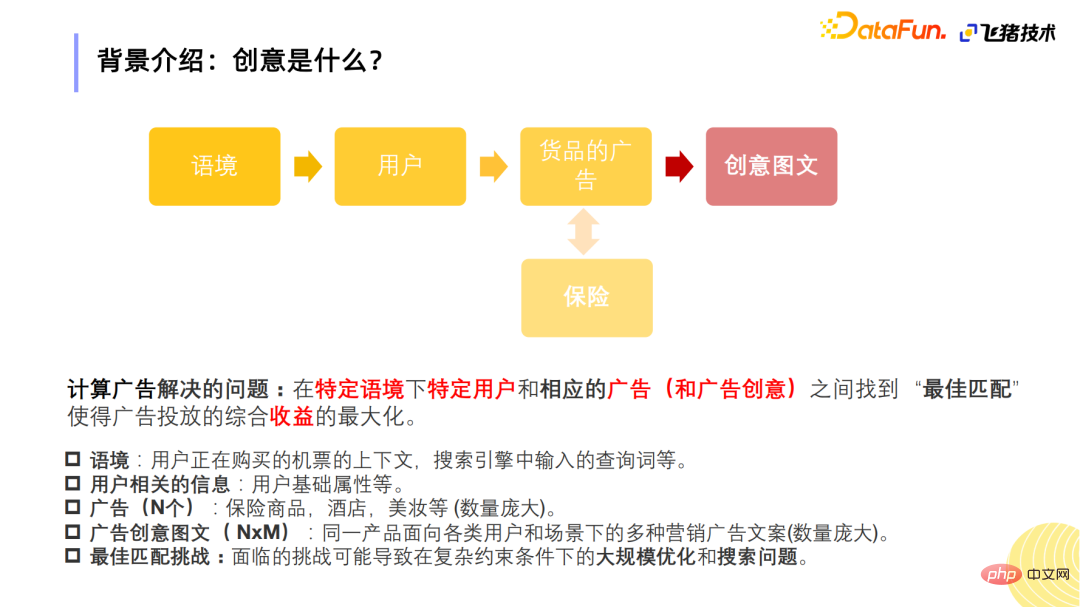
The problem solved by computational advertising is to serve specific users under specific semantics Select the appropriate ad to match the best creative graphics. In the auxiliary insurance recommendation module, the context refers to some contextual information about the user purchasing air tickets or train tickets; in the search scenario, the context refers to some query words in the search engine; user-related information refers to the user's base Information, such as age and gender, etc.; advertisements are insurance products, hotel cosmetics and other products of magnitude N; the number of creative graphics and texts is of magnitude N*M. The challenges facing computational advertising lie in large-scale optimization and search problems under complex constraints.
This article mainly talks about the recommendation of creative pictures and texts. The selection and ordering of advertisements will not be considered. Next, we will introduce how Fliggy Insurance uses creative recommendations. of.
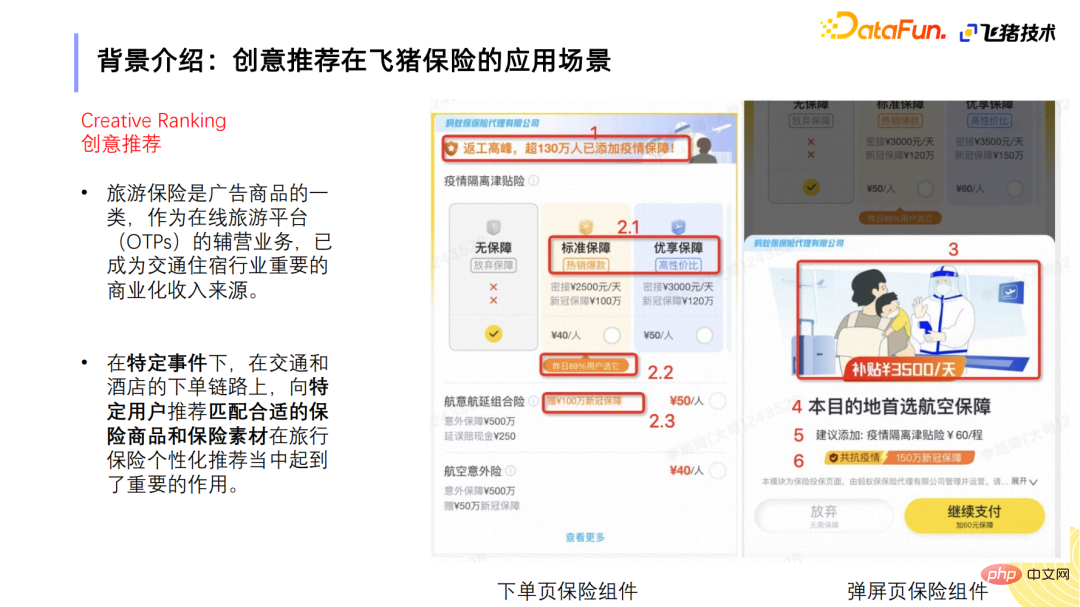
First of all, in the OTP industry, travel insurance as an auxiliary business is now a relatively important source of commercial income. . In insurance recommendations, in addition to product recommendations and price recommendations, creative recommendations have been used as a very important personalized recommendation module. For example, when filling in personal information, you can see some components, and when you pull down the checkout, you will also see pop-up windows.
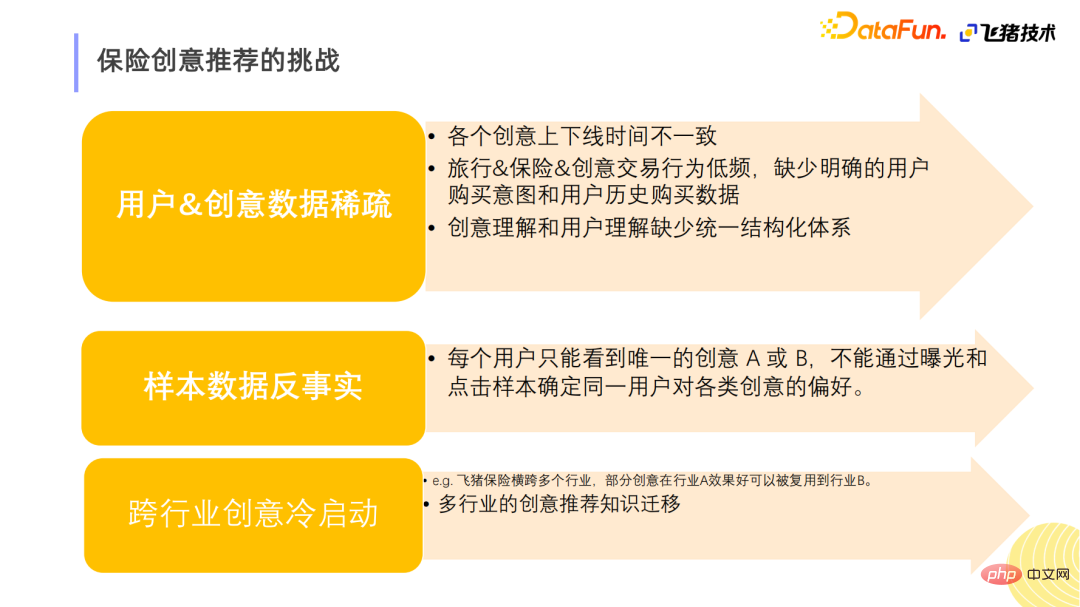
Creative Recommendation of Insurance The challenges faced can be summarized into three major categories:
The first category is data sparseness, including sparse user data and sparse creative data. Creative data sparseness refers to the fact that operations or UI students iterate creative ideas, or some creative ideas are put on and off shelves due to seasonal reasons, so the creative exposure online is not evenly distributed. In addition, since travel, insurance and creativity are low-frequency transactions, we rarely get three pieces of related purchase data, such as the user's personal purchase history data. At the same time, because insurance is an auxiliary product, unlike search, you can clearly know the user's purchasing intention. There is also a lack of a unified and structured system between creative understanding and user understanding.
The second category is sample data counterfactual. Each user can only see unique creative copy, that is, they can only see creative A or B. Multiple creative ideas cannot be exposed to the same user at the same time period and point in time.
The third category is Cross-industry creative cold start. Fliggy Insurance spans multiple industries. When starting to intervene in new industries, how to reuse knowledge in existing fields, such as migrating some ideas that work well in industry A to industry B, is also a problem we will solve later. .
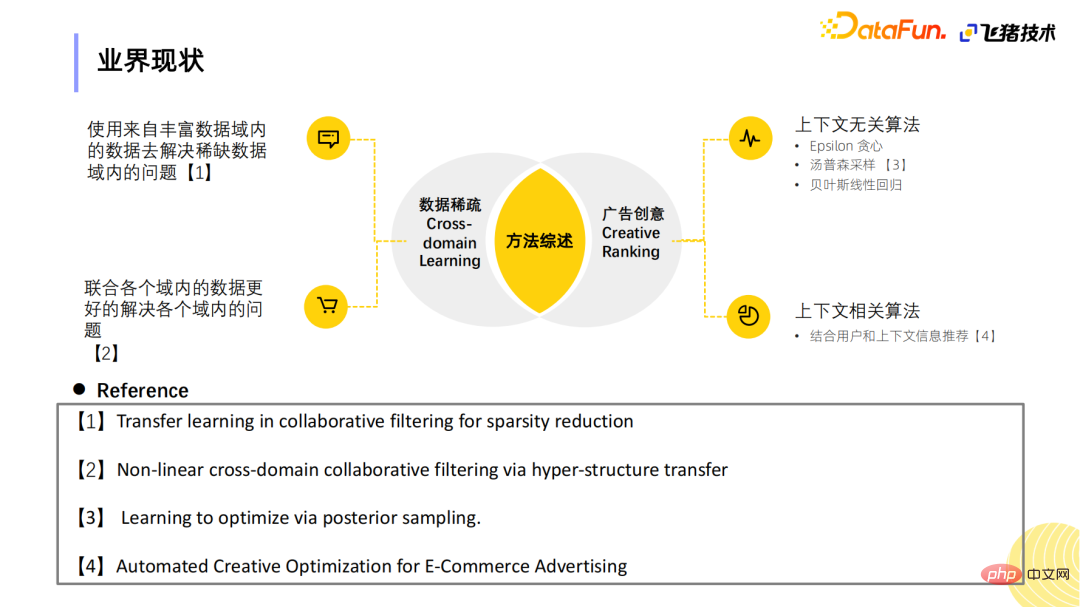
Let me briefly introduce the current situation of the industry.
Advertising creativity is divided into two broad categories of algorithms: one is context-independent algorithms, such as Epsilon greedy, or Thompson sampling, and some more elegant E&E algorithms made by Alimama students, such as Bayesian linear Regression-related; the other type is context-related algorithms, which add user and contextual information as recommendations.
To solve the problem of data sparseness, Cross-domain learning is mainly used to solve two problems, two related tasks, using data in rich data domains to solve problems in scarce data domains, and combining data in multiple domains to Solve problems in various domains.
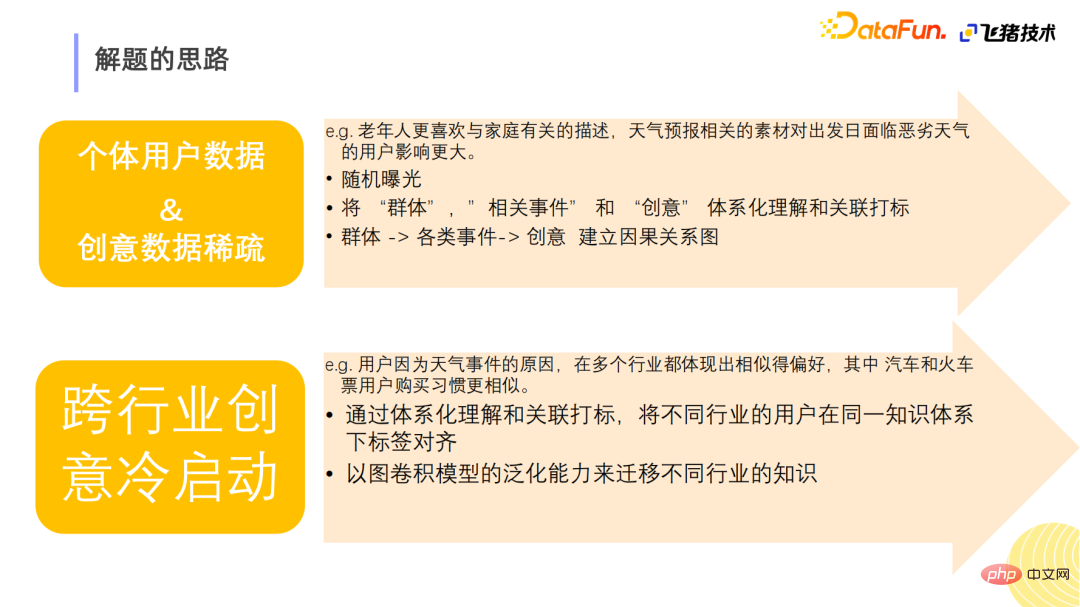
First of all, start with From the data insights, we can see that our data on the creative historical preferences of individual users is relatively sparse, but we can actually make some characterizations of group users. For example, it can be seen from the data that the elderly prefer descriptions related to family; when there is bad weather on the departure day, the air ticket industry is more sensitive to materials similar to weather forecasts. Then we can transform our thinking from individual user data to how to unify the understanding of groups, related events and creativity, and make group recommendations after association marking. After systematic understanding, establishing a causal relationship diagram among the three can solve some of the problems of sparse individual user data.
To address the problem of sparse creative data, our solution is to randomly expose new materials online when they come online.
Another problem is the cold start of cross-industry creativity. For example, we found that regarding weather event factors, no matter in various industries, everyone’s preferences are actually relatively similar, especially in the bus ticket or train ticket business, everyone’s purchasing habits are very similar, so some creative recommended knowledge is Migration can be carried out through the labeling and systematic understanding and label association just mentioned. By aligning labels of different industries under the same knowledge system, some generalization transfer of knowledge is performed through the generalization ability of the graph convolution model.
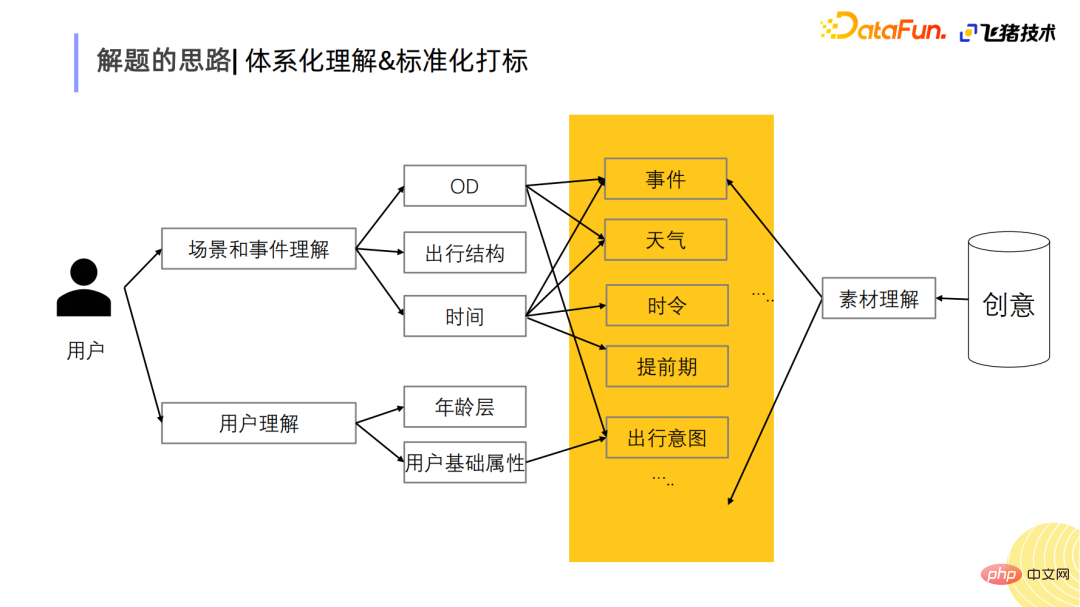
##The systematic understanding and standardized marking just mentioned are mainly divided into three parts:
One part is on the user side, where we will do some understanding of scenarios and events; the other part is on the user’s basic attributes; and finally, on the creative side, we will do some understanding Understand some graphic and text materials. Finally, all three are unified and standardized under the label system, which will help to establish the relationship between graphs later.
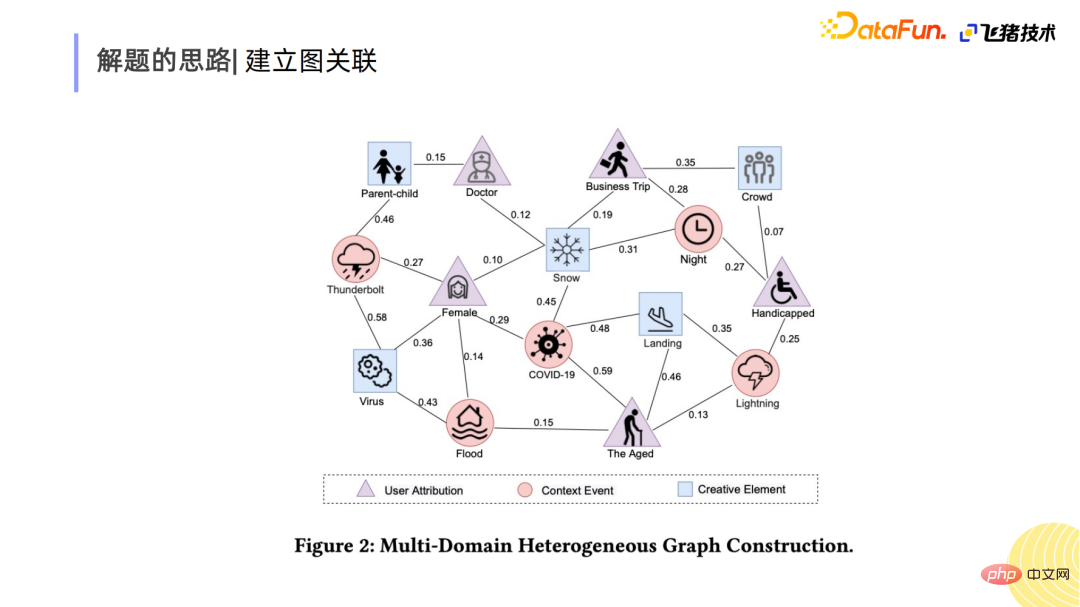
The picture above is a more obvious picture. Among them, the triangle symbols are some attributes on the user side, such as women or old people; the circle symbols are to classify events or context understanding, such as thunder or traveling at night; and the square symbols are the classification of materials.
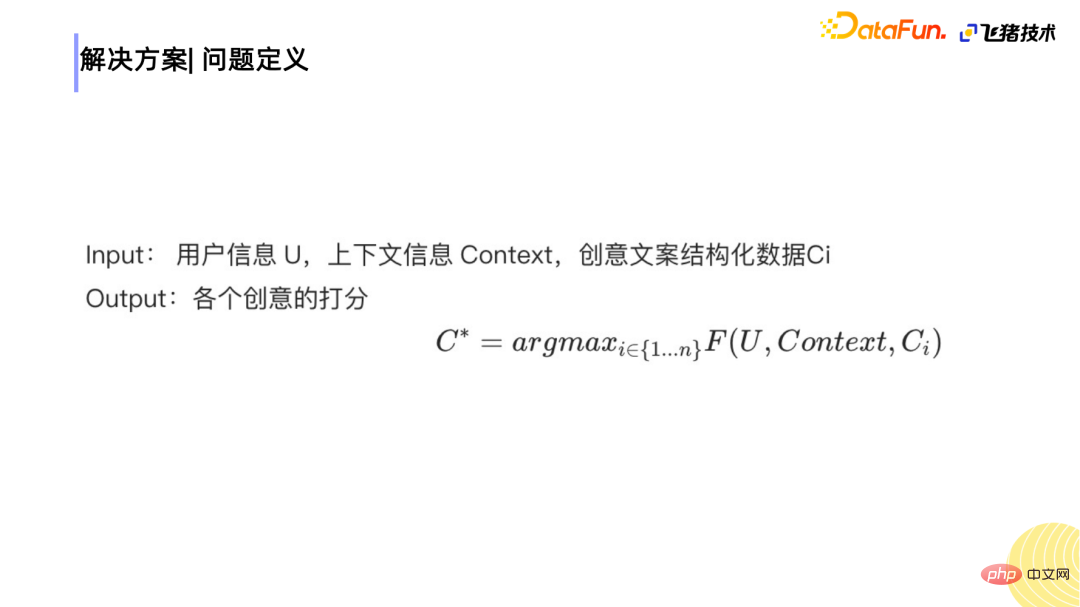
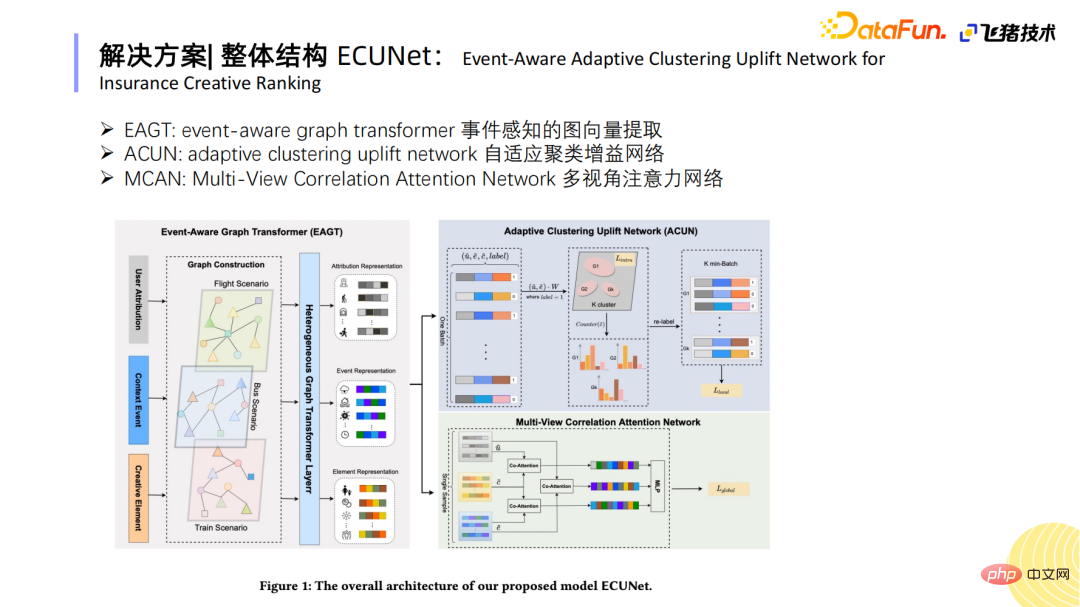
##Combining the solutions of the three types of ideas just mentioned, we A model design of the network structure is proposed. First define the problem: the input is user information, contextual information and structured information of creative copywriting, to sort and score advertising creatives, and then select the creative with the highest score to output to the user. #The picture above is the framework of the creative graphic and text recommendation process for insurance. #First of all, as mentioned above, in the creative module, we do not interfere with the sorting of insurance types or prices. The sorting of creative pictures and texts is As the final ordering logic for the link. When a user request comes in, four understandings are done. Event-level understanding, such as whether it is raining now; scene understanding, such as whether the user is multiple people with children or an elderly person; and understanding of the user's basic attributes. After the material library is also marked with the tags just mentioned, the label recall of the materials and the subsequent sorting of material creativity will be carried out. On the sorting side, a part of the traffic will be allocated for uniform online exposure. The other part is to do the work of creative optimization. The creative selection work is divided into two steps: One is to recall and rough sort the image materials, the other is to rough sort the copywriting materials, and finally Cartesian combination is used to display the creative copywriting we want. , and finally prioritize it through ECUNet. Based on the three solution ideas just mentioned, the design ECUNet solution. It is mainly divided into three parts: The first part is based on event-aware graph vector extraction, mainly on the offline side. The training process is to extract graph vectors for each user-side information, contextual information or creative information; the second part is the adaptive clustering gain network. The problem solved in this part is to use the uplift idea to utilize the group. Intelligently solve individual problems; the third part is to use the characteristics of the three parts of users and scenes, user events and creativity, and use the comprehensive vectors obtained through graph vector extraction to do Co-Attention between the two, with the purpose of extracting the mutual relationship between them. characteristics, and finally do the scoring. The construction of heterogeneous graphs is mainly divided into two parts : Part of it is node construction, and part of it is edge construction. Node construction is mainly when user samples come in and can be mapped to three types of nodes: user nodes, event nodes and creative nodes. After mapping to three types of nodes, edges can be constructed between nodes. The edge represents the importance of the insurance transformation of node a due to reason b. For example, the weight of student node a in bad weather node b will be higher than the weight of student node a in normal weather node. 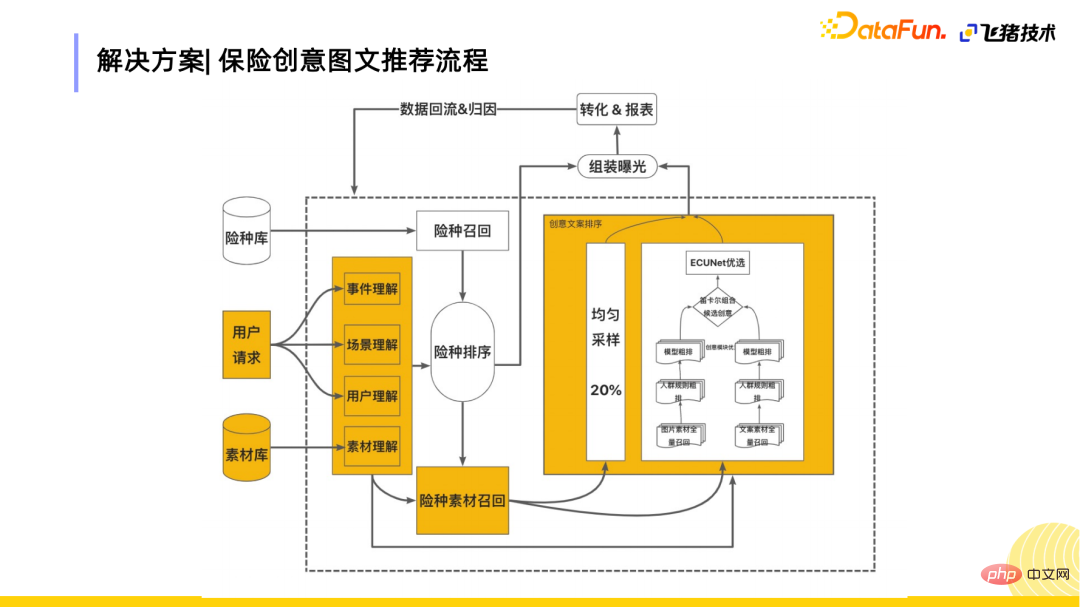
1. Overall structure ECUNet
2. EAGT: Constructing heterogeneous graphs
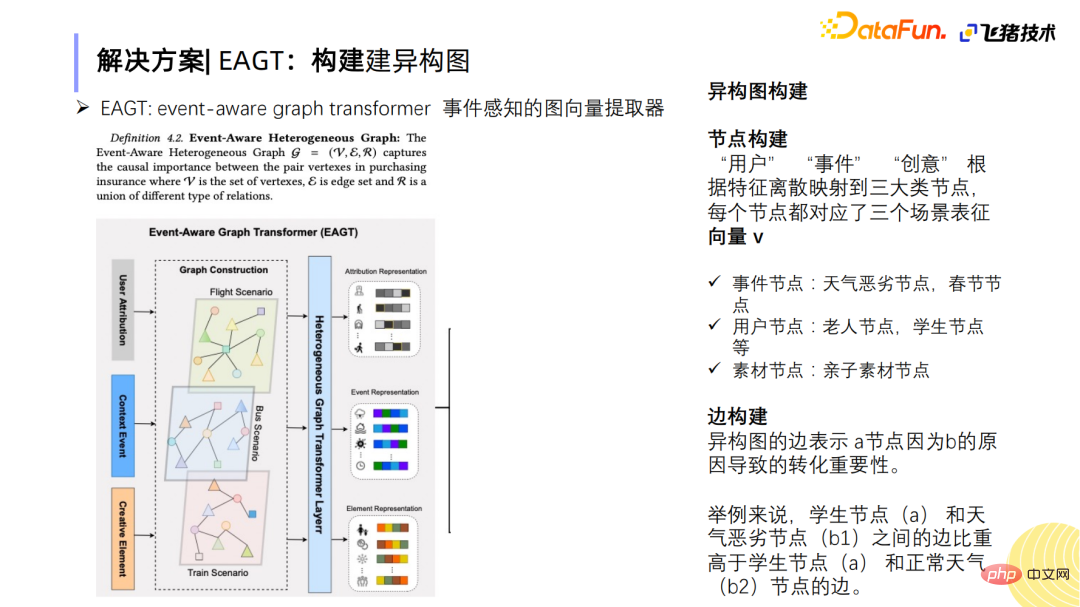
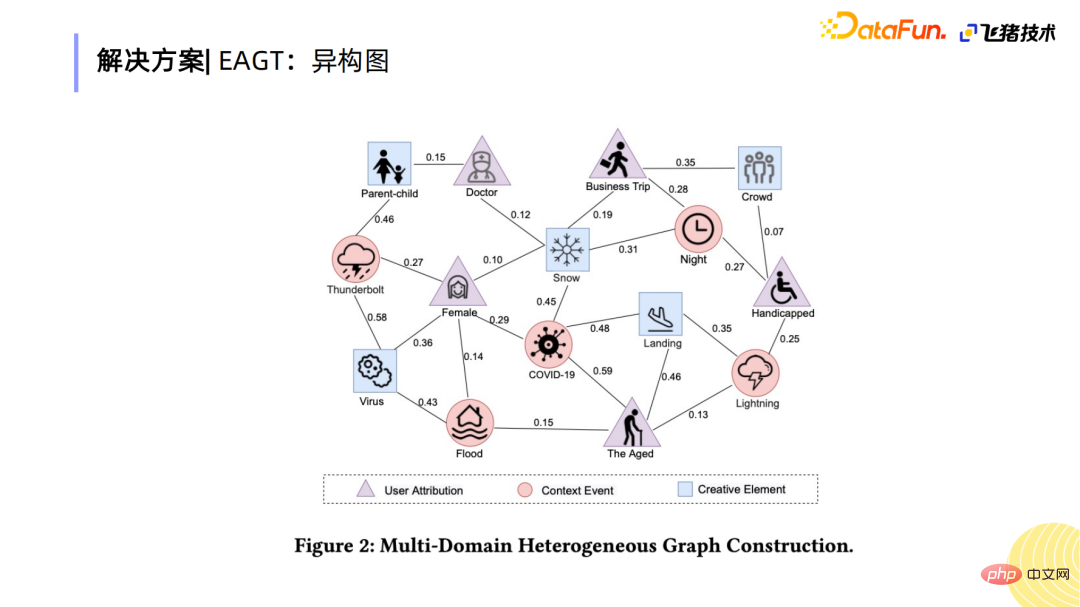
Based on the above method, a heterogeneous graph was constructed. Based on this graph, the node representation of the three scenes of each node is extracted by comparing conventional Node embedding.
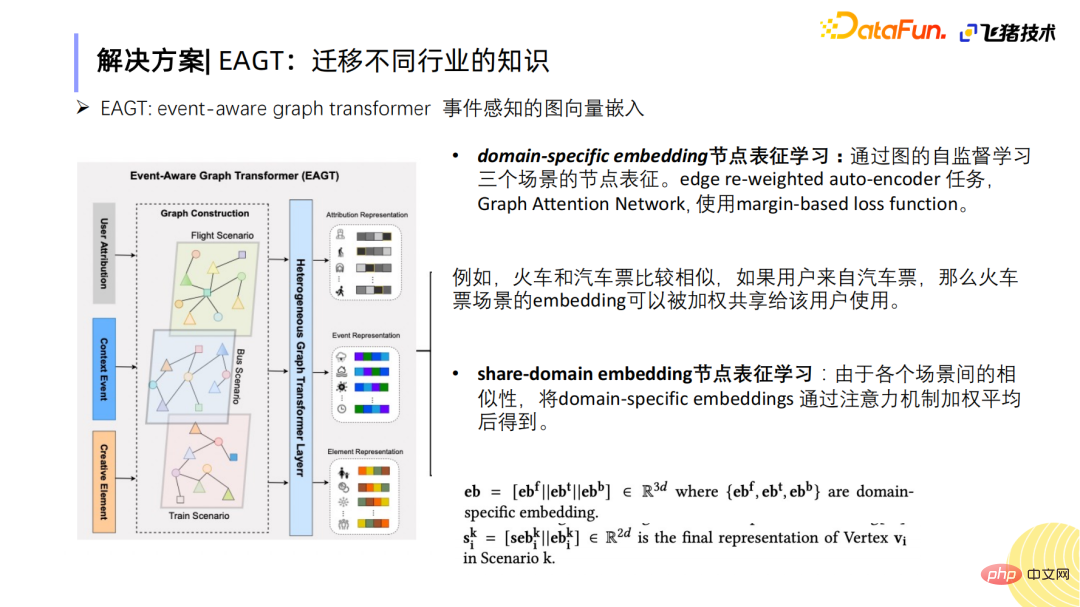
is mainly the task of edge prediction through self-supervised learning of graphs, and loss uses margin -based loss function, what is finally learned is the node representation of specific scenes, such as the three scenes of machine/fire/steam.
But in order to transfer knowledge from different industries and integrate it into other scene industries, we did share-domain embedding node representation learning. For example, train tickets and bus tickets are similar. If a user sample now comes from bus tickets, the embedding of the train ticket scene can also be weighted and shared for users to use. Based on this assumption, share-domain representation learning was performed. It mainly represents the nodes of three types of scenes and obtains specific embedding through the weighting of the attention mechanism.
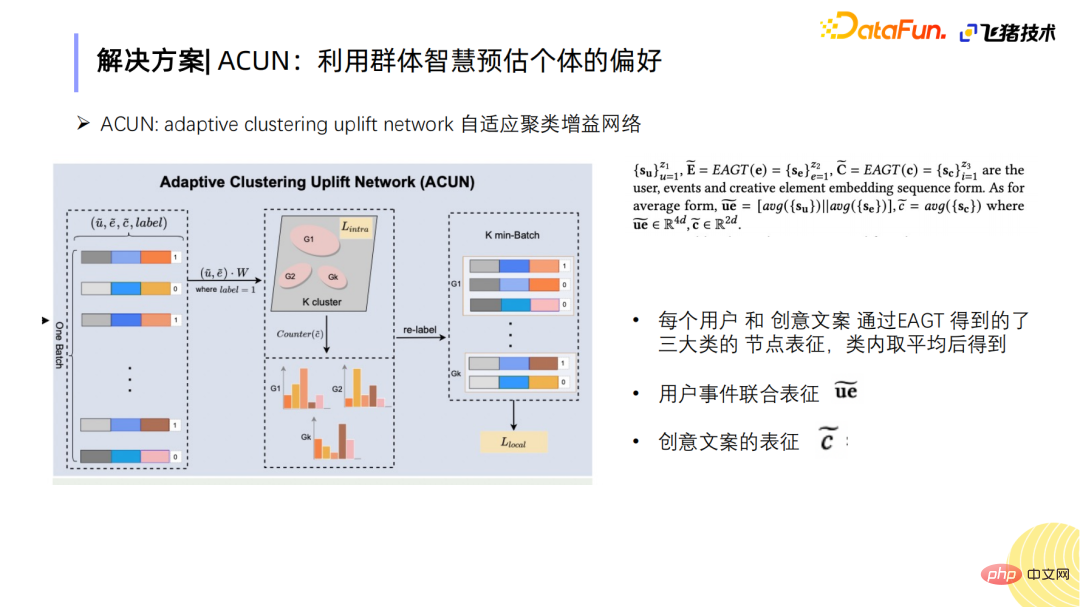
Through this EAGT Network we can extract three major categories of node representations. After each sample can obtain the node representations of three major categories, the average value within the category can be obtained to obtain the three node representations of users, events, and creative ideas. Finally, the joint representation of user events and the joint representation of each creative copy are input into Part 2 - Adaptive clustering gain network.
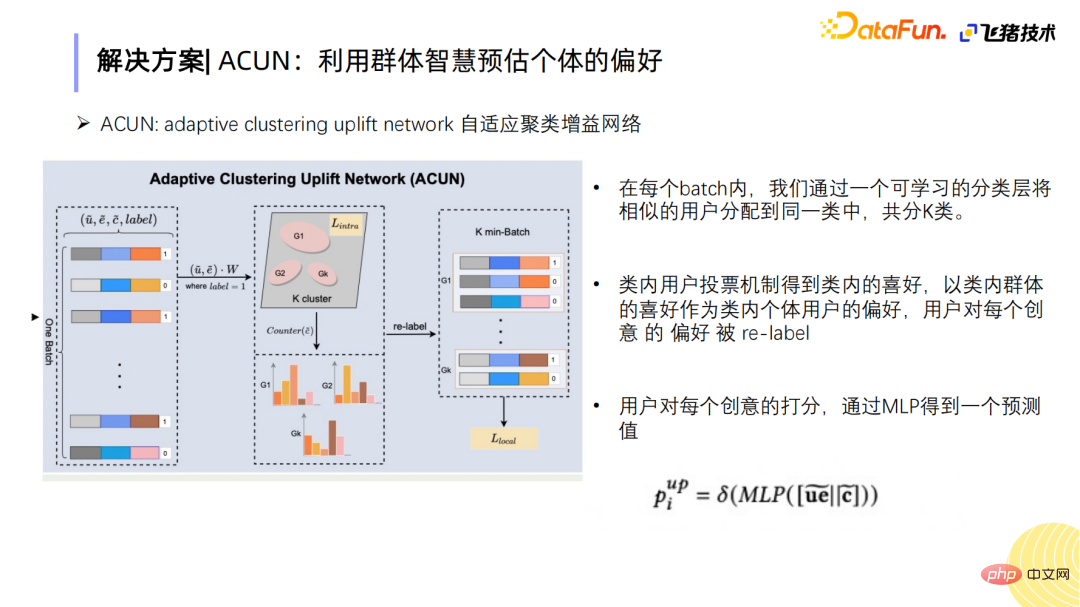
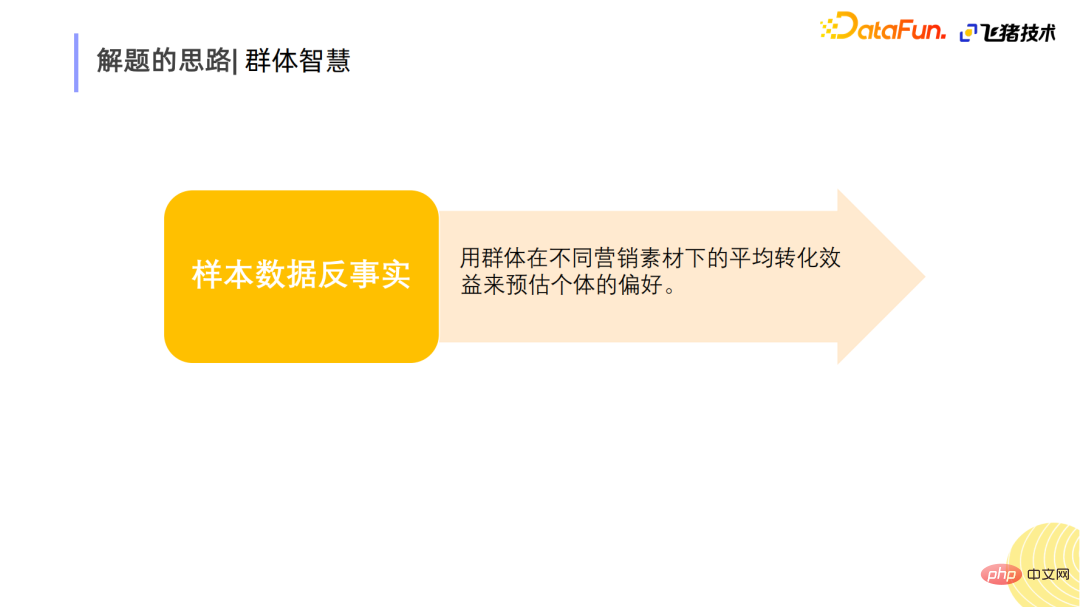
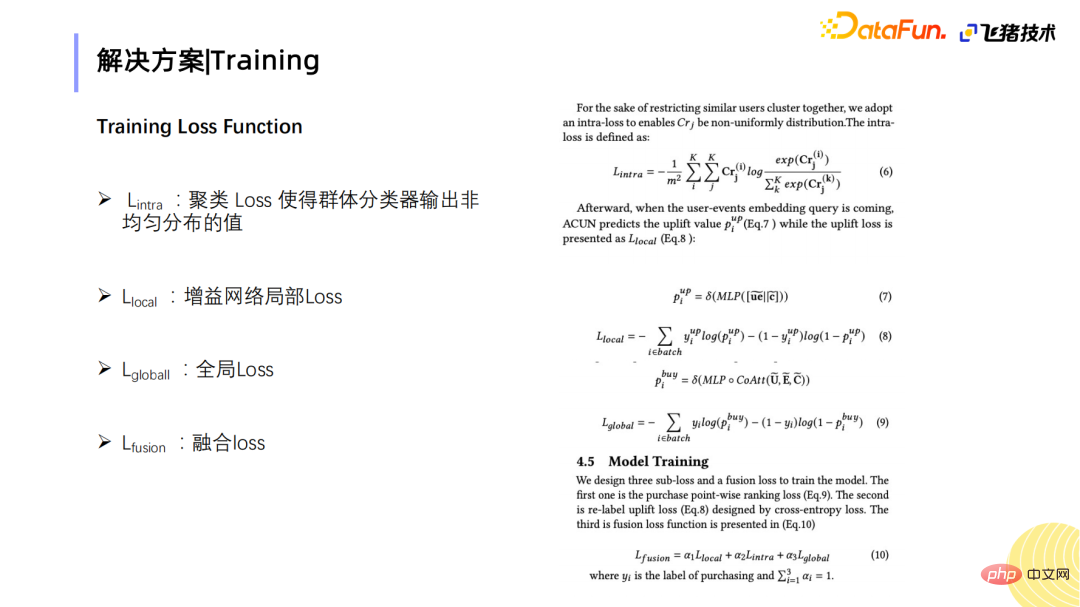
Use the wisdom of the crowd to estimate individual preferences, process It is performed based on operations within the batch. In each batch, users in each batch are classified into k major categories through a learnable classifier, hoping that similar users can be classified into the same category. Under the guarantee of the random sample sampling mechanism, users in the inner category can vote on similar creative copywriting to get which creative copywriting the inner category users are more interested in. Finally, the preferences of the in-group are used to represent the preferences of individual users, and then each sample is re-lable. For example, G1 is more sensitive to the third creative idea, and G2 is more sensitive to the second one. Users in the inner category will re-lable it again. After obtaining the re-lable sample, perform MLP prediction to obtain the predicted value.
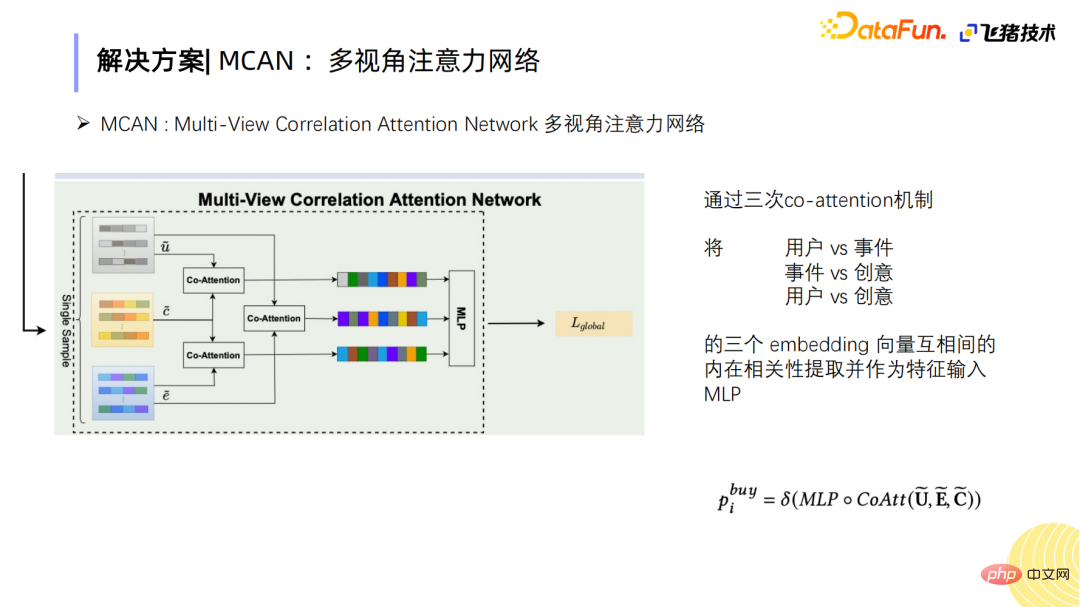
##Multi-perspective attention network, the main purpose is Through the three-dimensional Co-attention mechanism, the intrinsic related interests between users and events, events and ideas, and users and ideas can be extracted as important features for prediction.
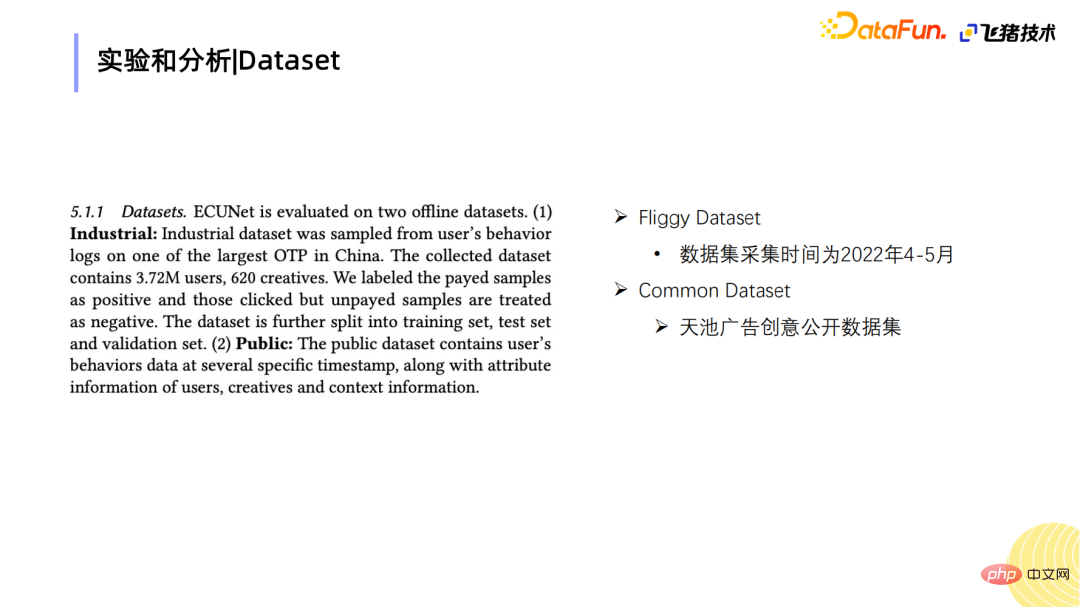
Part of our Dataset is from the industry, collected from Yu Feizhu’s Dataset. The other part is the public data set of Tianchi Advertising Creative.
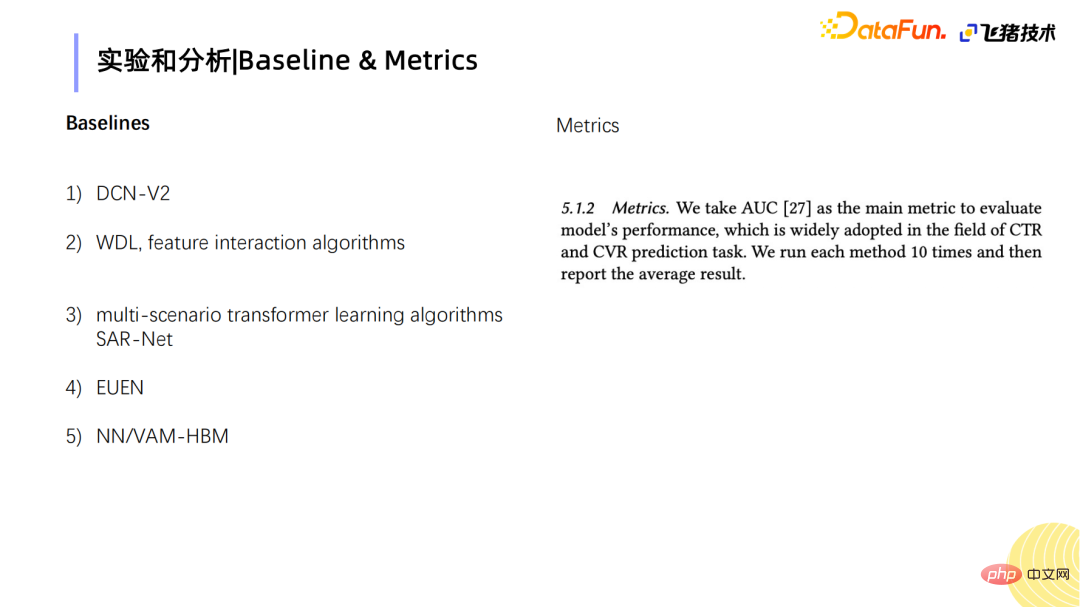
We also studied the ranking algorithm of advertising creatives in the industry, as well as some baselines on user interests and cross-scenario learning. For comparison, Metrics are mainly AUC.
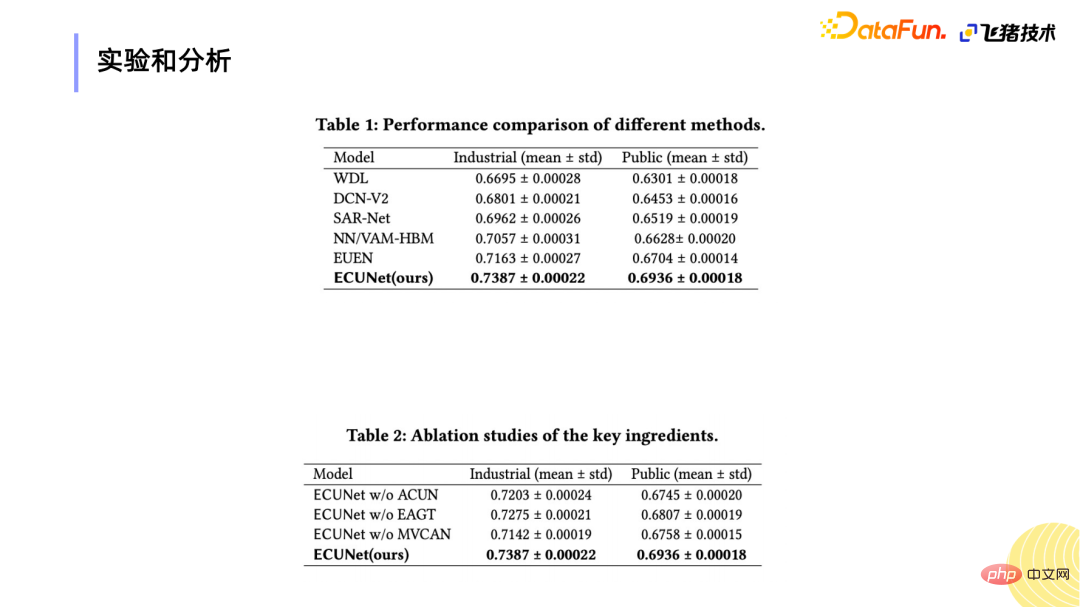
It can be seen from the experimental data that after the design of our network structure, there has been a certain improvement in AUC. Among them, the improvement of multi-view networks is more obvious, followed by gain networks, and then the structure of heterogeneous graph networks.
We have also collected some cases online and can learn some things about users’ scenarios. For example, weather information or long and short pictures and other scenes.
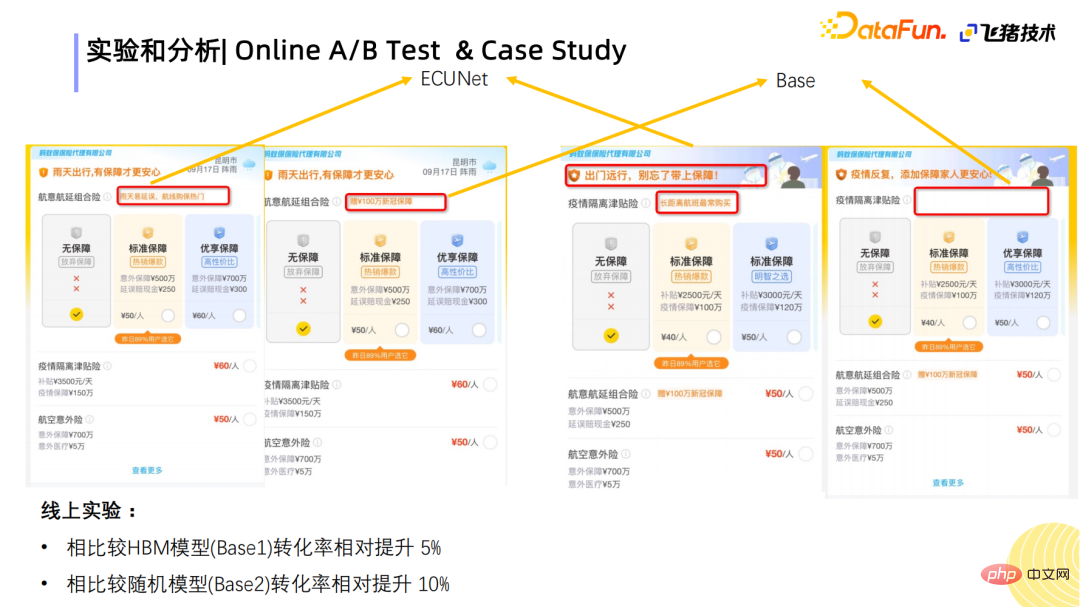
We have also done some experiments online. Compared with the Base2 random model, the improvement Compared with the advertising creative HPM model just mentioned, it has increased by 10%. ##5. Summary and Outlook
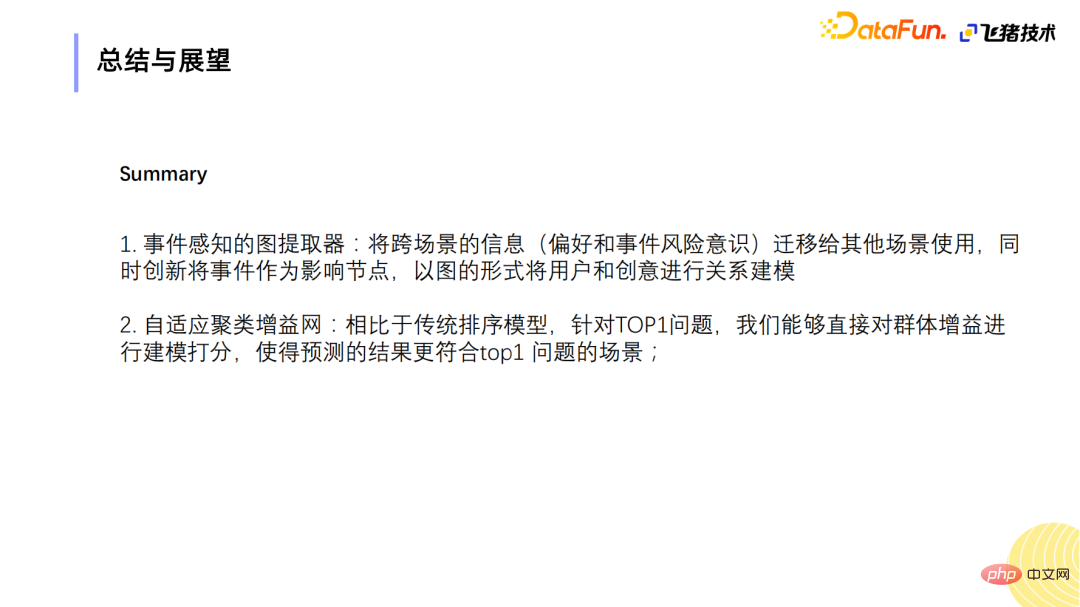
Event-aware graph extractor:
Currently in the industry There is less consideration for event perception, especially in the creative recommendation module. Our work is relatively innovative. By integrating some cross-scenario information, such as user preferences for certain insurance types, certain graphics and texts, or the migration of events between cross-scenarios. At the same time, this event is used as an influence node to model the relationship between users and creativity in the form of a graph. Adaptive clustering gain network:
Compared with traditional ranking problems, creative recommendation is a Top1 The problem is faced with some counterfactual phenomena encountered in causal inference. We can also better alleviate it through group gain learning. 6. Question and Answer Session
Scenario understanding, for example, in the search scenario, you can use some intentions in Query to analyze what the user wants to buy this time, but in insurance recommendations It is difficult to obtain what insurance the user wants to buy from the contextual information. Therefore, scenario understanding is more through reasoning. First, it is a data analysis insight, and then through some features. Above, we can see which scenarios have a transformation effect on users purchasing insurance or users purchasing ideas, and then integrate them into tags. In the system, we mainly do some things on the labeling side.
#Q2: What form of embedding does the creative copywriter do first?
A3: Regarding edges, we mainly do a process similar to conditional transformation probability. For example, the conversion rate of a student node may be higher under bad weather conditions. In some cases, edge cropping operations will be performed. Edge representation learning is not involved, this is mainly in the learning process of nodes. A4: Event copywriting is still a bit manual. Because there have been many incidents in the insurance industry this year, we will also take a look at the impact period of each incident. The approximate cycle will be about one week to two weeks, so the time cycle of this area will also be controlled within this range. # Regarding the timeliness of copywriting, let’s bind the copywriting into a strong rule. For example, the Mid-Autumn Festival just passed some time ago. If we have Mid-Autumn Festival copywriting, then this copywriting will only take effect during the Mid-Autumn Festival. For example, if your departure time is during the Mid-Autumn Festival, or if your purchase time is during the Mid-Autumn Festival, it will be recalled, and it will definitely not be recalled at other times. That’s it for today’s sharing, thank you all. Q3: Is there any special treatment for edges in heterogeneous graph networks? Are different types of edges distinguished? Does the learning process involve representation learning and processing of edges?
#Q4: How timely is the event copywriting?
The above is the detailed content of Application of event-aware clustering gain network in creative ranking of Fliggy Insurance. For more information, please follow other related articles on the PHP Chinese website!


