

To show the distribution of colleges and universities, you must first obtain the location data of colleges and universities across the country. The data for this article comes from the Palm College Entrance Examination Network (https://www.gaokao.cn/school/search).

When writing this article in June 2022, a total of 2,822 colleges and universities information was obtained. After checking the data, except for a few null values, the entire data is very complete and does not affect use. The data has a total of 44 fields. This article will only use a few fields. They do not need to be processed and can be obtained on demand when using them.
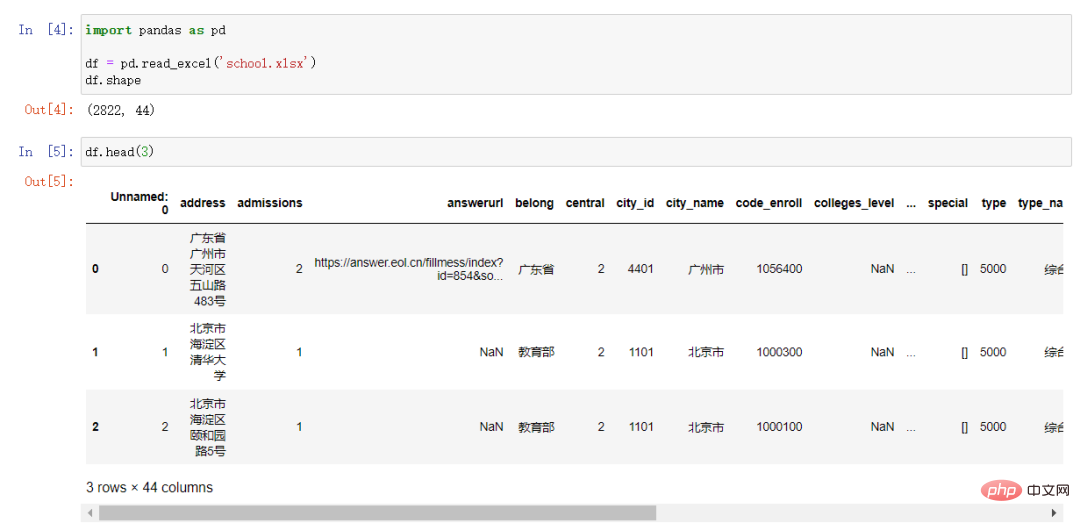
##Introduction to data acquisition methods (basic crawler knowledge):
1. Register and log in to the Palm College Entrance Examination Network. Select all schools on the page.
2. Press the F12 key, click to Network > Fetch/XHR, and then click , ## on the page several times # button, the accessed API and other information will be displayed on the XHR page.
The numFound parameter value in the Response is the total number of schools. Divide by the number of schools displayed on each page to get the total number of pages. You can also directly click
on the page to view the total number of pages. , thus determining the number of visits.
Warm reminder: When obtaining data, you need to comply with the relevant statements of the website. Try to set a certain time interval for the crawler code, and do not use it during peak access times. Run the crawler code regularly.Additional explanation:
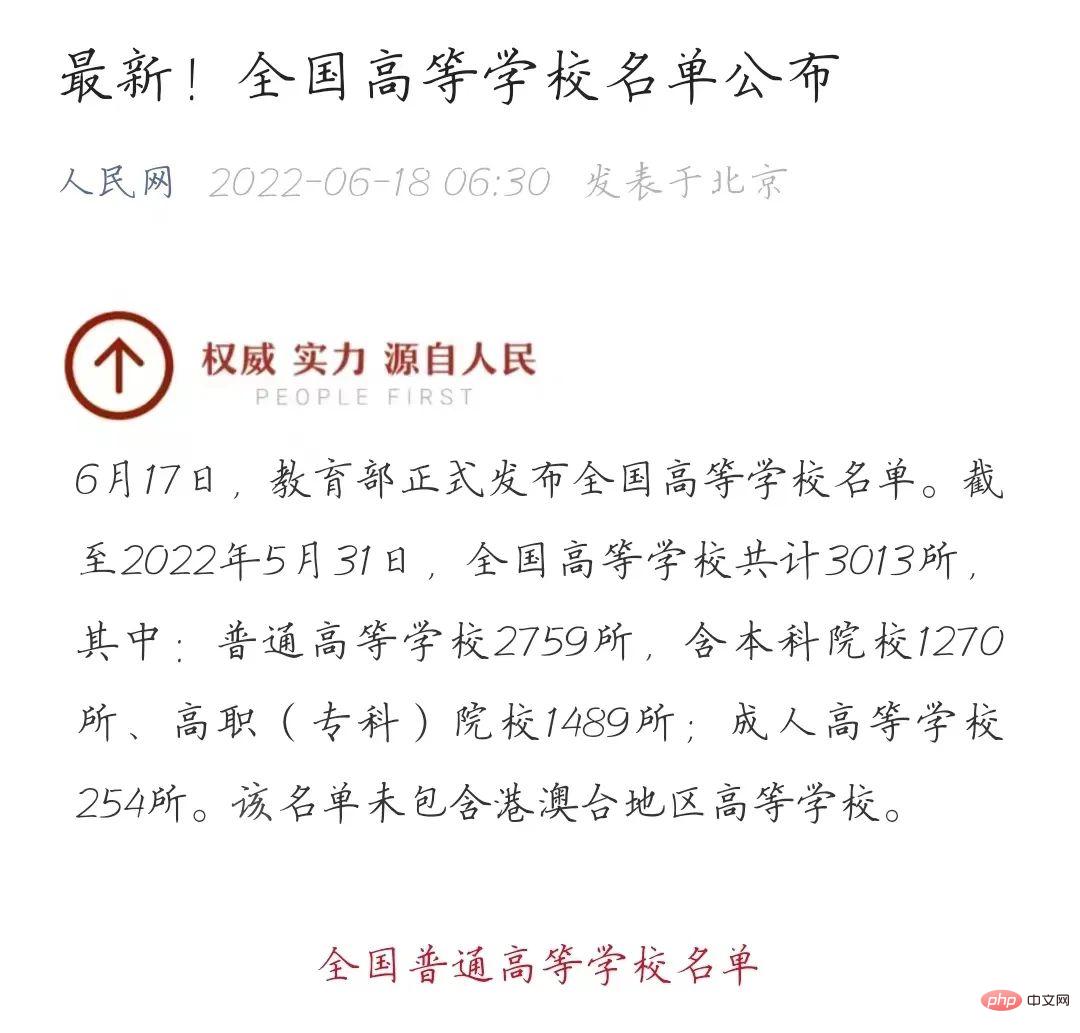
The latest announcement from People’s Daily Online: the number of general colleges and universities in the country is 2,759. This article is from the Pocket College Entrance Examination Network The difference in the obtained 2822 schools is 63, mainly due to the difference in statistical methods of branch branches of some schools. What this article shows is the distribution, and this difference has little impact.
This article uses Baidu Maps open platform: https://lbsyun.baidu.com/apiconsole/center#/home, you can use Baidu Maps Open interface to obtain the latitude and longitude of a geographical location.
The steps are:
1. Register and log in to a Baidu account. This account can be a common account for the entire Baidu ecosystem (such as accounts for network disks, libraries, etc. are common).
2. Log in to Baidu Map Open Platform, click to enter , then click in , and then click Create an application. Customize the application name, fill in other information as prompted and required, and conduct real-name authentication to become an individual developer.

##3. After creating the application, you will get an application , use this AK value to call Baidu's API, the reference code is as follows.
import requests


def baidu_api(addr):
url = "http://api.map.baidu.com/geocoding/v3/?"
params = {
"address": addr,
"output": "json",
"ak": "复制你创建的应用AK到此"
}
req = requests.get(url, params)
res = req.json()
if len(res["result"]) > 0:
loc = res["result"]["location"]
return loc
else:
print("获取{}经纬度失败".format(addr))
return {'lng': '', 'lat': ''}4. After successfully calling Baidu Map API, read the locations of all colleges and universities, call the above function in sequence, obtain the longitude and latitude of all colleges and universities, and rewrite it into excel.
import pandas as pd
import numpy as np


def get_lng_lat():
df = pd.read_excel('school.xlsx')
lng_lat = []
for row_index, row_data in df.iterrows():
addr = row_data['address']
if addr is np.nan:
addr = row_data['city_name'] + row_data['county_name']
# print(addr)
loc = baidu_api(addr.split(',')[0])
lng_lat.append(loc)
df['经纬度'] = lng_lat
df['经度'] = df['经纬度'].apply(lambda x: x['lng'])
df['纬度'] = df['经纬度'].apply(lambda x: x['lat'])
df.to_excel('school_lng_lat.xlsx')The final data results are as follows:

Individual developers need to use Baidu Map Open Platform Note that there is a daily quota limit, so when debugging the code, do not use all the data first, use the demo first, otherwise you will have to wait a day or purchase quota.

pip install pyecharts
1. Mark the location of the universityfrom pyecharts.charts import Geo
from pyecharts import options as opts
from pyecharts.globals import GeoType
import pandas as pd
def multi_location_mark():
"""批量标注点"""
geo = Geo(init_opts=opts.InitOpts(bg_color='black', width='1600px', height='900px'))
df = pd.read_excel('school_lng_lat.xlsx')
for row_index, row_data in df.iterrows():
geo.add_coordinate(row_data['name'], row_data['经度'], row_data['纬度'])
data_pair = [(name, 2) for name in df['name']]
geo.add_schema(
maptype='china', is_roam=True, itemstyle_opts=opts.ItemStyleOpts(color='#323c48', border_color='#408080')
).add(
'', data_pair=data_pair, type_=GeoType.SCATTER, symbol='pin', symbol_size=16, color='#CC3300'
).set_series_opts(
label_opts=opts.LabelOpts(is_show=False)
).set_global_opts(
title_opts=opts.TitleOpts(title='全国高校位置标注图', pos_left='650', pos_top='20',
title_textstyle_opts=opts.TextStyleOpts(color='white', font_size=16))
).render('high_school_mark.html')
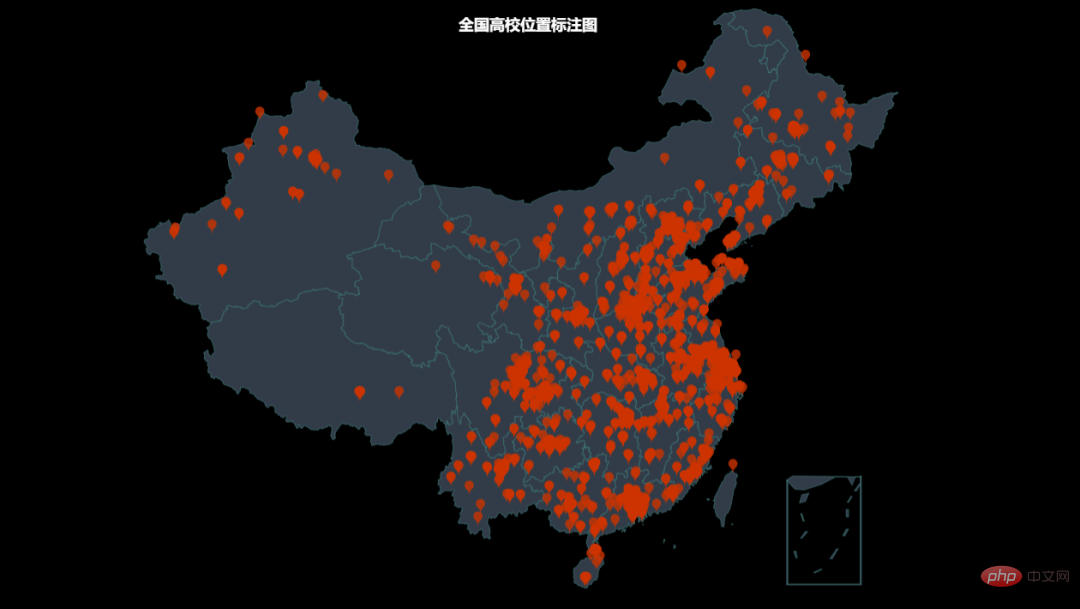
from pyecharts.charts import Geo
from pyecharts import options as opts
from pyecharts.globals import ChartType
import pandas as pd

def draw_location_heatmap():
"""绘制热力图"""
geo = Geo(init_opts=opts.InitOpts(bg_color='black', width='1600px', height='900px'))
df = pd.read_excel('school_lng_lat.xlsx')
for row_index, row_data in df.iterrows():
geo.add_coordinate(row_data['name'], row_data['经度'], row_data['纬度'])
data_pair = [(name, 2) for name in df['name']]
geo.add_schema(
maptype='china', is_roam=True, itemstyle_opts=opts.ItemStyleOpts(color='#323c48', border_color='#408080')
).add(
'', data_pair=data_pair, type_=ChartType.HEATMAP
).set_series_opts(
label_opts=opts.LabelOpts(is_show=False)
).set_global_opts(
title_opts=opts.TitleOpts(title='全国高校分布热力图', pos_left='650', pos_top='20',
title_textstyle_opts=opts.TextStyleOpts(color='white', font_size=16)),
visualmap_opts=opts.VisualMapOpts()
).render('high_school_heatmap.html')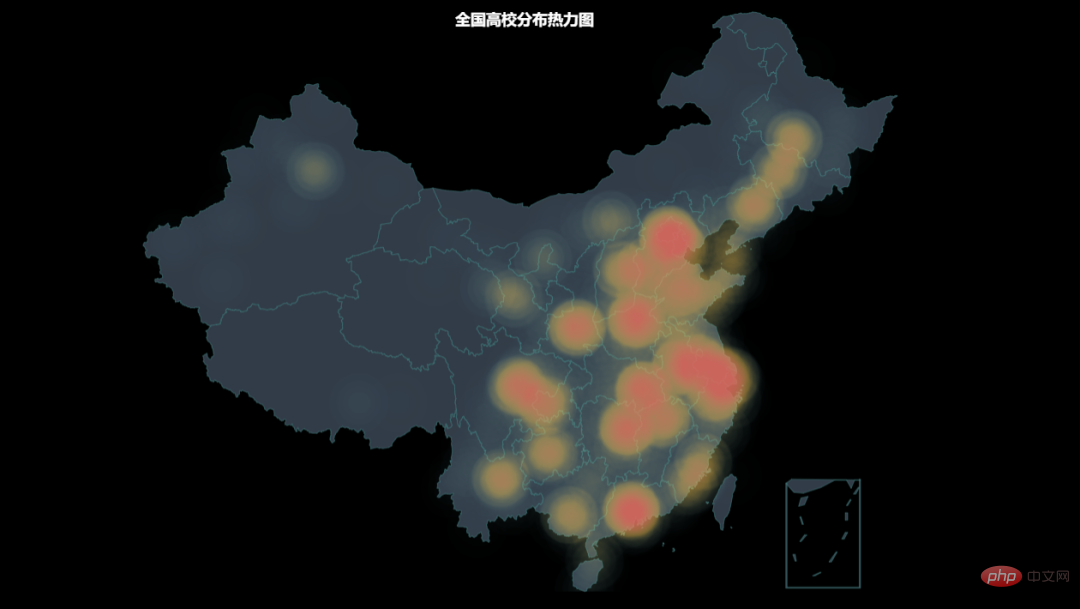
from pyecharts.charts import Map
from pyecharts import options as opts
import pandas as pd


def draw_location_density_map():
"""绘制各省高校分布密度图"""
map = Map(init_opts=opts.InitOpts(bg_color='black', width='1200px', height='700px'))
df = pd.read_excel('school_lng_lat.xlsx')
s = df['province_name'].value_counts()
data_pair = [[province, int(s[province])] for province in s.index]
map.add(
'', data_pair=data_pair, maptype="china"
).set_global_opts(
title_opts=opts.TitleOpts(title='全国高校按省分布密度图', pos_left='500', pos_top='70',
title_textstyle_opts=opts.TextStyleOpts(color='white', font_size=16)),
visualmap_opts=opts.VisualMapOpts(max_=200, is_piecewise=True, pos_left='100', pos_bottom='100',textstyle_opts=opts.TextStyleOpts(color='white', font_size=16))
).render("high_school_density.html")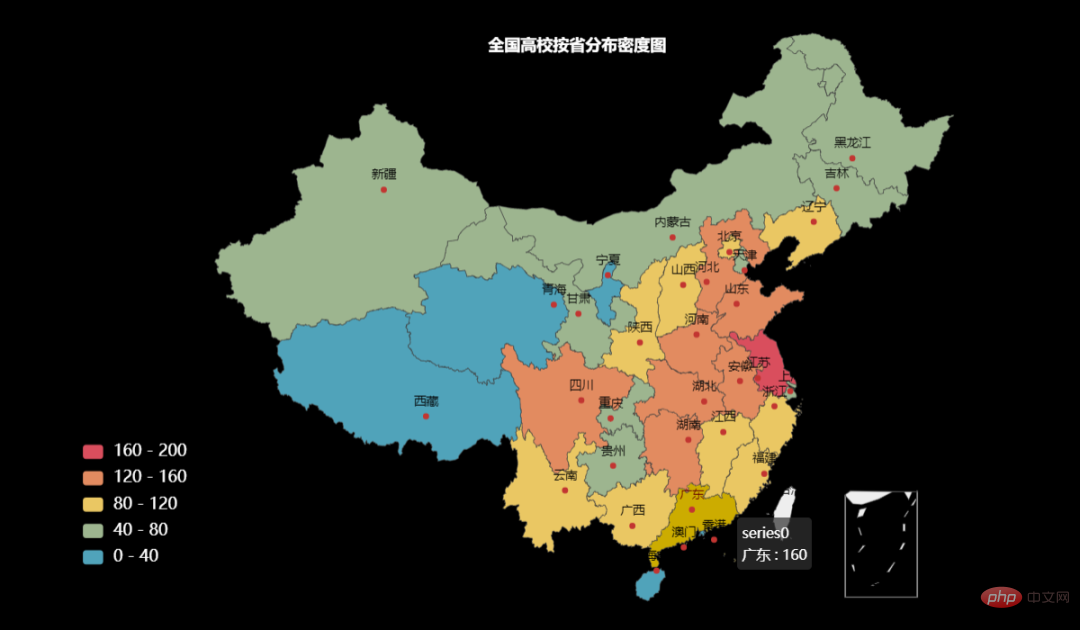
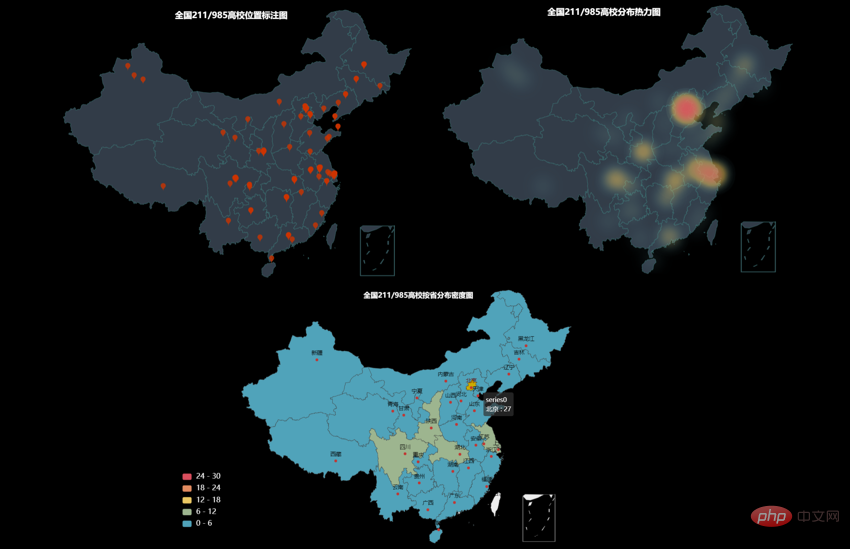
Filter out the data of 211 and 985 colleges and universities and draw it again. (The code does not need to be pasted repeatedly, just add a line of filtering code)
The above is the detailed content of Use Python to display the distribution of colleges and universities across the country. For more information, please follow other related articles on the PHP Chinese website!


