
 Backend Development
Python Tutorial
Understanding hierarchical clustering in one article (Python code)
Backend Development
Python Tutorial
Understanding hierarchical clustering in one article (Python code)
Understanding hierarchical clustering in one article (Python code)


First of all, clustering belongs to unsupervised learning of machine learning, and there are many methods, such as the well-known K-means. Hierarchical clustering is also a type of clustering and is also very commonly used. Next, I will briefly review the basic principles of K-means, and then slowly introduce the definition and hierarchical steps of hierarchical clustering, which will be more helpful for everyone to understand.
What is the difference between hierarchical clustering and K-means?
The working principle of K-means can be briefly summarized as:
- Determine the number of clusters (k)
- Randomly select k points from the data as centroids
- Assign all points to the nearest cluster centroid
- Calculate the centroid of the newly formed cluster
- Repeat steps 3 and 4
This is an iteration process until the centroids of newly formed clusters remain unchanged or the maximum number of iterations is reached.
But K-means has some shortcomings. We must decide the number of clusters K before the algorithm starts. But actually we don’t know how many clusters there should be, so we usually base it on our own understanding. Set a value first, which may lead to some deviations between our understanding and the actual situation.
Hierarchical clustering is completely different. It does not require us to specify the number of clusters at the beginning. Instead, it first completely forms the entire hierarchical clustering, and then by determining the appropriate distance, the corresponding cluster number and sum can be automatically found. clustering.
What is hierarchical clustering?
Let’s introduce what hierarchical clustering is from shallow to deep. Let’s start with a simple example.
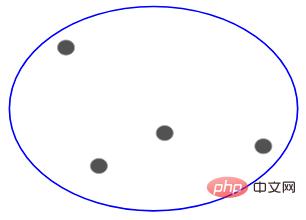
Suppose we have the following points and we want to group them:

We can assign each of these points to a separate cluster, Just 4 clusters (4 colors):

Then based on the similarity (distance) of these clusters, the most similar (closest) points are grouped together and Repeat this process until only one cluster remains:
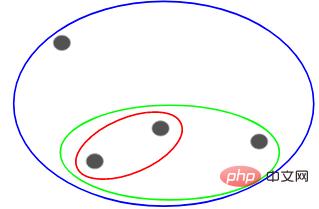
The above is essentially building a hierarchy. Let’s understand this first, and we will introduce its layering steps in detail later.
Types of hierarchical clustering
There are two main types of hierarchical clustering:
- Agglomerative hierarchical clustering
- Split hierarchical clustering
Agglomerative hierarchical clustering
First let all points become a separate cluster, and then continue to combine them through similarity until there is only one cluster in the end. This is agglomerative hierarchical clustering. The process is consistent with what we just said above.
Split hierarchical clustering
Split hierarchical clustering is just the opposite. It starts from a single cluster and gradually splits it until it cannot be split, that is, each point is a cluster.
So it doesn’t matter whether there are 10, 100, or 1000 data points, these points all belong to the same cluster at the beginning:
Now, Split the two furthest points in the cluster at each iteration, and repeat this process until each cluster contains only one point:
#The above process is splitting Hierarchical clustering.
Steps to perform hierarchical clustering
The general process of hierarchical clustering has been described above, but now comes the key point, how to determine the similarity between points?
This is one of the most important issues in clustering. The general method of calculating similarity is to calculate the distance between the centroids of these clusters. The points with minimum distance are called similar points and we can merge them or we can call it distance based algorithm.
Also in hierarchical clustering, there is a concept called proximity matrix, which stores the distance between each point. Below we use an example to understand how to calculate similarity, proximity matrix, and the specific steps of hierarchical clustering.
Case Introduction
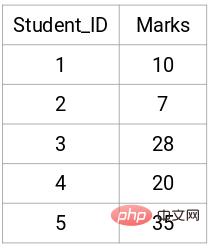
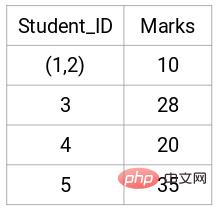
Suppose a teacher wants to divide students into different groups. Now I have the scores of each student on the assignment, and I want to divide them into groups based on these scores. There is no set goal here as to how many groups to have. Since the teacher does not know which type of students should be assigned to which group, it cannot be solved as a supervised learning problem. Below, we will try to apply hierarchical clustering to classify students into different groups.
The following are the results of 5 students:
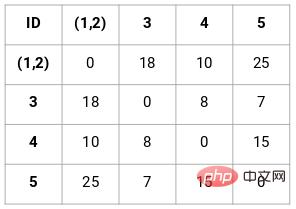
Create a proximity matrix
First, we need to create a proximity matrix, which stores the distance between each point, so we can get a shape of n Square matrix of X n.
In this case, the following 5 x 5 proximity matrix can be obtained:

There are two points to note in the matrix:
- The diagonal elements of a matrix are always 0 because the distance of a point from itself is always 0
- Use the Euclidean distance formula to calculate the distance of non-diagonal elements
For example, if we want to calculate the distance between points 1 and 2, the calculation formula is:
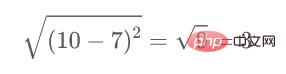
Similarly, fill in the remaining elements of the proximity matrix after completing this calculation method.
Perform hierarchical clustering
This is implemented using agglomerative hierarchical clustering.
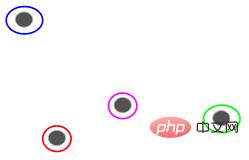
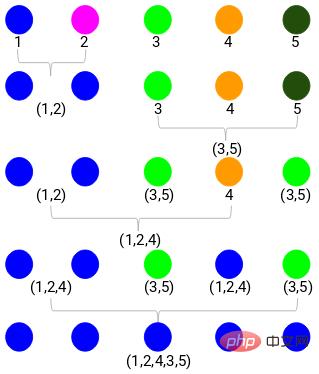
Step 1: First, we assign all points into a single cluster:
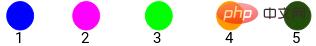
Here different colors represent different clusters, 5 of them in our data point, that is, there are 5 different clusters.
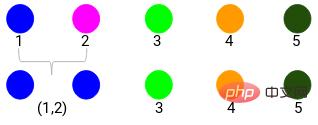
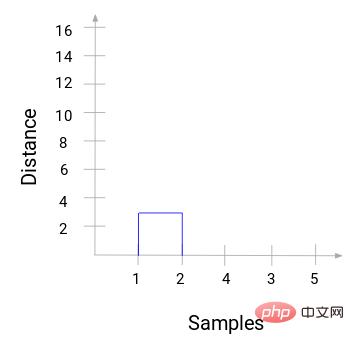
Step 2: Next, we need to find the minimum distance in the proximity matrix and merge the points with the smallest distance. Then we update the proximity matrix:
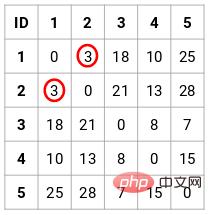
The minimum distance is 3, so we will merge points 1 and 2:
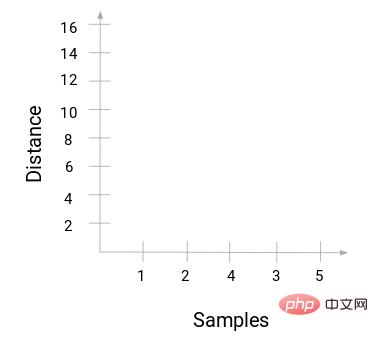

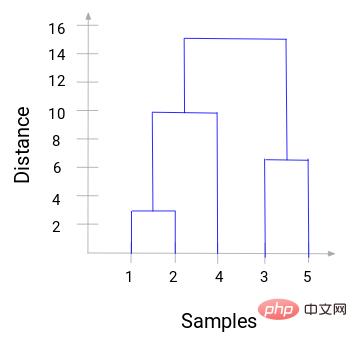
With a dendrogram, we can clearly visualize the steps of hierarchical clustering. The farther apart the vertical lines in the dendrogram are, the greater the distance between clusters.
With this dendrogram, it is much easier for us to determine the number of clusters.
Now we can set a threshold distance and draw a horizontal line. For example, we set the threshold to 12 and draw a horizontal line as follows:
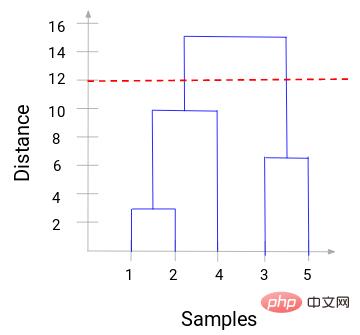
As you can see from the intersection point, the number of clusters is the intersection of the threshold horizontal line and the vertical line quantity (red line intersects 2 vertical lines, we will have 2 clusters). Corresponding to the abscissa, one cluster will have a sample set (1,2,4), and the other cluster will have a sample set (3,5).
In this way, we solve the problem of determining the number of clusters in hierarchical clustering through a dendrogram.
Python code practical case
The above is the theoretical basis, and anyone with a little mathematical foundation can understand it. Here's how to implement this process using Python code. Here is a customer segmentation data to show.
The data set and code are in my GitHub repository:
https://github.com/xiaoyusmd/PythonDataScience
If you find it helpful, please give it a star!
This data comes from the UCI machine learning library. Our aim is to segment wholesale distributors’ customers based on their annual spend on different product categories such as milk, groceries, regions, etc.
First standardize the data to make all data in the same dimension easy to calculate, and then apply hierarchical clustering to segment customers.
from sklearn.preprocessing import normalize
data_scaled = normalize(data)
data_scaled = pd.DataFrame(data_scaled, columns=data.columns)
import scipy.cluster.hierarchy as shc
plt.figure(figsize=(10, 7))
plt.title("Dendrograms")
dend = shc.dendrogram(shc.linkage(data_scaled, method='ward'))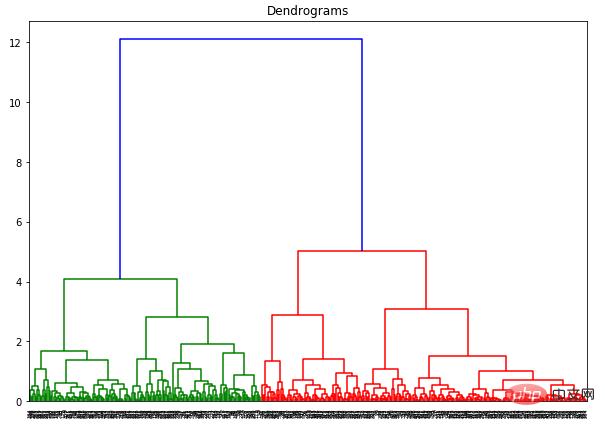
The x-axis contains all samples, and the y-axis represents the distance between these samples. The vertical line with the largest distance is the blue line. Suppose we decide to cut the dendrogram with a threshold of 6:
plt.figure(figsize=(10, 7))
plt.title("Dendrograms")
dend = shc.dendrogram(shc.linkage(data_scaled, method='ward'))
plt.axhline(y=6, color='r', linestyle='--')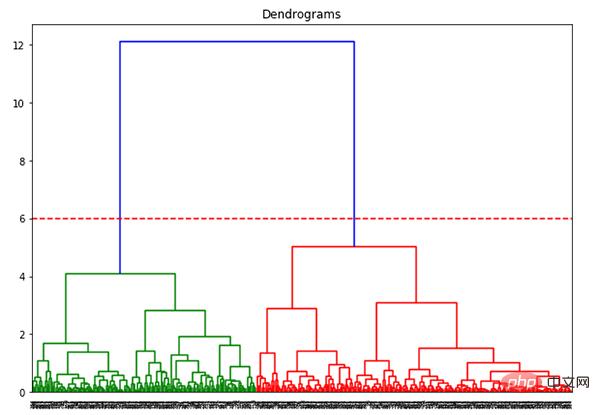
Now that we have two clusters, we need to Apply hierarchical clustering on clusters:
from sklearn.cluster import AgglomerativeClustering
cluster = AgglomerativeClustering(n_clusters=2, affinity='euclidean', linkage='ward')
cluster.fit_predict(data_scaled)
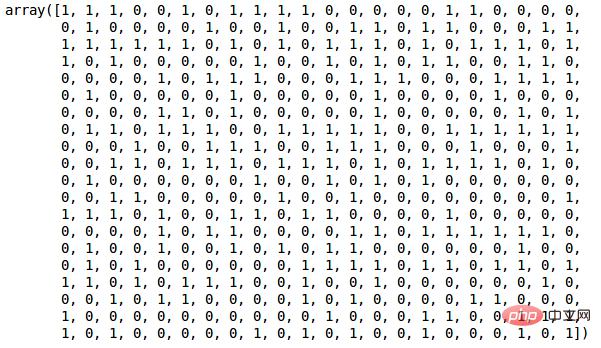
Since we have defined 2 clusters, we can see the values of 0 and 1 in the output. 0 represents a point belonging to the first cluster, and 1 represents a point belonging to the second cluster.
plt.figure(figsize=(10, 7))
plt.scatter(data_scaled['Milk'], data_scaled['Grocery'], c=cluster.labels_)
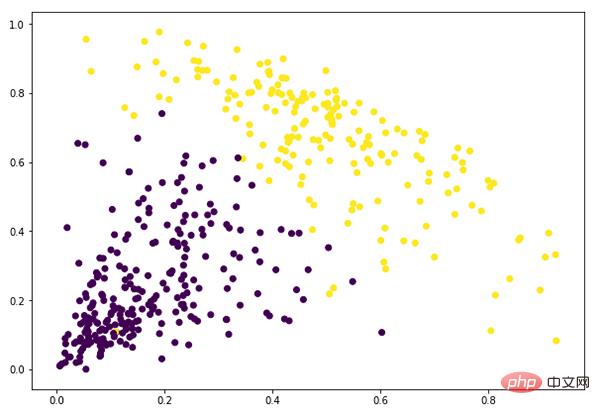
At this point we have successfully completed clustering.
The above is the detailed content of Understanding hierarchical clustering in one article (Python code). For more information, please follow other related articles on the PHP Chinese website!

Hot AI Tools

Undresser.AI Undress
AI-powered app for creating realistic nude photos

AI Clothes Remover
Online AI tool for removing clothes from photos.

Undress AI Tool
Undress images for free

Clothoff.io
AI clothes remover

AI Hentai Generator
Generate AI Hentai for free.

Hot Article
Hot Tools

Notepad++7.3.1
Easy-to-use and free code editor

SublimeText3 Chinese version
Chinese version, very easy to use

Zend Studio 13.0.1
Powerful PHP integrated development environment

Dreamweaver CS6
Visual web development tools

SublimeText3 Mac version
God-level code editing software (SublimeText3)
Hot Topics
 1376
1376
 52
52

 What is the reason why PS keeps showing loading?
Apr 06, 2025 pm 06:39 PM
What is the reason why PS keeps showing loading?
Apr 06, 2025 pm 06:39 PM
PS "Loading" problems are caused by resource access or processing problems: hard disk reading speed is slow or bad: Use CrystalDiskInfo to check the hard disk health and replace the problematic hard disk. Insufficient memory: Upgrade memory to meet PS's needs for high-resolution images and complex layer processing. Graphics card drivers are outdated or corrupted: Update the drivers to optimize communication between the PS and the graphics card. File paths are too long or file names have special characters: use short paths and avoid special characters. PS's own problem: Reinstall or repair the PS installer.
 How to solve the problem of loading when PS is started?
Apr 06, 2025 pm 06:36 PM
How to solve the problem of loading when PS is started?
Apr 06, 2025 pm 06:36 PM
A PS stuck on "Loading" when booting can be caused by various reasons: Disable corrupt or conflicting plugins. Delete or rename a corrupted configuration file. Close unnecessary programs or upgrade memory to avoid insufficient memory. Upgrade to a solid-state drive to speed up hard drive reading. Reinstalling PS to repair corrupt system files or installation package issues. View error information during the startup process of error log analysis.
 How to solve the problem of loading when the PS opens the file?
Apr 06, 2025 pm 06:33 PM
How to solve the problem of loading when the PS opens the file?
Apr 06, 2025 pm 06:33 PM
"Loading" stuttering occurs when opening a file on PS. The reasons may include: too large or corrupted file, insufficient memory, slow hard disk speed, graphics card driver problems, PS version or plug-in conflicts. The solutions are: check file size and integrity, increase memory, upgrade hard disk, update graphics card driver, uninstall or disable suspicious plug-ins, and reinstall PS. This problem can be effectively solved by gradually checking and making good use of PS performance settings and developing good file management habits.
 How to use mysql after installation
Apr 08, 2025 am 11:48 AM
How to use mysql after installation
Apr 08, 2025 am 11:48 AM
The article introduces the operation of MySQL database. First, you need to install a MySQL client, such as MySQLWorkbench or command line client. 1. Use the mysql-uroot-p command to connect to the server and log in with the root account password; 2. Use CREATEDATABASE to create a database, and USE select a database; 3. Use CREATETABLE to create a table, define fields and data types; 4. Use INSERTINTO to insert data, query data, update data by UPDATE, and delete data by DELETE. Only by mastering these steps, learning to deal with common problems and optimizing database performance can you use MySQL efficiently.
 How does PS feathering control the softness of the transition?
Apr 06, 2025 pm 07:33 PM
How does PS feathering control the softness of the transition?
Apr 06, 2025 pm 07:33 PM
The key to feather control is to understand its gradual nature. PS itself does not provide the option to directly control the gradient curve, but you can flexibly adjust the radius and gradient softness by multiple feathering, matching masks, and fine selections to achieve a natural transition effect.
 How to optimize database performance after mysql installation
Apr 08, 2025 am 11:36 AM
How to optimize database performance after mysql installation
Apr 08, 2025 am 11:36 AM
MySQL performance optimization needs to start from three aspects: installation configuration, indexing and query optimization, monitoring and tuning. 1. After installation, you need to adjust the my.cnf file according to the server configuration, such as the innodb_buffer_pool_size parameter, and close query_cache_size; 2. Create a suitable index to avoid excessive indexes, and optimize query statements, such as using the EXPLAIN command to analyze the execution plan; 3. Use MySQL's own monitoring tool (SHOWPROCESSLIST, SHOWSTATUS) to monitor the database health, and regularly back up and organize the database. Only by continuously optimizing these steps can the performance of MySQL database be improved.
 Do mysql need to pay
Apr 08, 2025 pm 05:36 PM
Do mysql need to pay
Apr 08, 2025 pm 05:36 PM
MySQL has a free community version and a paid enterprise version. The community version can be used and modified for free, but the support is limited and is suitable for applications with low stability requirements and strong technical capabilities. The Enterprise Edition provides comprehensive commercial support for applications that require a stable, reliable, high-performance database and willing to pay for support. Factors considered when choosing a version include application criticality, budgeting, and technical skills. There is no perfect option, only the most suitable option, and you need to choose carefully according to the specific situation.
 How to set up PS feathering?
Apr 06, 2025 pm 07:36 PM
How to set up PS feathering?
Apr 06, 2025 pm 07:36 PM
PS feathering is an image edge blur effect, which is achieved by weighted average of pixels in the edge area. Setting the feather radius can control the degree of blur, and the larger the value, the more blurred it is. Flexible adjustment of the radius can optimize the effect according to images and needs. For example, using a smaller radius to maintain details when processing character photos, and using a larger radius to create a hazy feeling when processing art works. However, it should be noted that too large the radius can easily lose edge details, and too small the effect will not be obvious. The feathering effect is affected by the image resolution and needs to be adjusted according to image understanding and effect grasp.
